
GLOBAL EQUITY MARKETS – June 20, 2020
REVIEW
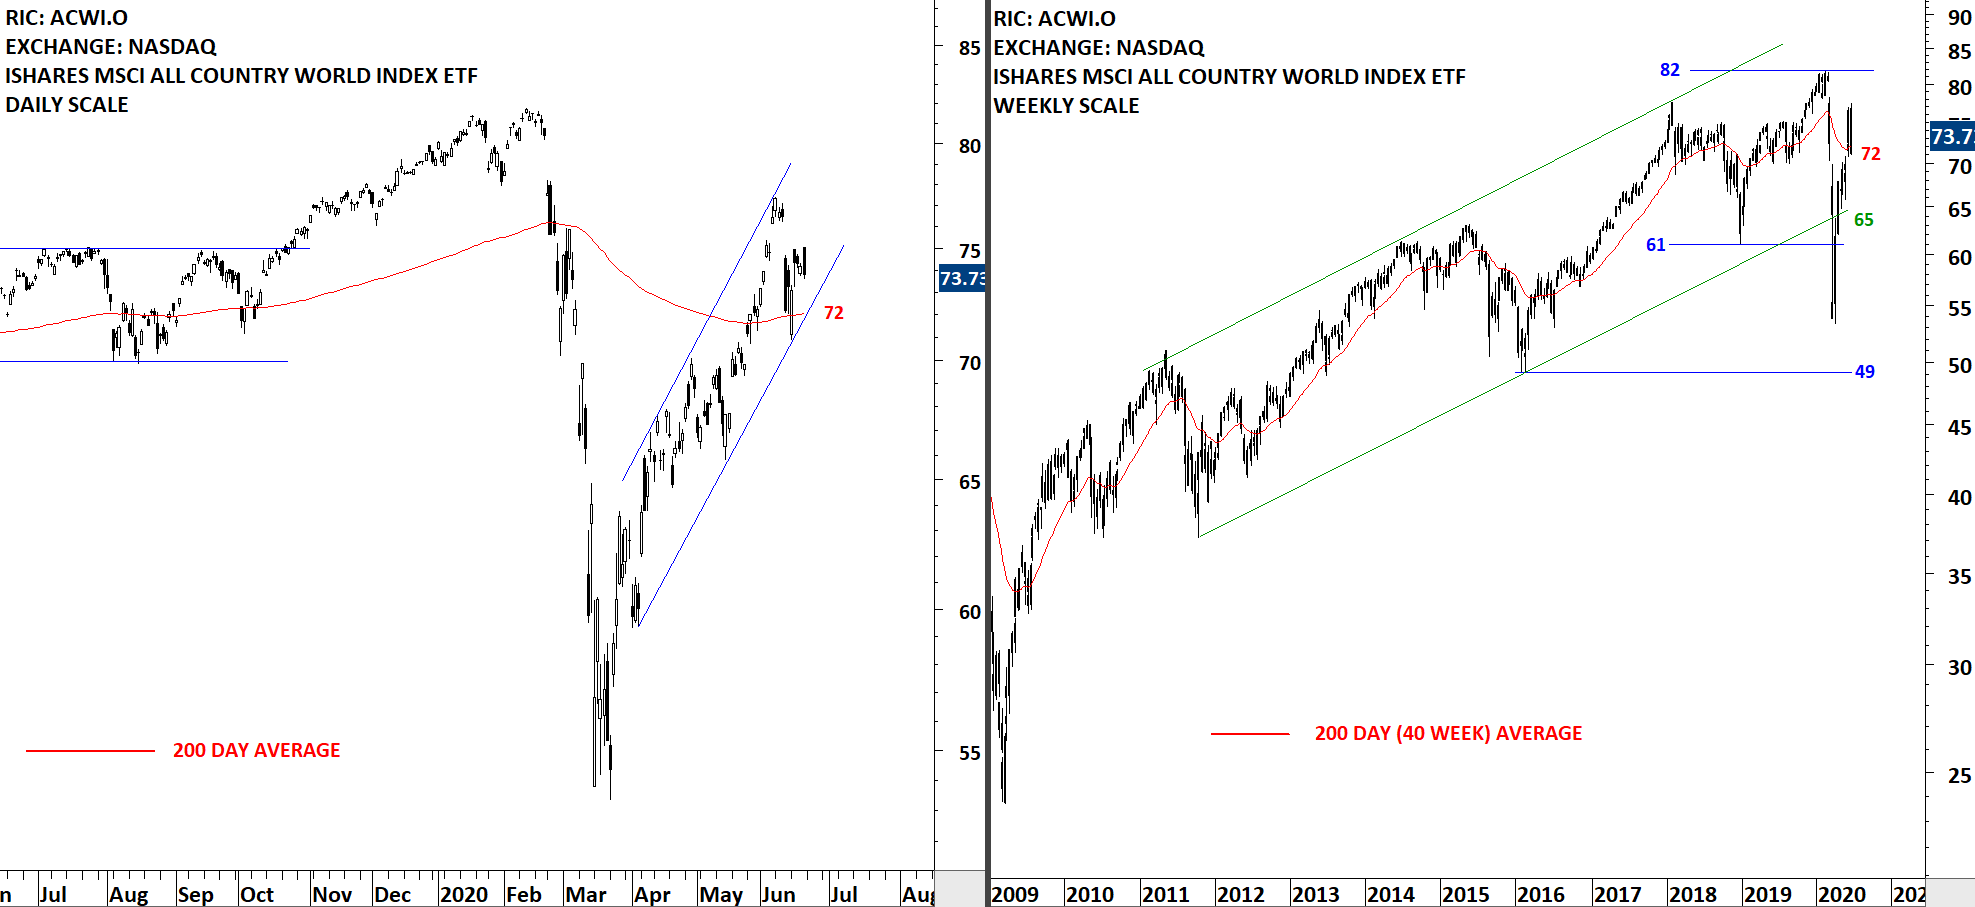
The benchmark for the Global equity markets performance, the iShares MSCI All Country World Index ETF (ACWI.O) pulled back to its 200-day moving average that was acting as support at 72 levels. Last two month's price action can be identified as a rising channel. Price can remain inside the trend channel. Both the lower boundary of the trend channel and the 200-day average are forming support around the same area. For bullish interpretation to remain intact, price should stabilize above the 200-day average.
 Read More
GLOBAL EQUITY MARKETS – June 13, 2020
REVIEW
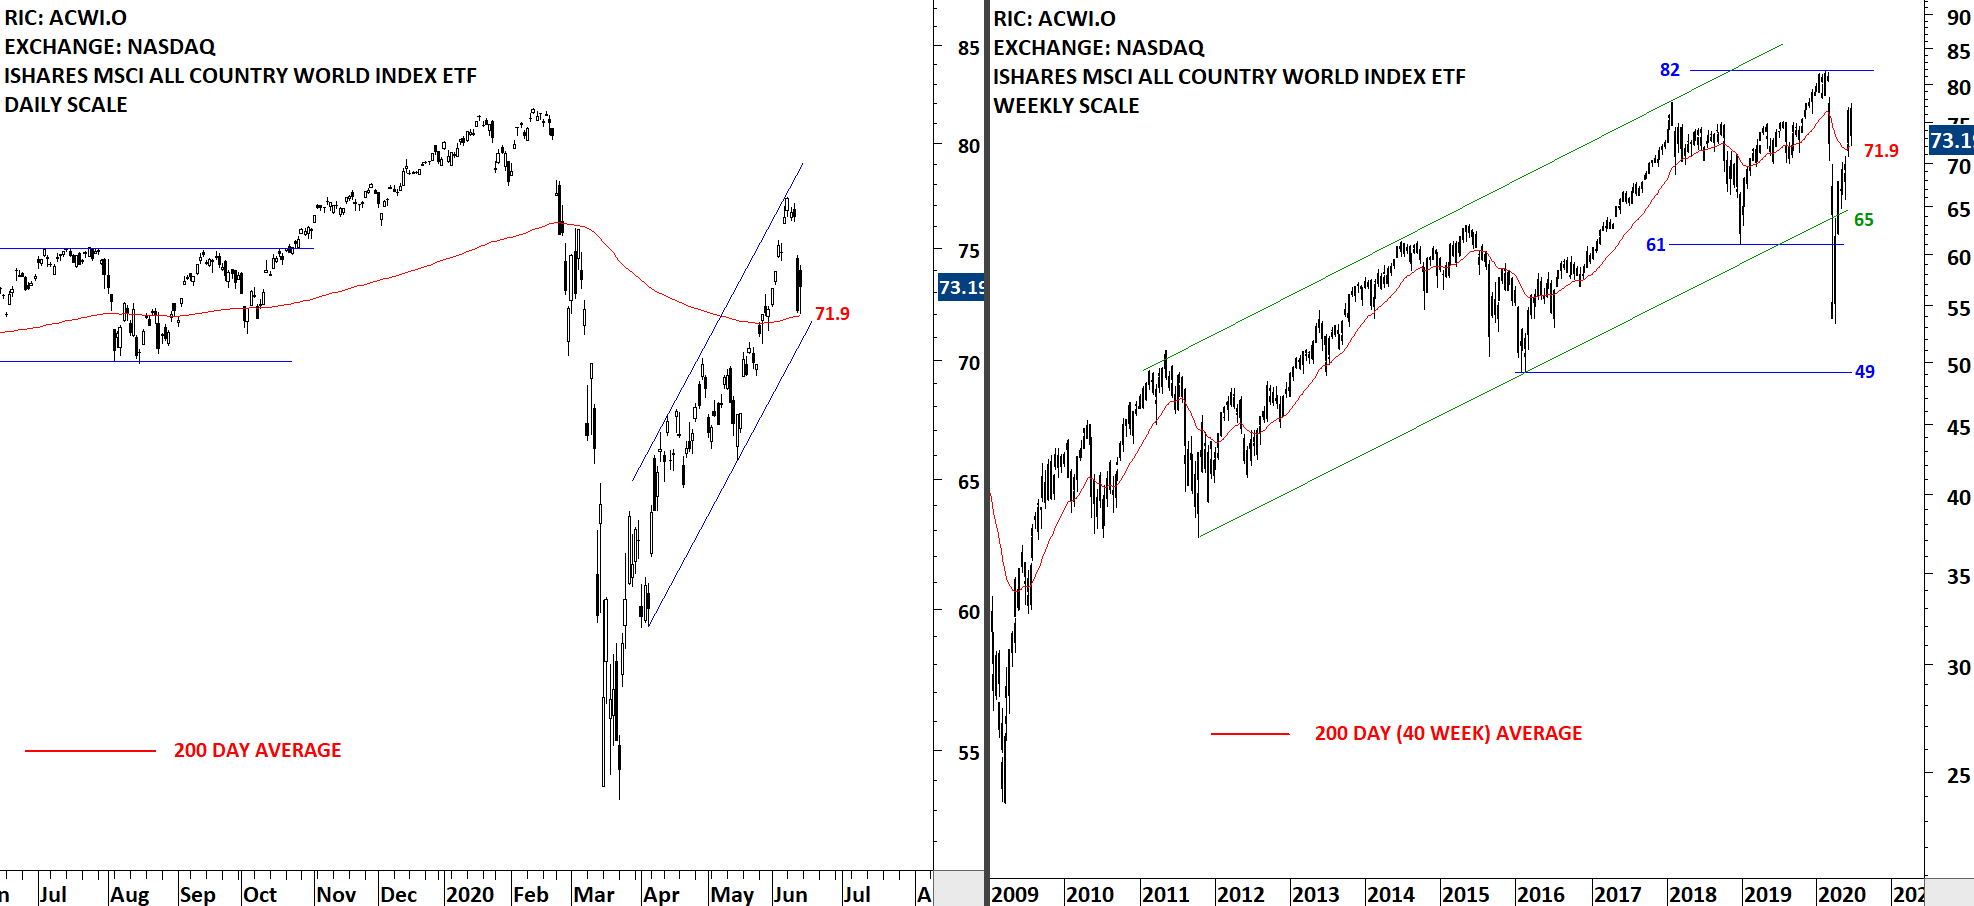
The benchmark for the Global equity markets performance, the iShares MSCI All Country World Index ETF (ACWI.O) pulled back to its 200-day moving average that was acting as support at 71.9 levels. Last two month's price action can be identified as a rising channel. Price can remain inside the trend channel. The acceleration on the upside took a parabolic shape in the short-term. Parabolic price actions are not sustainable. Both the lower boundary of the trend channel and the 200-day average are forming support around the same area. For bullish interpretation to remain intact, price should stabilize above the 200-day average.
 Read More
INTERIM UPDATE – June 12, 2020
I start my research on Mondays and finalize by end of day Thursday. Friday is dedicated to putting all ideas to the report format. During the week I come across good setups and those are featured in the weekly report. However, there are those that pop during the week and is worth bringing to your attention before the week finalizes. Below is one latest additions to Tech Charts watchlist that may experience breakout. This chart will also be included in the weekly update.
Read More
