
GLOBAL EQUITY MARKETS – August 8, 2020
REVIEW
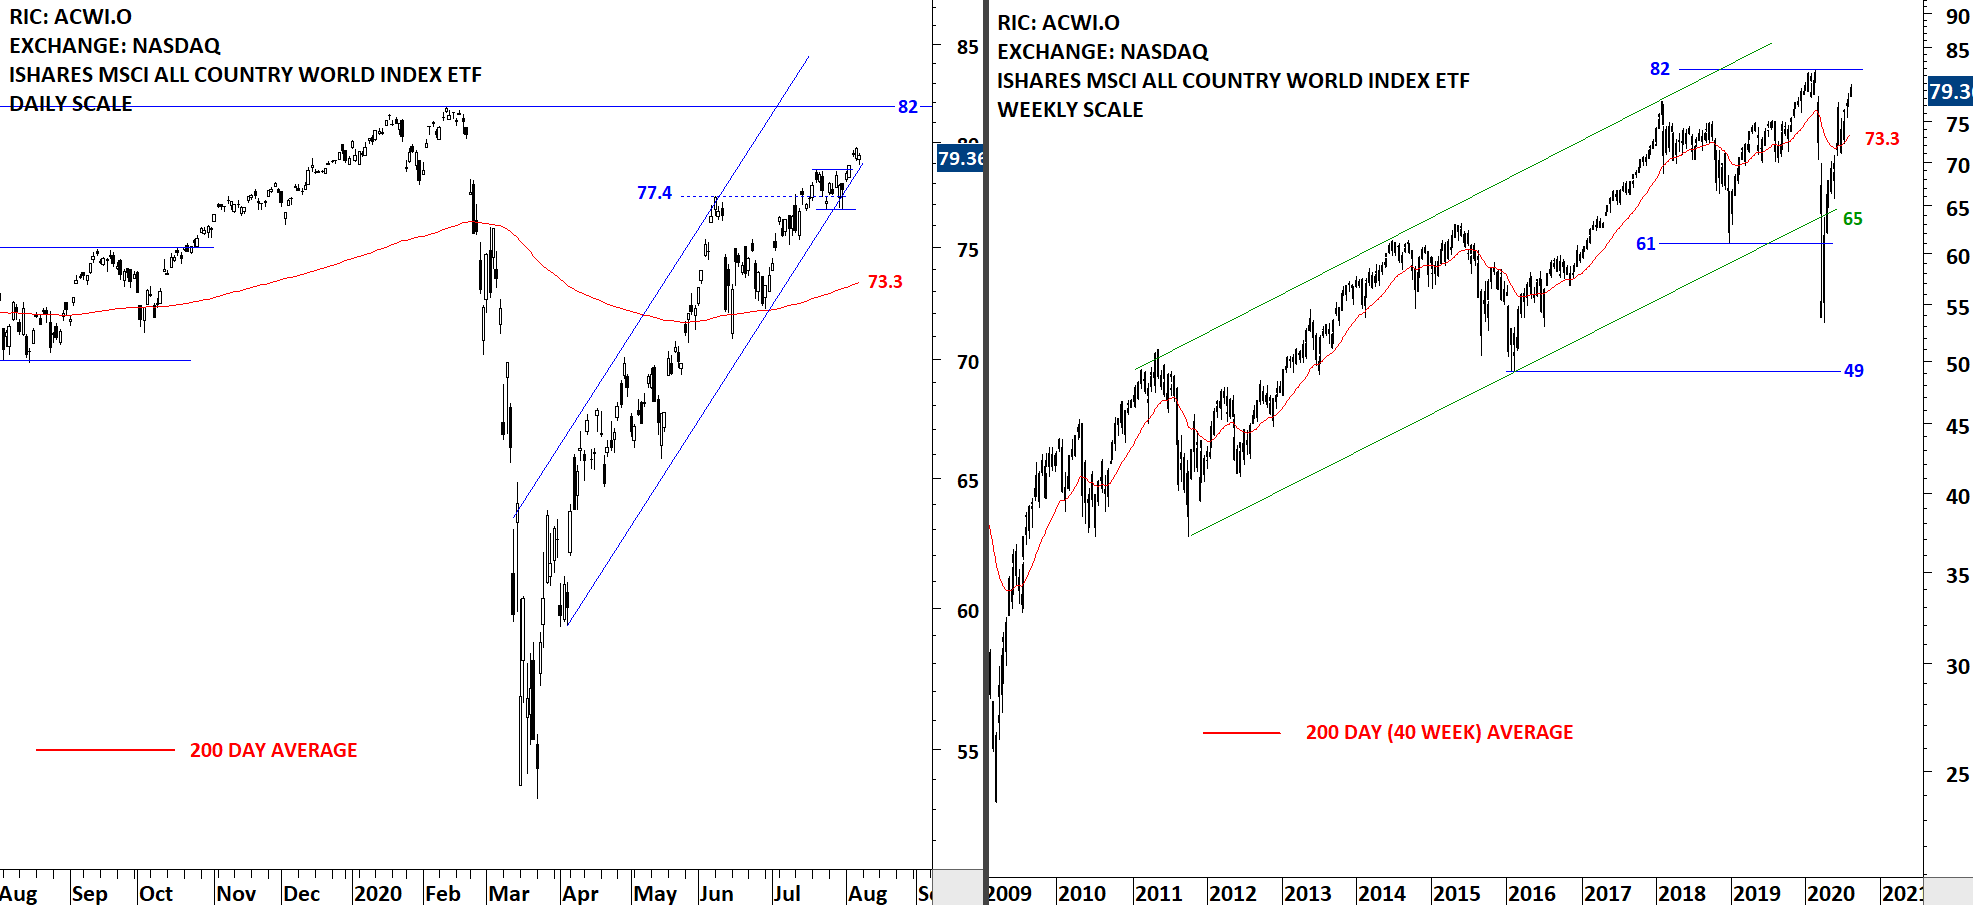
The benchmark for the Global equity markets performance, the iShares MSCI All Country World Index ETF (ACWI.O) cleared its short-term consolidation on the upside. Last three month's price action can be identified as a rising channel. Price is trying to remain inside the trend channel and so far the price remained above the 200-day average. Uptrend is intact. The 200-day moving average is forming support at 73.3 levels. Breakdown below the lower boundary of possible trend channel can result in a pullback towards the 200-day average at 73.3 levels. Volatility is low and we can expect another trend period soon. If it is a correction with the breakdown of the trend channel, it should develop fast, towards 73.3 levels. Pre-pandemic high stands at 82 levels, which is the next important resistance.
 Read More
GLOBAL EQUITY MARKETS – August 1, 2020 (REVIEW SECTION)
REVIEW
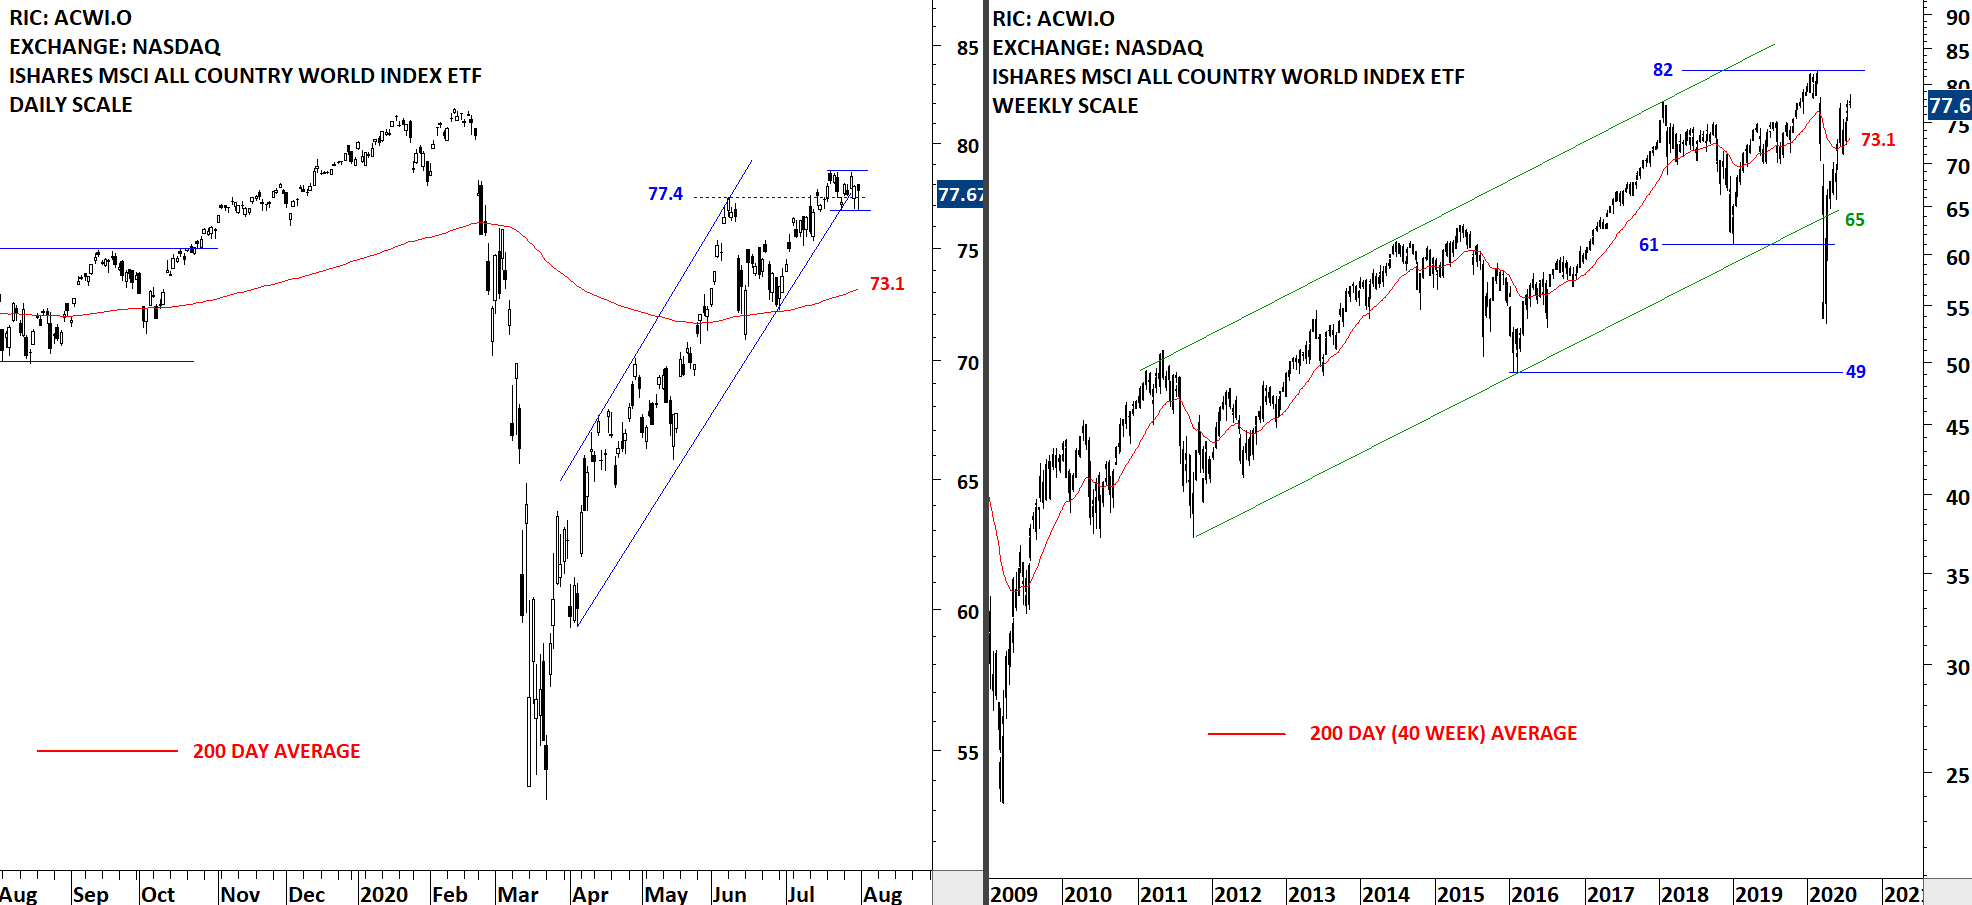
The benchmark for the Global equity markets performance, the iShares MSCI All Country World Index ETF (ACWI.O) is consolidating near its minor high at 77.4 levels. Last three month's price action can be identified as a rising channel. Price is trying to remain inside the trend channel and so far the price remained above the 200-day average. 77.4 levels acted as short-term resistance. Uptrend is intact. The 200-day moving average is forming support at 73.1 levels. Breakdown below the lower boundary of possible trend channel can result in a pullback towards the 200-day average at 73.1 levels. Volatility is low and we can expect another trend period soon. If it is a correction with the breakdown of the trend channel, it should develop fast, towards 73.1 levels. Pre-pandemic high stands at 82 levels, which is the next important resistance.
 Read More
GLOBAL EQUITY MARKETS – August 1, 2020 (ALERTS & WATCHLIST)
Dear Tech Charts Members,
Due to several reasons (size, end of month expanded review including more markets etc.) this week's report will be sent out in two separate communications. Below includes the Breakout Alerts and Watchlist. Later in the day I will send out a comprehensive review of Global Markets. An e-mail will be sent out once the Review section of the report is uploaded to website.
Read More
