
INTERIM UPDATE – October 9, 2020
I start my research on Mondays and finalize by end of day Thursday. Friday is dedicated to putting all ideas to the report format. During the week I come across good setups and those are featured in the weekly report. However, there are those that pop during the week and is worth bringing to your attention before the week finalizes. Below are latest additions to Tech Charts watchlist in case they experience breakouts in the last day of the week. These charts will also be included in the weekly update.
Read More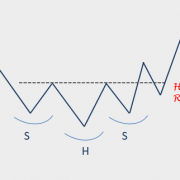
H&S Bottom Reversal with a Hard Re-Test

GLOBAL EQUITY MARKETS – October 3, 2020
REVIEW
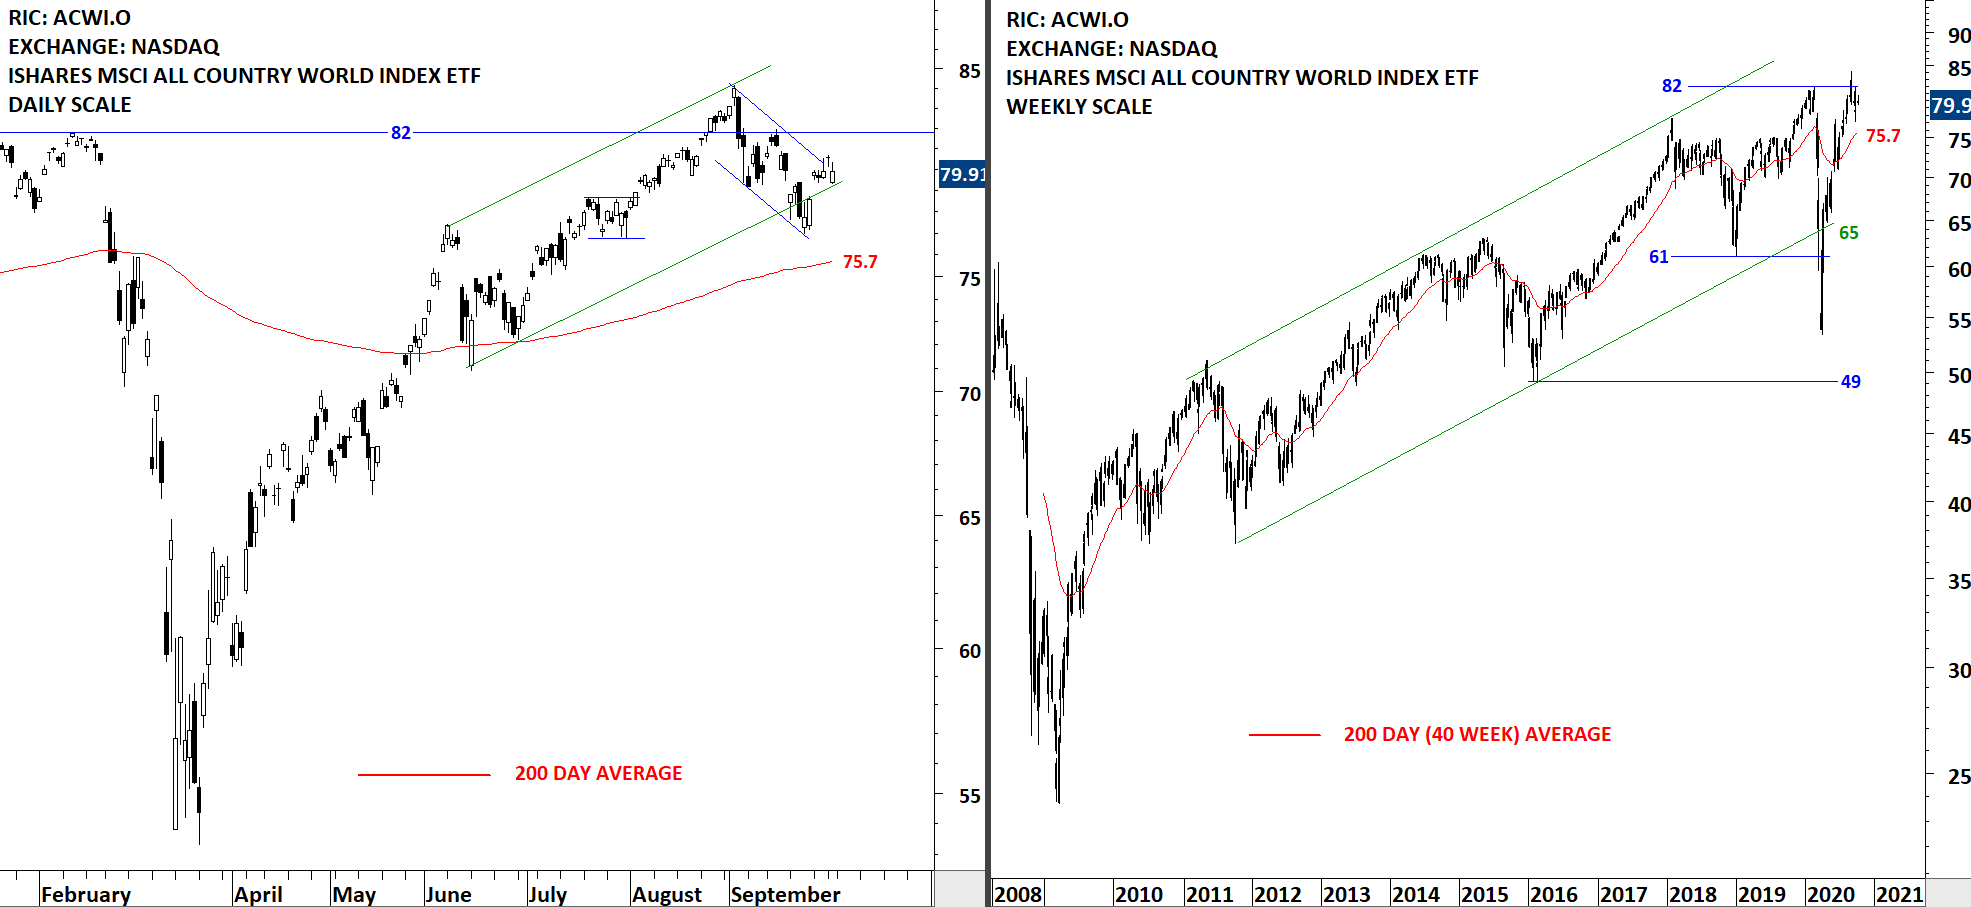
The benchmark for the Global equity markets performance, the iShares MSCI All Country World Index ETF (ACWI.O) continues to consolidate above its 200-day average. I analyze the latest correction as a reversion to the mean. As we are still above the 200-day average for the ACWI ETF, It is difficult for me to put my bear market cap on. I've discussed the possibility of a short-term H&S top on the ETF, but so far we haven't seen a follow through which puts the bearish interpretation in question. There is no clear chart pattern development on the daily scale price chart.
 Read More
