
INTERIM UPDATE – November 6, 2020
I start my research on Mondays and finalize by end of day Thursday. Friday is dedicated to putting all ideas to the report format. During the week I come across good setups and those are featured in the weekly report. However, there are those that pop during the week and is worth bringing to your attention before the week finalizes. Below are latest additions to Tech Charts watchlist in case they experience breakouts in the last day of the week. These charts will also be included in the weekly update.
Read More
GLOBAL EQUITY MARKETS – October 31, 2020
REVIEW
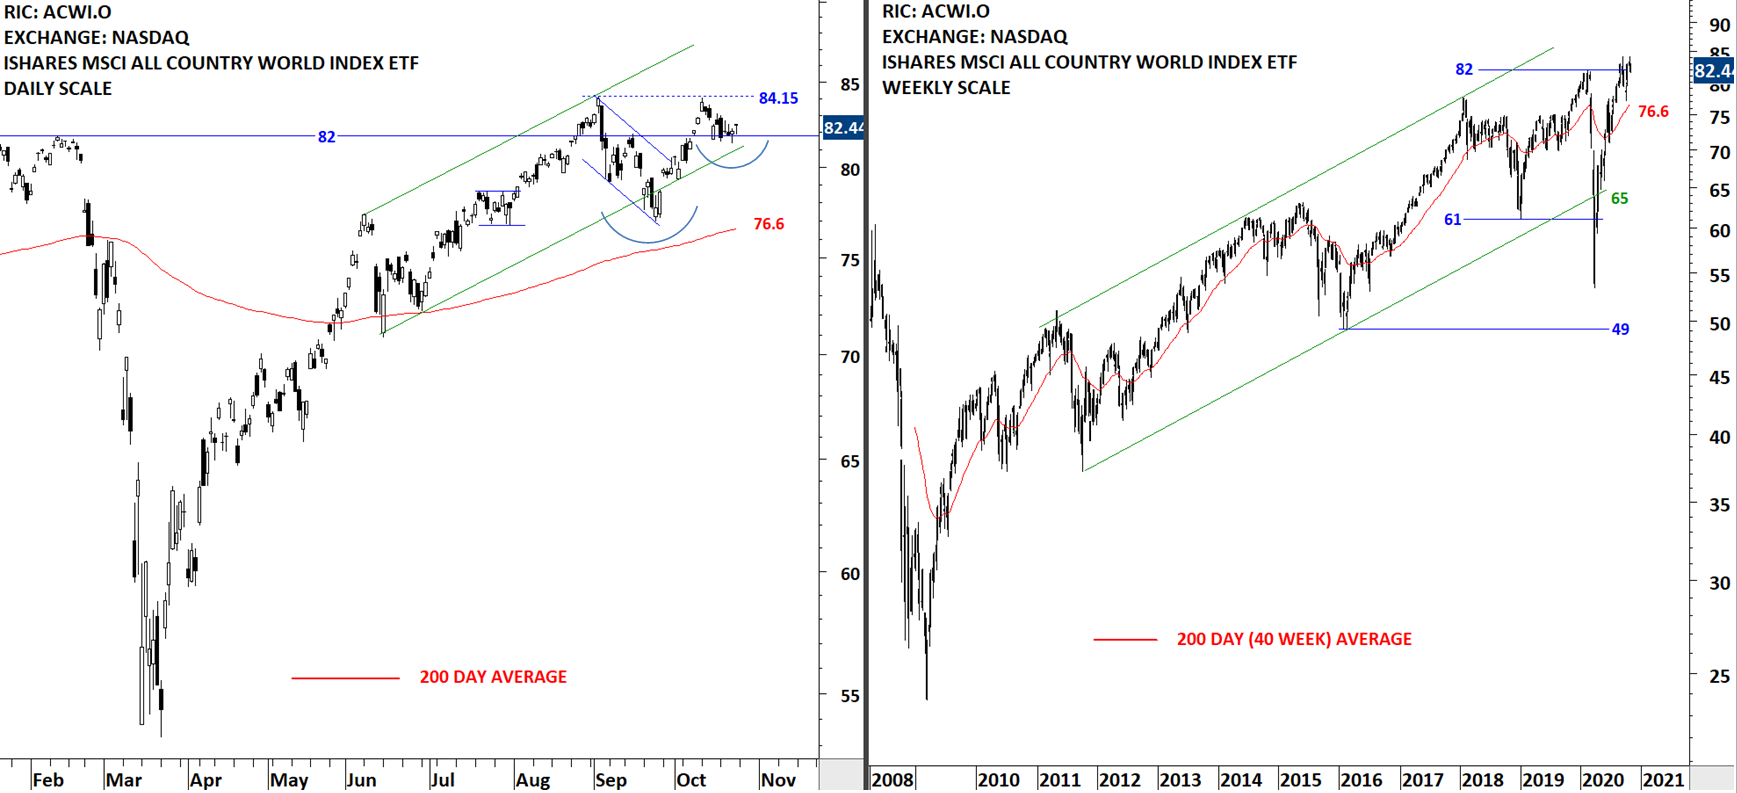
The benchmark for the Global equity markets performance, the iShares MSCI All Country World Index ETF (ACWI.O) resumed its correction after finding resistance at 84.15 levels, the minor high. The uptrend on Global equities is intact and ACWI ETF continues to trend higher above its 200-day average which is acting as support at 76.7 levels. Global equities are searching for direction in the short-term. Price is at an important inflection point. Last 2 month's consolidation between 84.15 and 76.7 levels can act as Read More

GLOBAL EQUITY MARKETS – October 24, 2020
REVIEW
The benchmark for the Global equity markets performance, the iShares MSCI All Country World Index ETF (ACWI.O) found support at 82 levels, Jan-Feb 2020 highs. The uptrend on Global equities is intact and ACWI ETF continues to trend higher above its 200-day average which is acting as support at 76.6 levels. Global equities are searching for direction in the short-term. There is a possibility of a cup & handle continuation chart pattern forming on the ETF with the handle part being in progress. 84.15 continues to act as resistance.
 Read More
