
GLOBAL EQUITY MARKETS – August 16, 2025
REVIEW
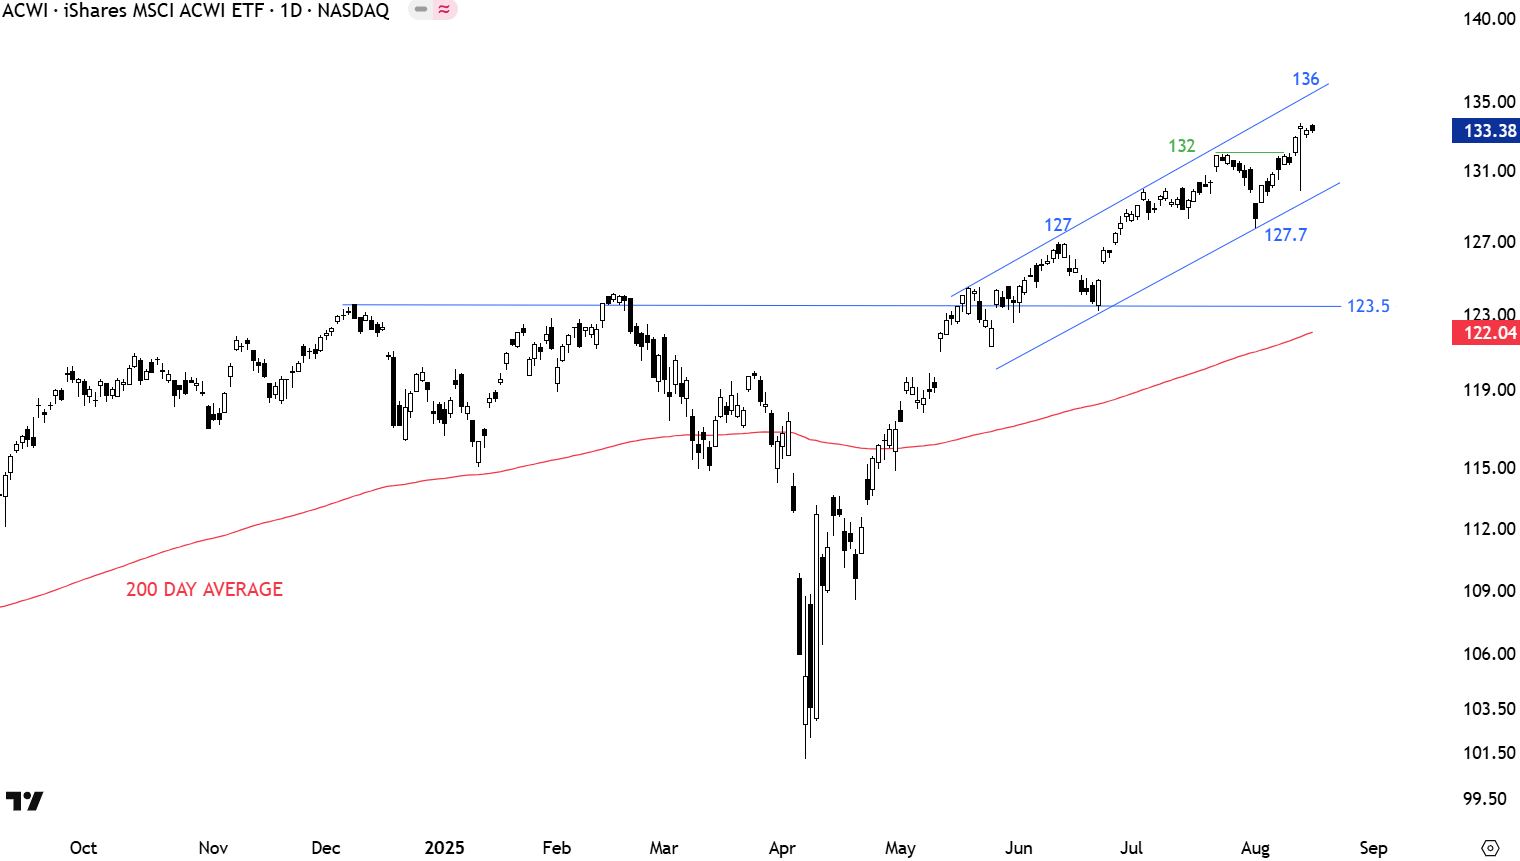
The benchmark for the Global equity markets performance, the iShares MSCI All Country World Index ETF (ACWI.O) did a round trip after the sharp sell-off and reached its all-time highs around 123.5 levels. Following the breakout above the horizontal resistance at 123.5 levels the ETF has been trending higher in a channel. Price is respecting both boundaries. Support area is between 123.5 and 127.7 levels. Uptrend is intact.
 Read More
INTERIM UPDATE – Aug 14, 2025
I start my research on Mondays and finalize by end of day Thursday. Friday is dedicated to putting all ideas to the report format. During the week I come across good setups and those are featured in the weekly report. However, there are those that pop up during the week and is worth bringing to your attention before the week finalizes. Below are the latest additions to Tech Charts watchlist from Global equities that are close to breakout confirmation levels. These charts will be discussed in the weekend report as well.

GLOBAL EQUITY MARKETS – August 9, 2025
REVIEW
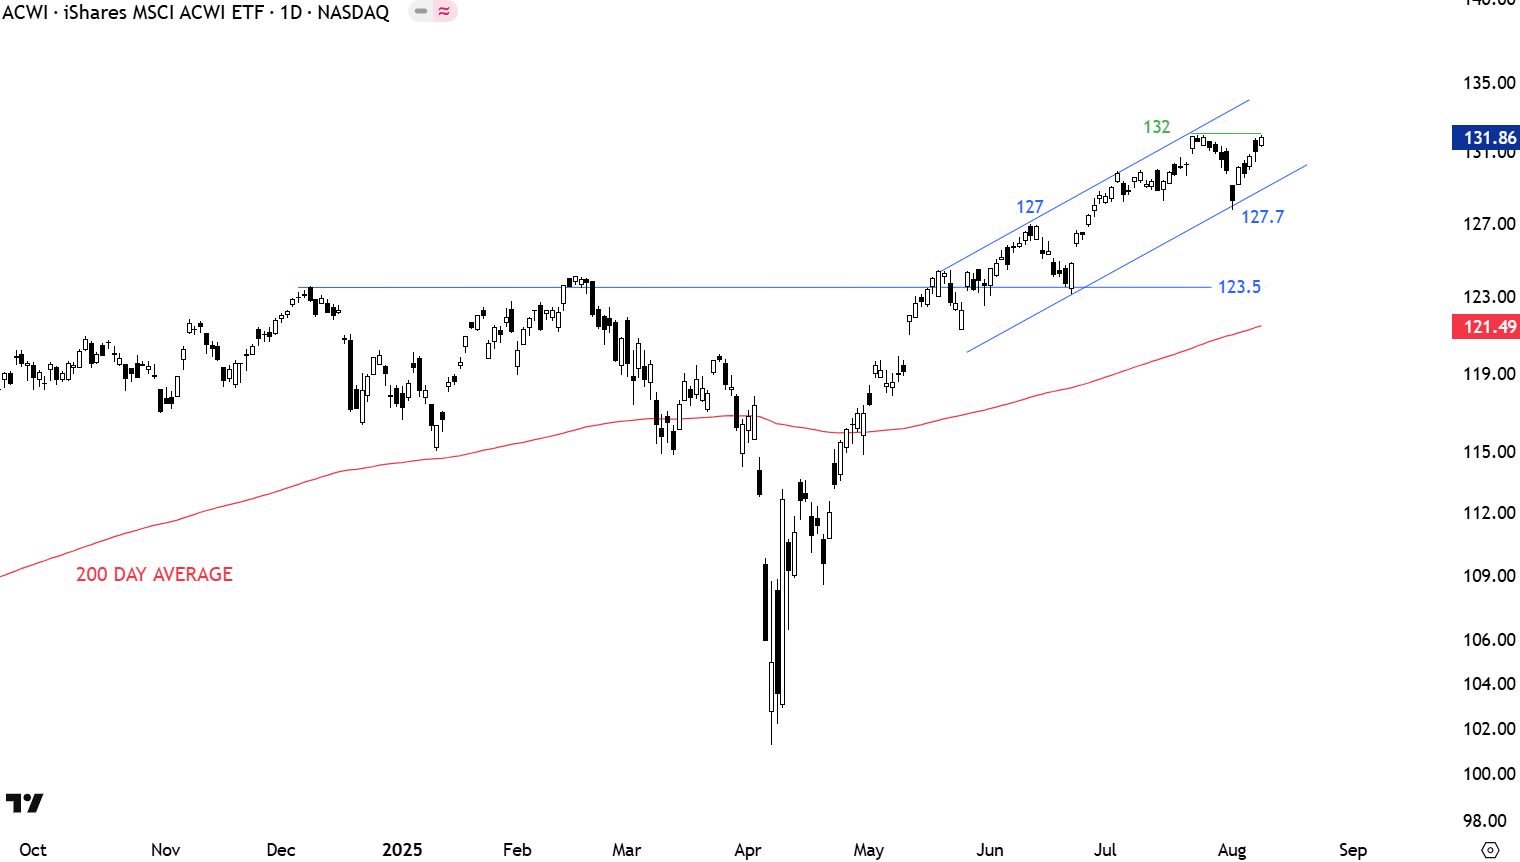
The benchmark for the Global equity markets performance, the iShares MSCI All Country World Index ETF (ACWI.O) did a round trip after the sharp sell-off and reached its all-time highs around 123.5 levels. The fact that the ETF cleared its 200-day average and moved significantly above it can be analyzed long-term positive as pullbacks and consolidations are likely to find support above the 200-day. A possible trend channel might be forming with price respecting both boundaries. Minor high at 132 levels can act as short-term resistance. Support area is between 123.5 and 127.7 levels. Uptrend is intact.
 Read More
