
GLOBAL EQUITY MARKETS – February 6, 2021
REVIEW
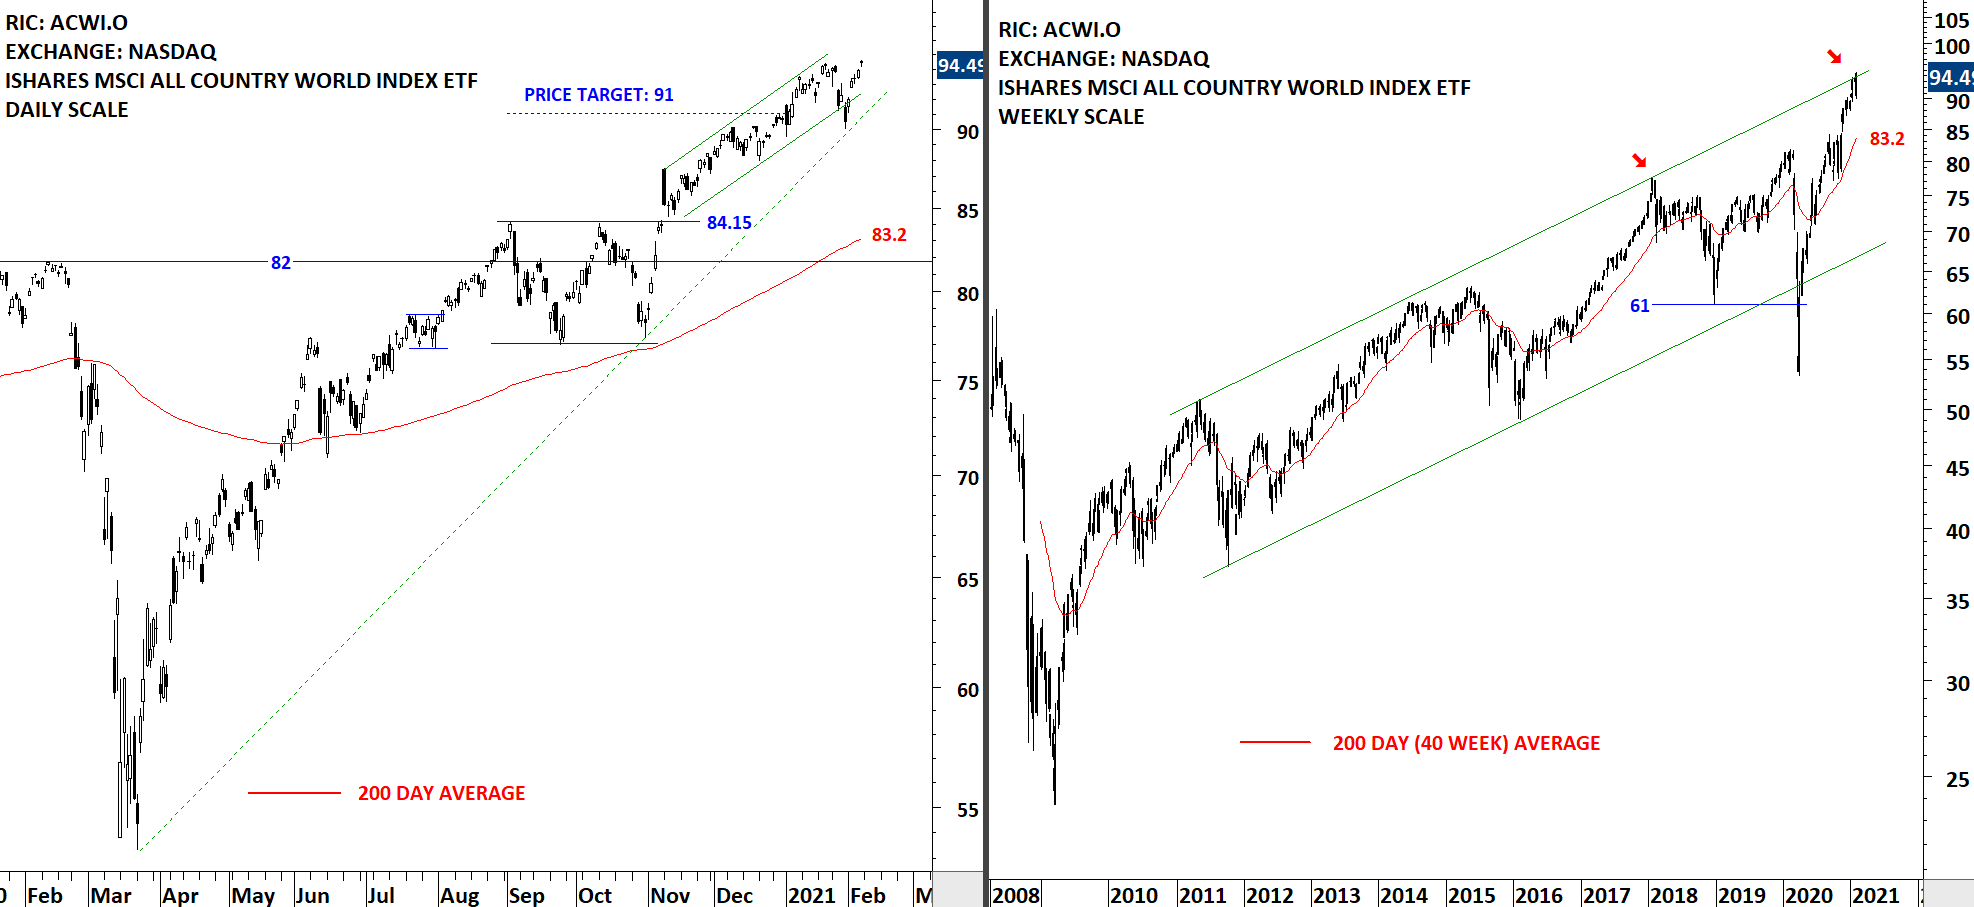
The benchmark for the Global equity markets performance, the iShares MSCI All Country World Index ETF (ACWI.O) had a short-term bear trap after breaching the lower boundary of the past 2 months uptrend at 92 levels. The ETF quickly recovered inside the trend channel and tested the minor high at 94.5 levels. The uptrend remains intact. It is important to note that price is at the upper boundary of the long-term trend channel, a possible resistance area. The 200-day moving average and the upper boundary of the previous short-term consolidation are forming support between 83.2 and 84.15 levels. Following week I will monitor how the ETF performs at the minor high. If it finds resistance at 94.5, it can retrace back to the minor low at 90 levels.
 Read More
GLOBAL EQUITY MARKETS – January 30, 2021
REVIEW
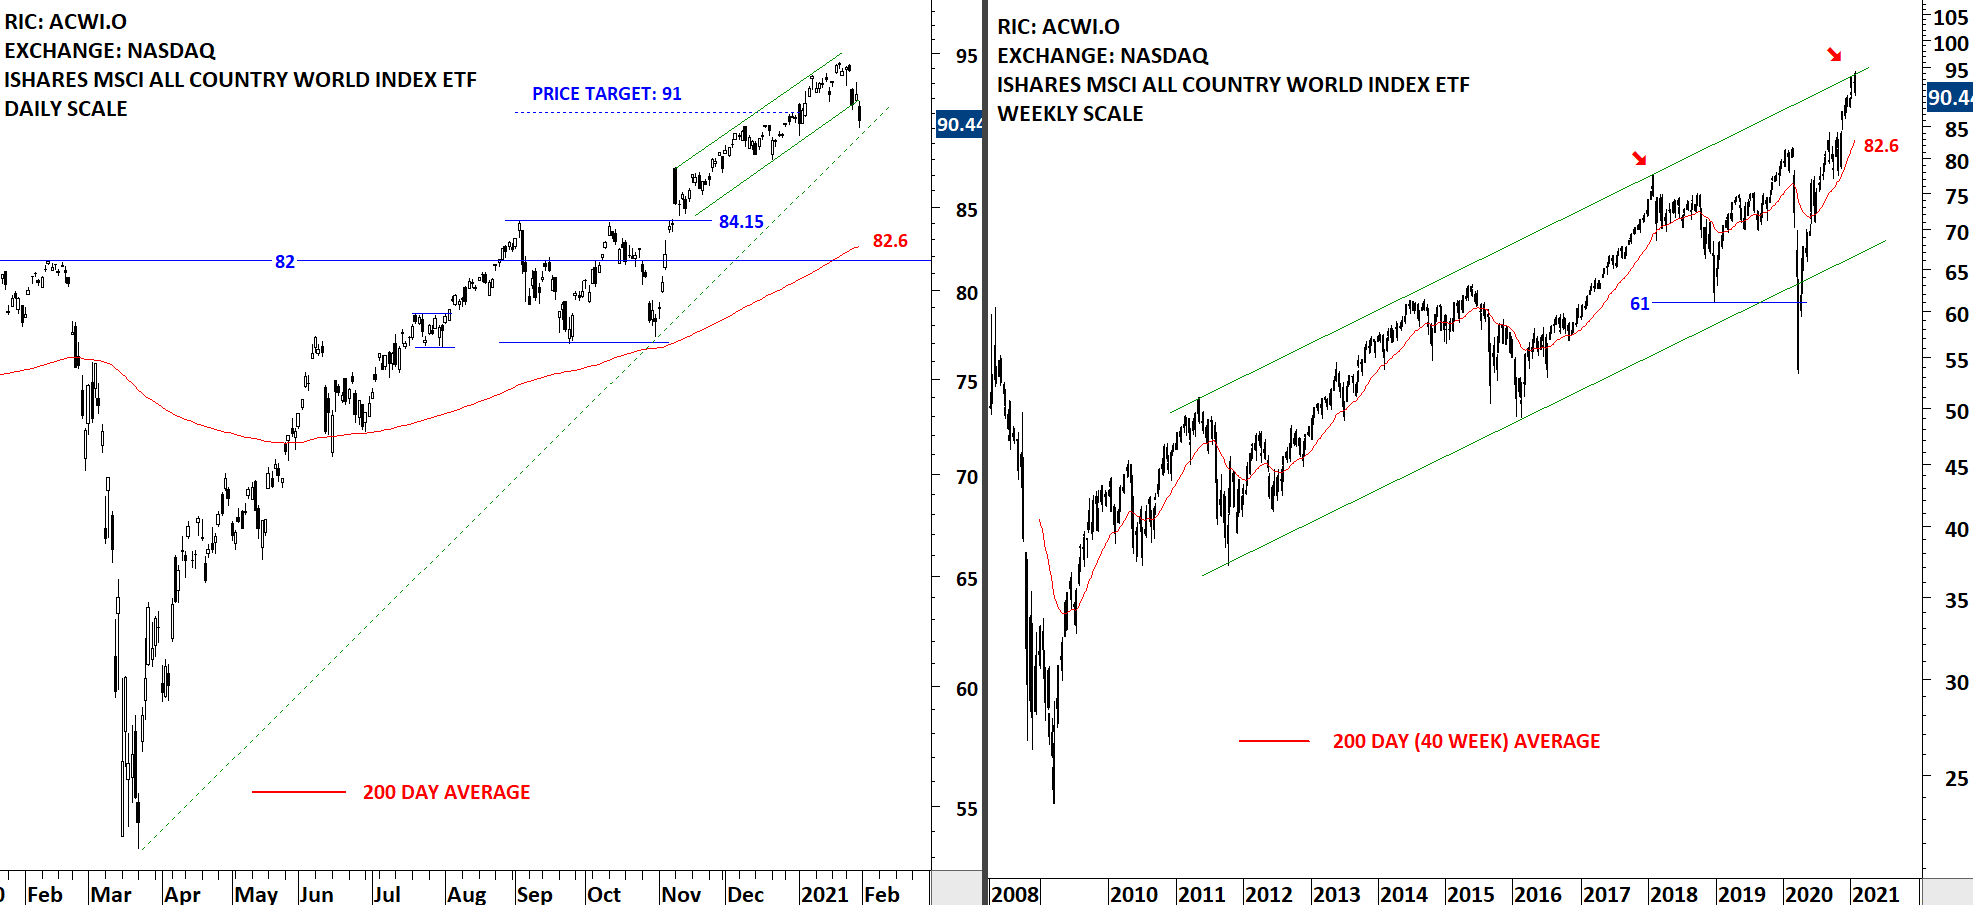
The benchmark for the Global equity markets performance, the iShares MSCI All Country World Index ETF (ACWI.O) experienced its first short-term pullback breaking down the lower boundary of the past 2 months uptrend at 92 levels. While the long-term uptrend is intact, the Global benchmark might be entering into a reversion to the mean stage where we see price pulling back to the 200-day average. The long-term price chart found resistance at the upper boundary of the multi year-long trend channel. The 200-day moving average and the upper boundary of the previous short-term consolidation are forming support between 82.6 and 84.15 levels.
 Read More
GLOBAL EQUITY MARKETS – January 23, 2021
REVIEW
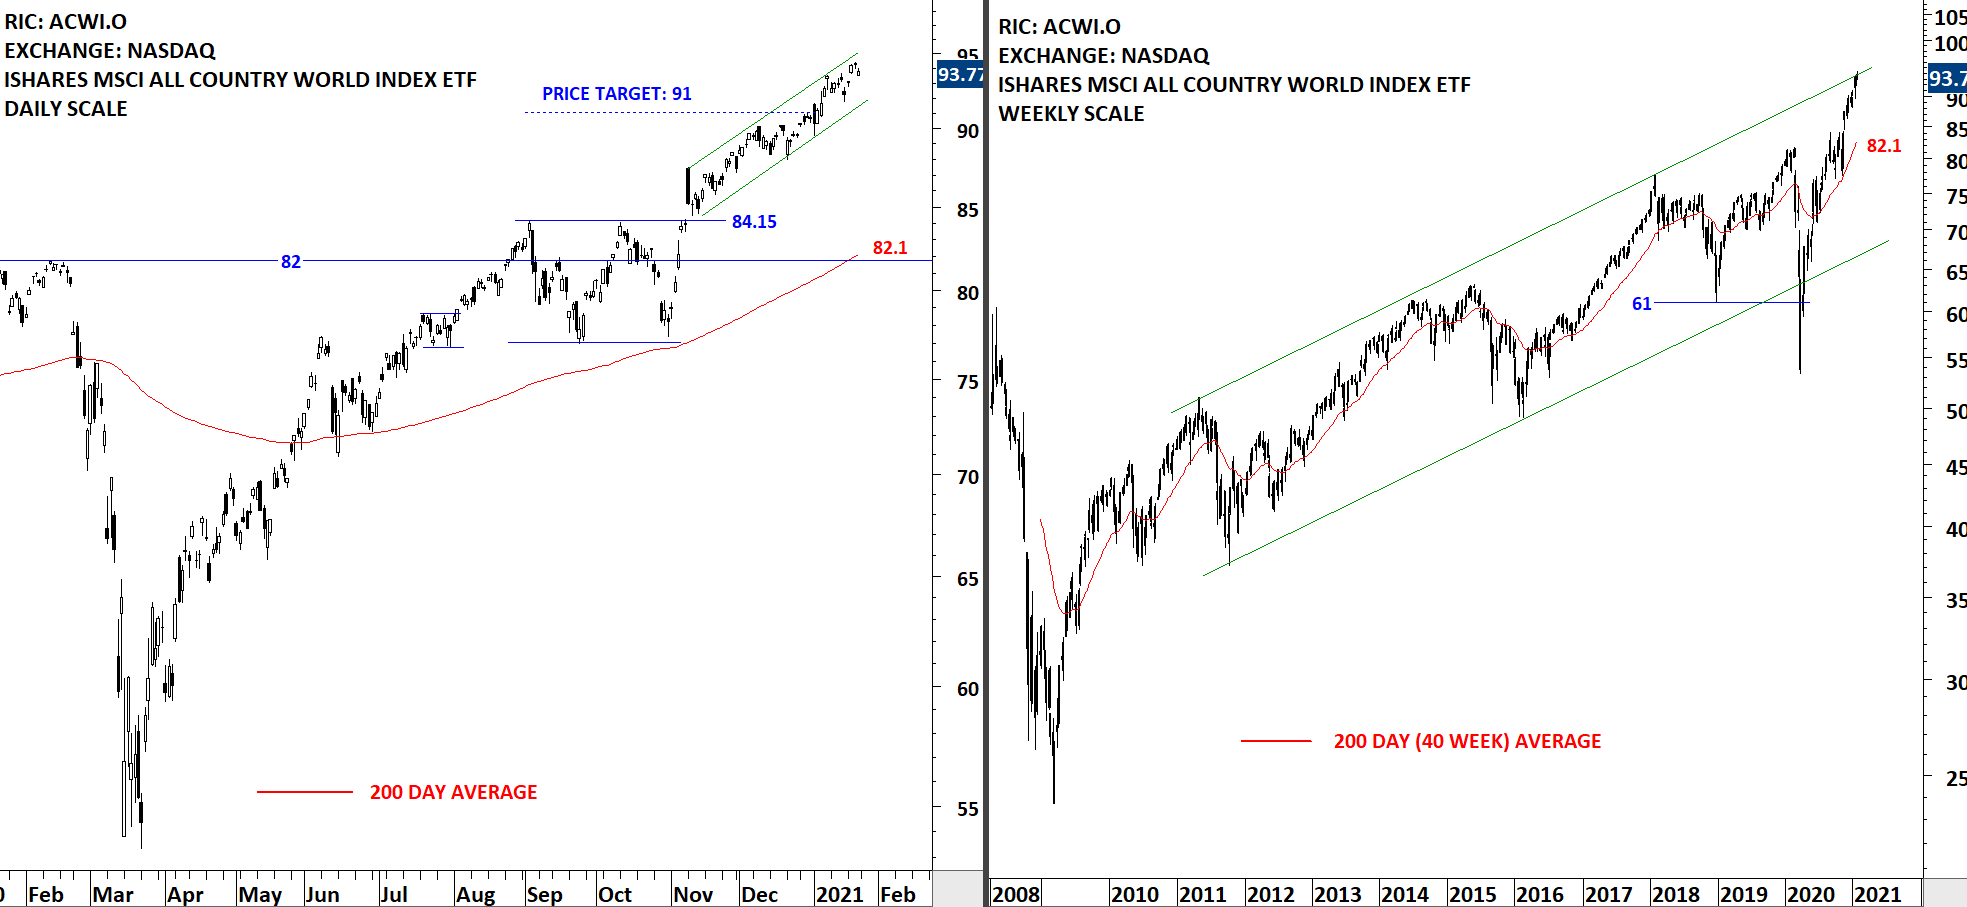
The benchmark for the Global equity markets performance, the iShares MSCI All Country World Index ETF (ACWI.O) resumed its uptrend past the rectangle chart pattern price target at 91 levels. On the weekly scale price chart of the ETF is also close to the upper boundary of the long-term uptrend channel. During any pullback 84.15 will act as support. The 200-day moving average, which I utilize as a trend filter, is rising as well, now at 82.1 levels. Uptrend is intact and there is no reversal chart pattern on daily scale price chart. The last 2 months uptrend formed a well-defined upward trend channel. The lower boundary can act as short-term support at 92 levels.
 Read More
