
GLOBAL EQUITY MARKETS – April 3, 2021
REVIEW
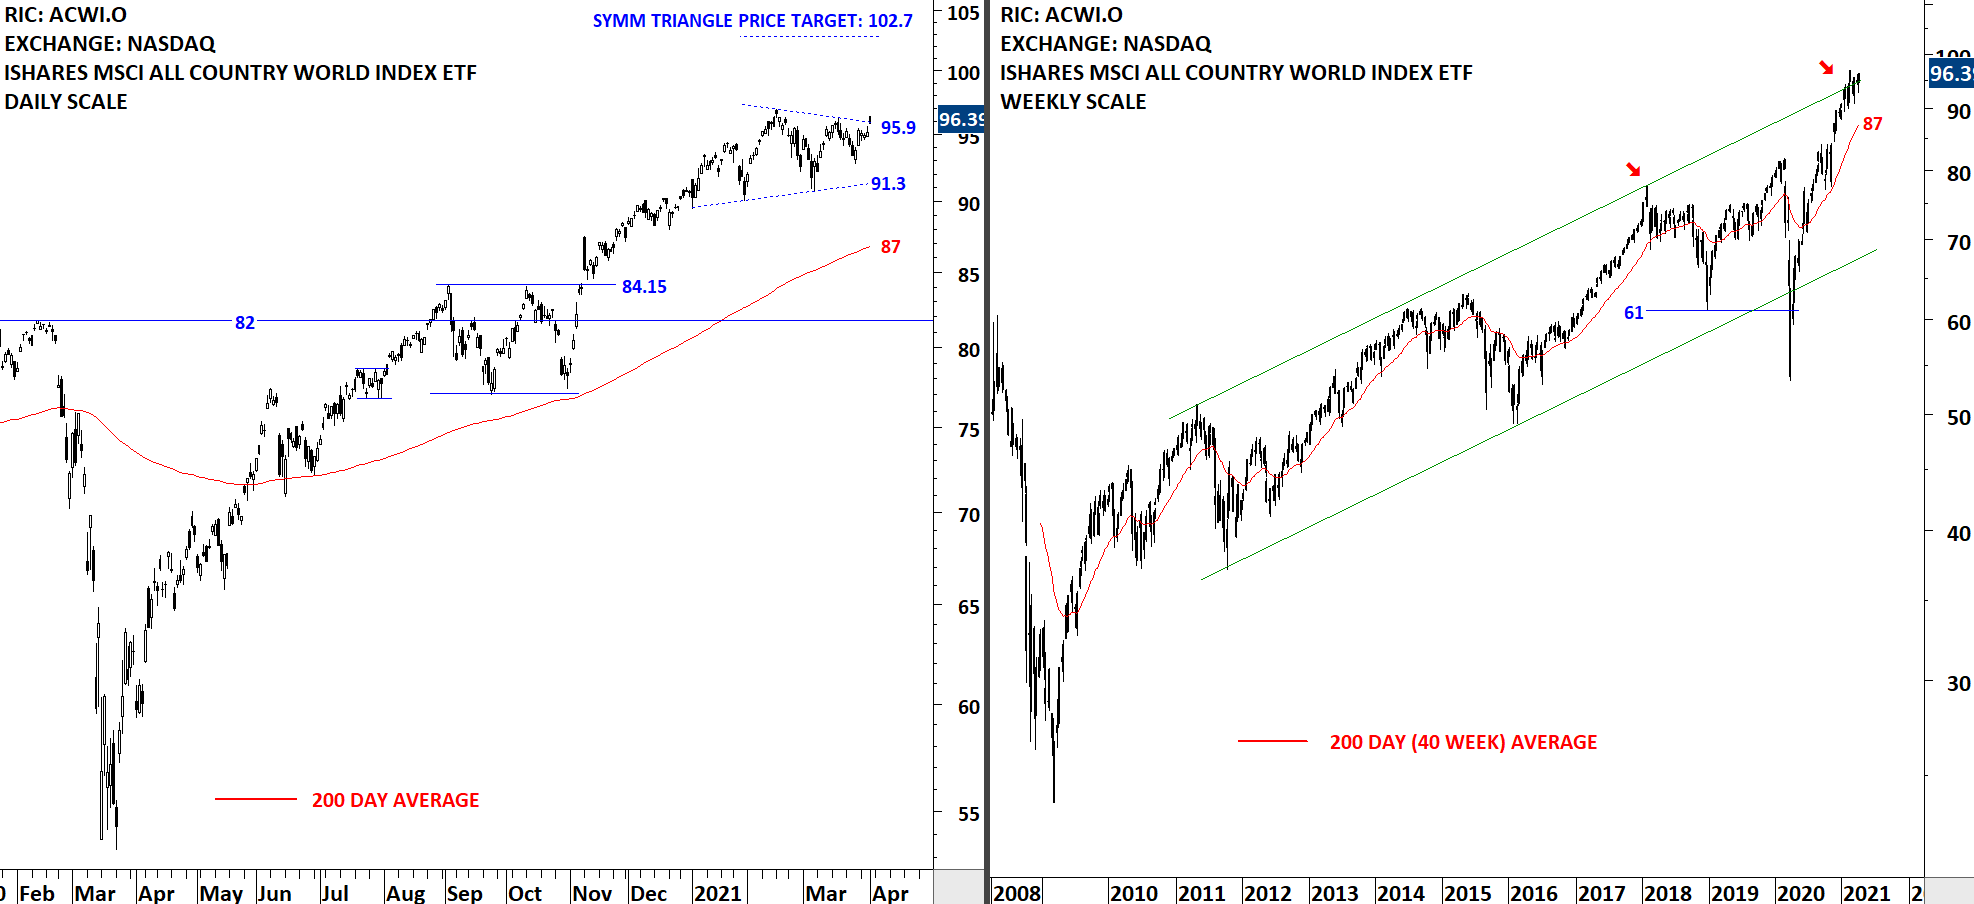
The benchmark for the Global equity markets performance, the iShares MSCI All Country World Index ETF (ACWI.O) is forming a sideways consolidation. Thursday's close challenged the upper boundary of a possible symmetrical triangle. We can conclude that the uptrend is intact. Breakout from the symmetrical triangle can push the ETF towards the possible price objective at 102.7 levels. As always the case with symmetrical triangles, the minor high will be a short-term hurdle.
 Read More
GLOBAL EQUITY MARKETS – March 27, 2021
REVIEW
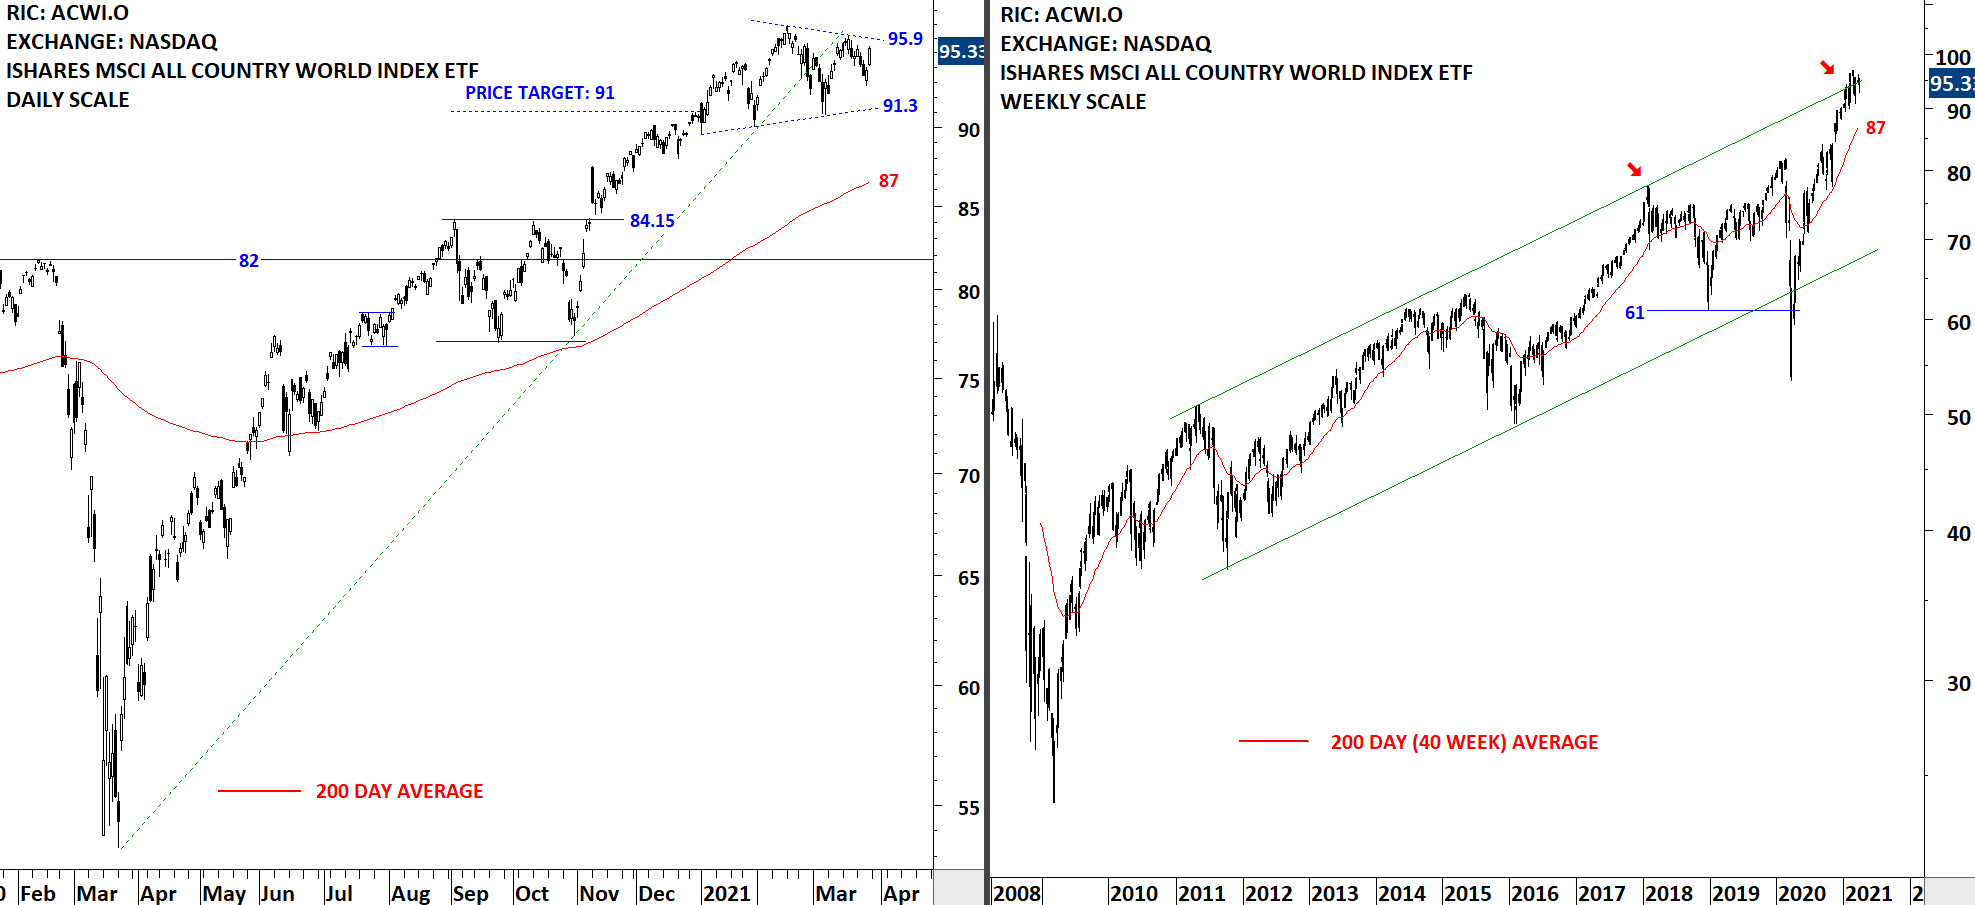
The benchmark for the Global equity markets performance, the iShares MSCI All Country World Index ETF (ACWI.O) is forming a sideways consolidation. The rebound on Friday was strong. I'm thinking that the current consolidation can morph into a symmetrical triangle. We can conclude that the uptrend is intact. It is important to note that price is testing the upper boundary of a long-term trend channel, a possible resistance area.
 Read More
GLOBAL EQUITY MARKETS – March 20, 2021
REVIEW
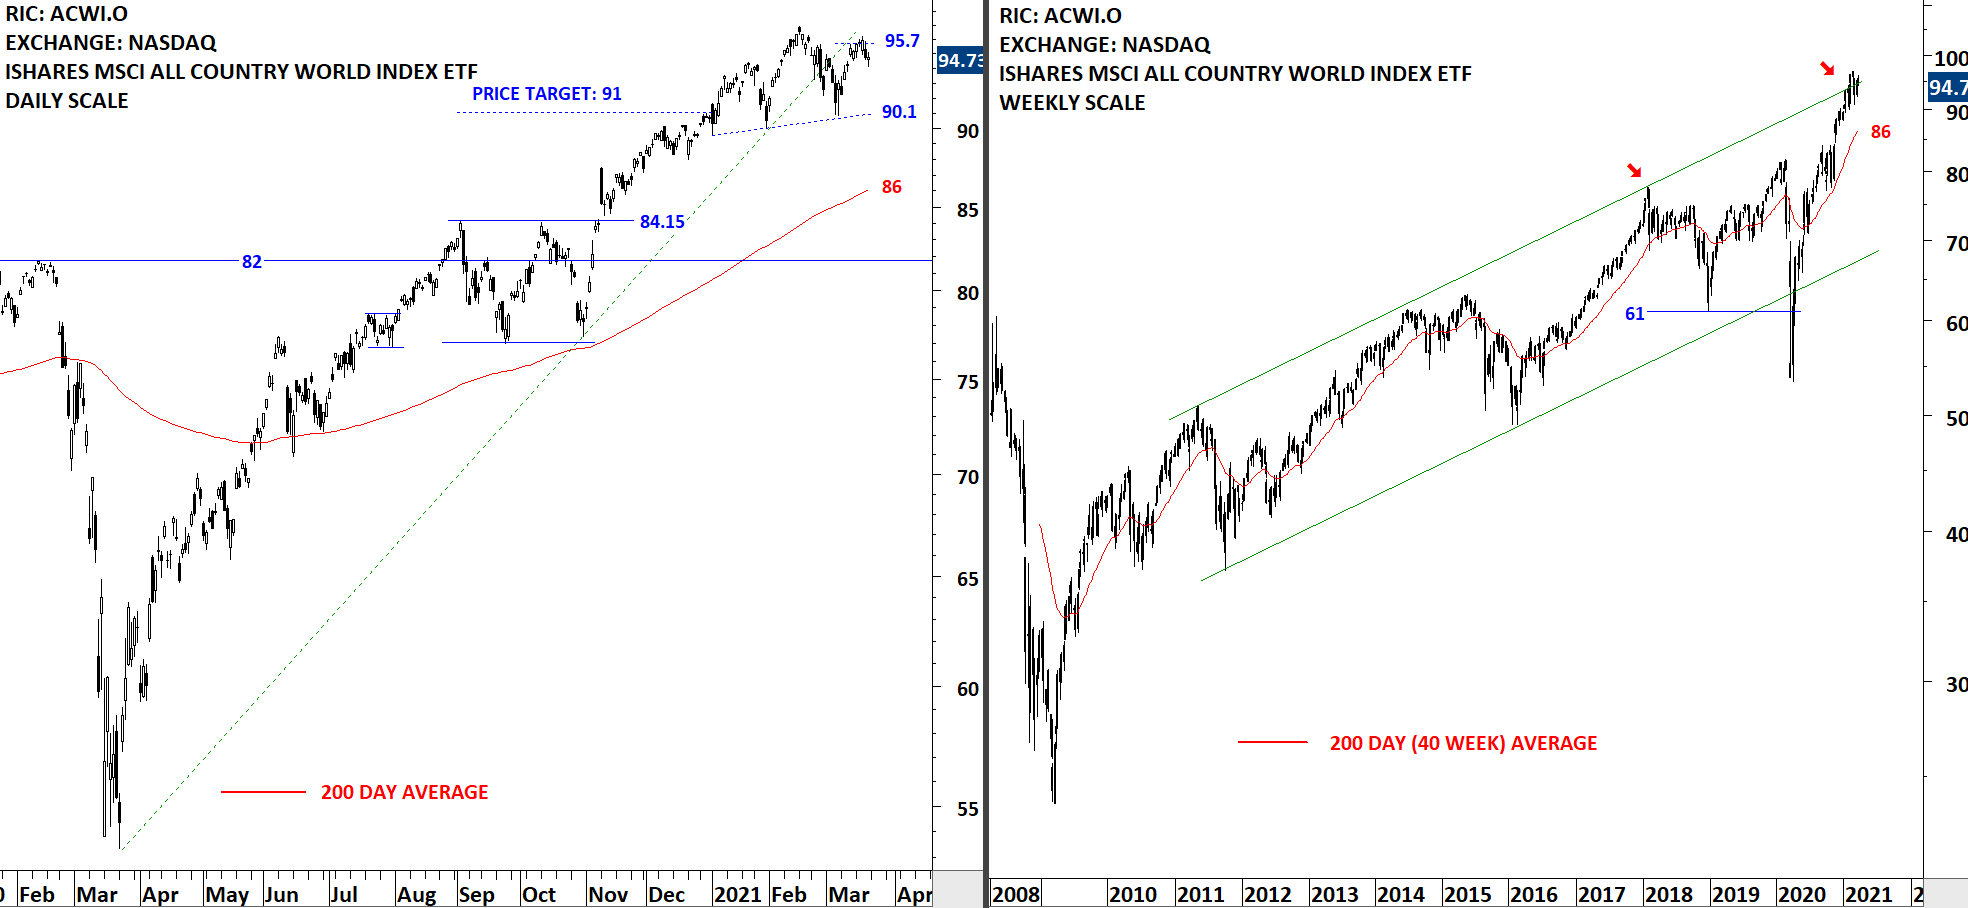
The benchmark for the Global equity markets performance, the iShares MSCI All Country World Index ETF (ACWI.O) rebounded from the minor low around 90.1 levels. There is a possibility of a H&S top forming at current levels that can be utilized in both directions. The possible right shoulder hasn't formed yet so it is early to call this a H&S top. Right now we can conclude that the uptrend is intact. If price stalls at current levels and rolls over in the following weeks, then we will consider the possibility of a H&S top. It is important to note that price is testing the upper boundary of a long-term trend channel, a possible resistance area.
 Read More
