
CRYPTOCURRENCIES – August 22, 2021
Several crypto currency pairs have completed short-term consolidations on the upside. Volatility was low. These short-term consolidations acted as bottom reversals. Previous resistance levels acted as support and they remain as critical levels to manage risk. In this update I'm adding two new breakout opportunities, though they are short-term chart patterns. On other pairs I'm reviewing existing price targets and recent price action. Read More

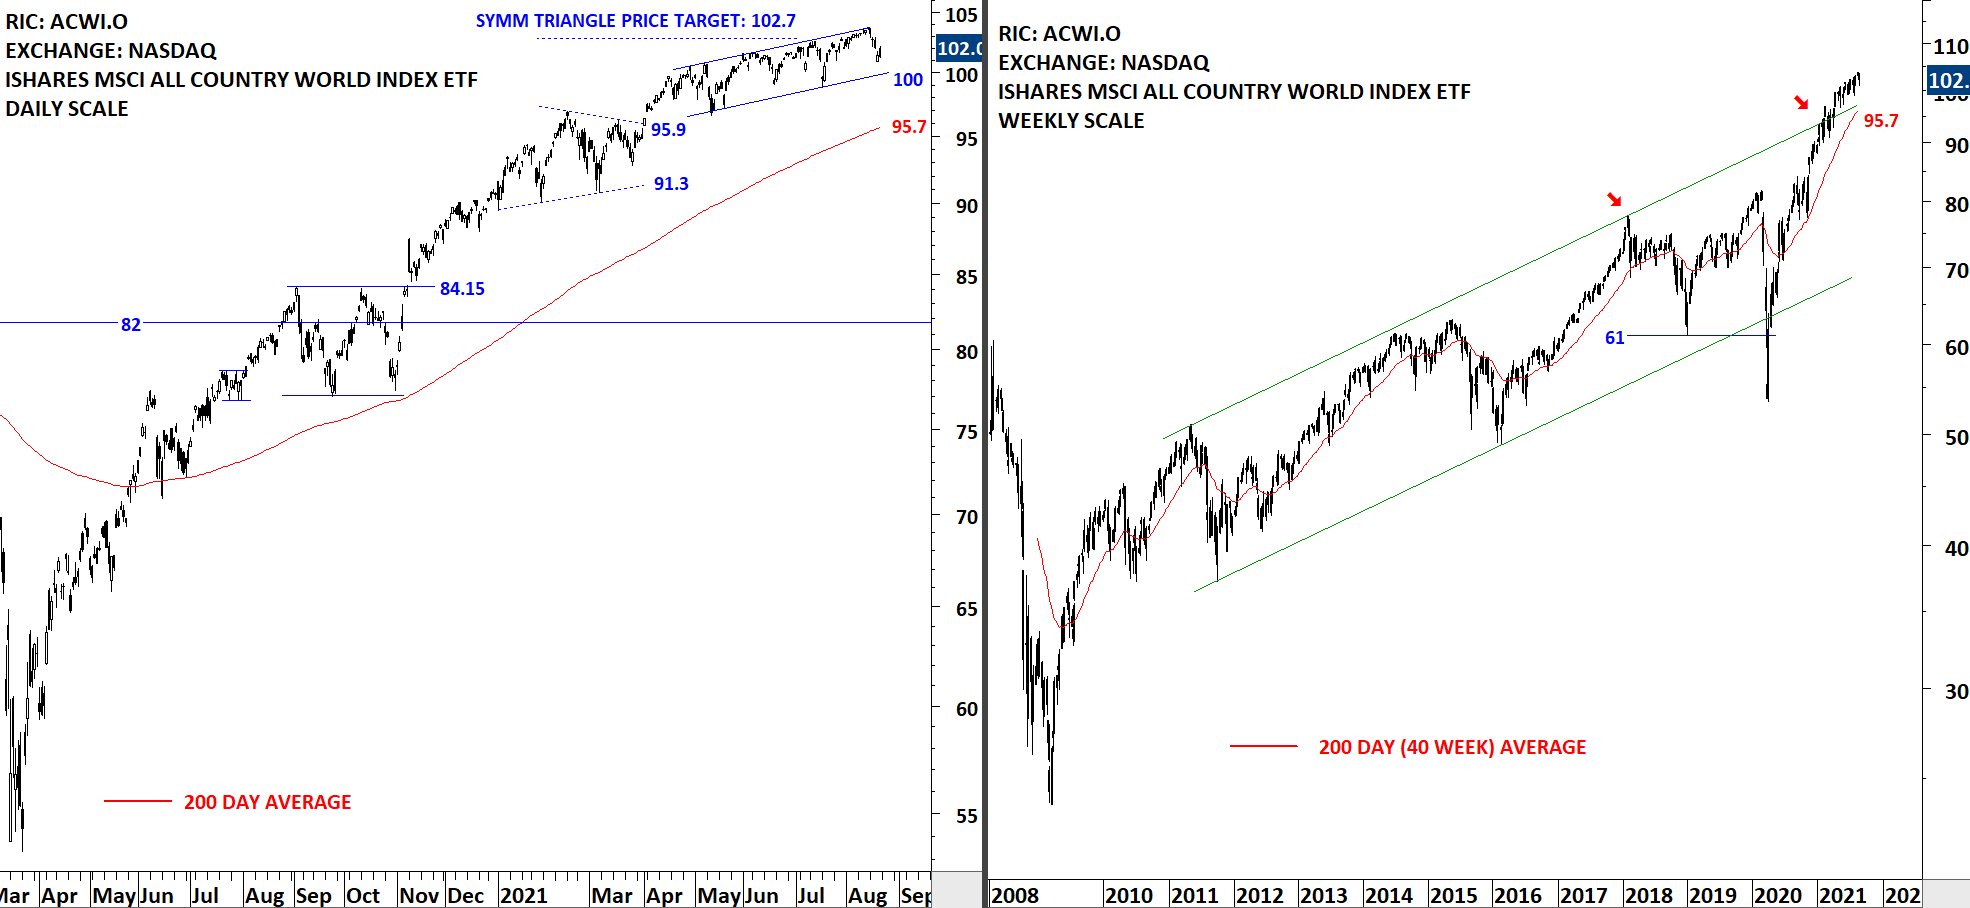
GLOBAL EQUITY MARKETS – August 21, 2021
REVIEW
The benchmark for the Global equity markets performance, the iShares MSCI All Country World Index ETF (ACWI.O) is in an upward sloping channel. The lower boundary of the channel is forming support at 100 levels. Support area remains between 95.7 and 100 levels. There is no clear top reversal chart pattern on daily and weekly scale price charts. This week the ETF reversed from the upper boundary of the trend channel on daily scale price chart.
 Read More
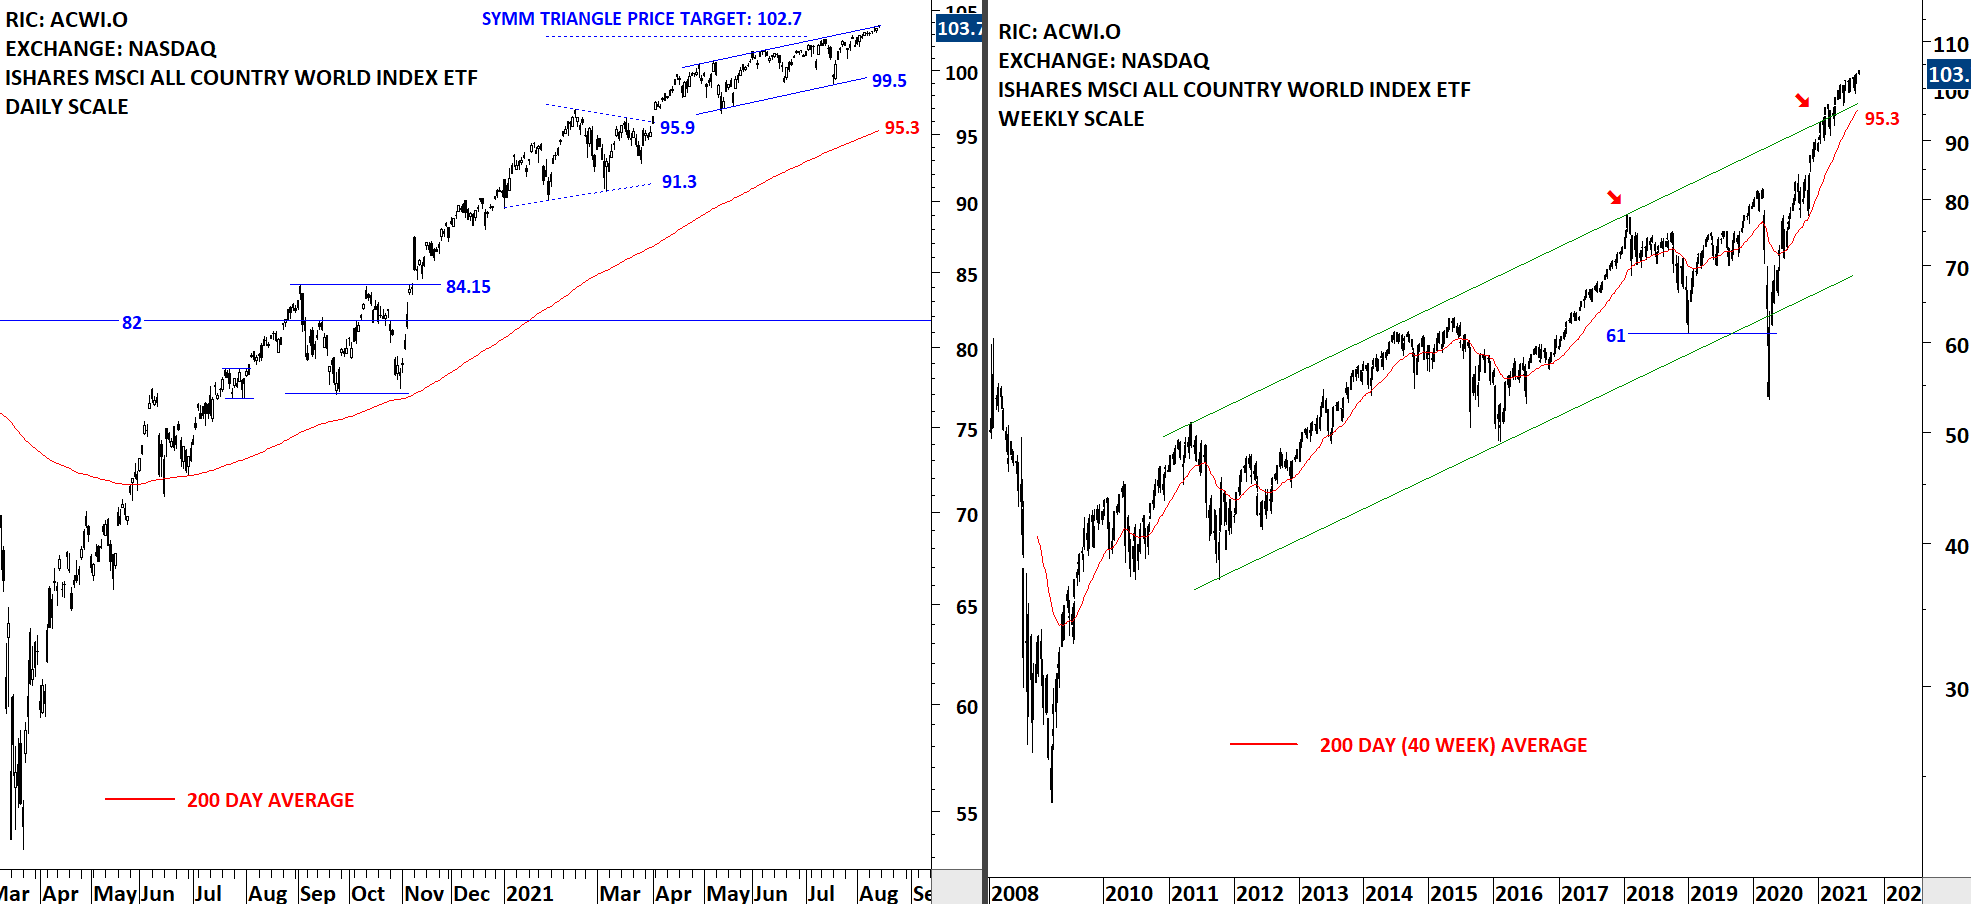
GLOBAL EQUITY MARKETS – August 14, 2021
REVIEW
The benchmark for the Global equity markets performance, the iShares MSCI All Country World Index ETF (ACWI.O) is in an upward sloping channel. The lower boundary of the channel is forming support at 99.5 levels. Support area remains between 95.3 and 99.5 levels. There is no clear top reversal chart pattern on daily and weekly scale price charts. The ETF is close to the upper boundary of the trend channel on daily scale price chart.
 Read More
