
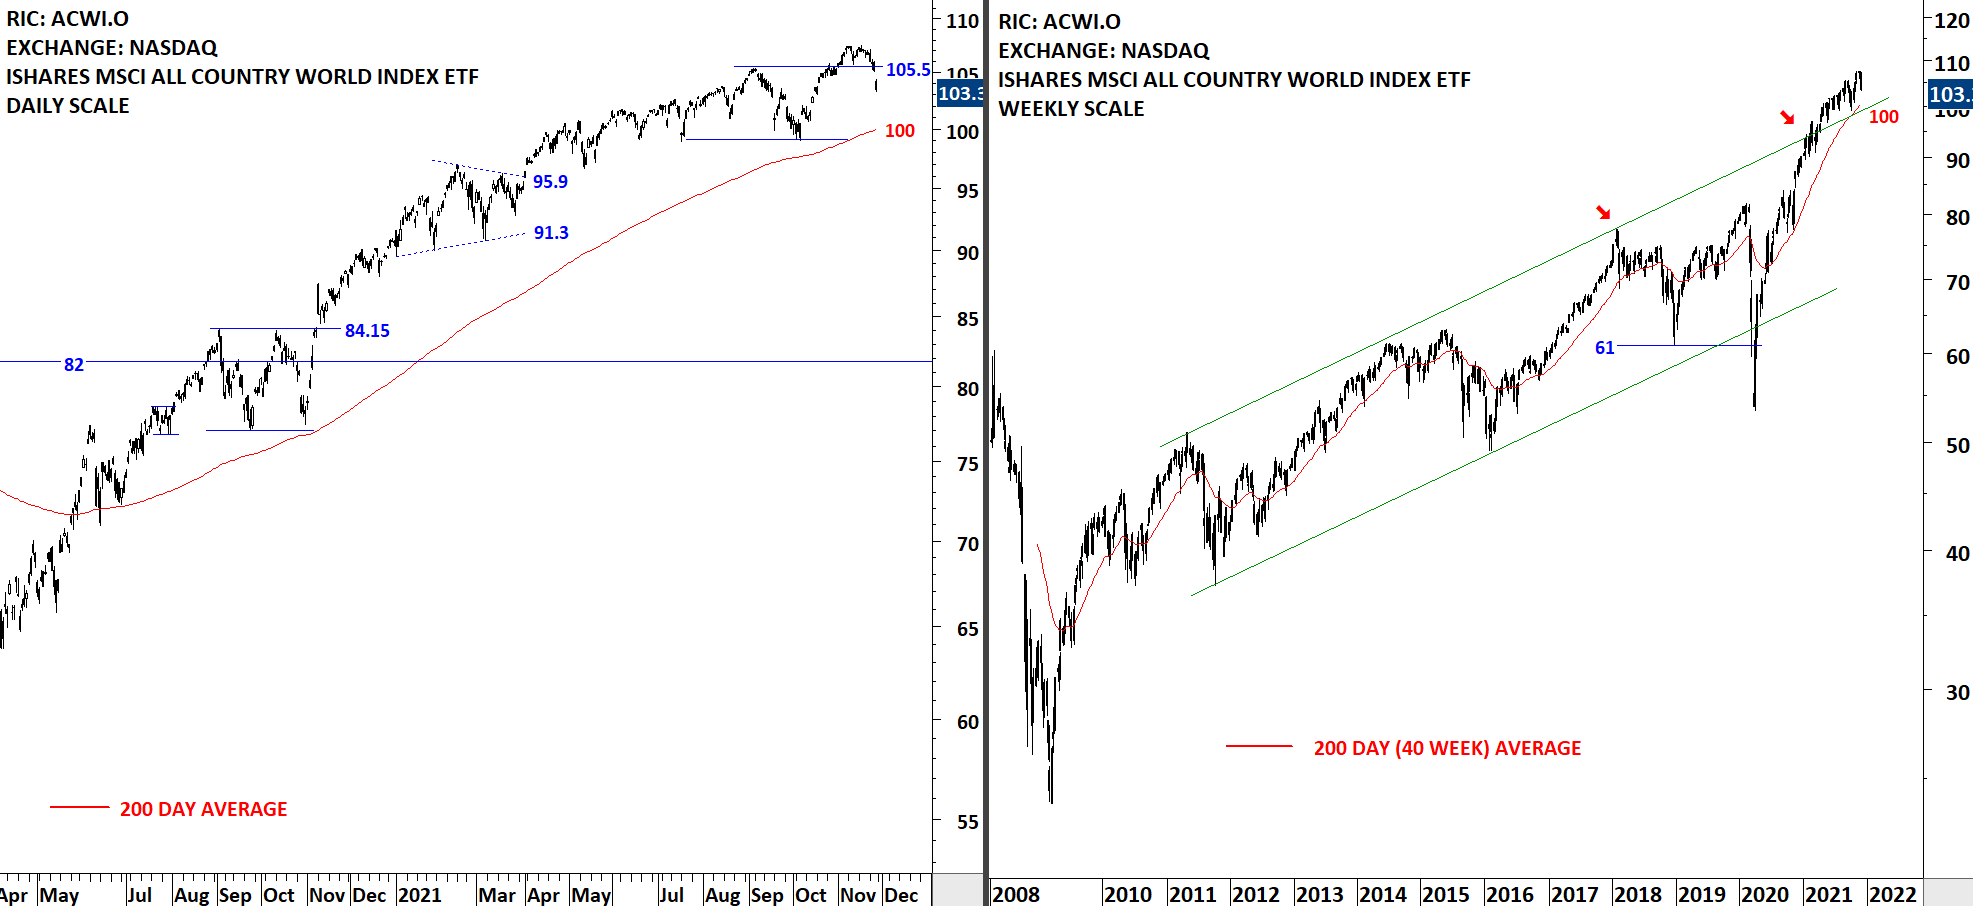
GLOBAL EQUITY MARKETS – December 4, 2021
REVIEW
The benchmark for the Global equity markets performance, the iShares MSCI All Country World Index ETF (ACWI.O) is in an uptrend. Failure to hold above 105.5 levels resulted in a failed breakout and is now pulling the price towards the long-term average at 100 levels. Another horizontal support is standing at 99 levels, making the range 99-100; the next possible strong support area. 105.5 becomes resistance again. So far, price action looks like a reversion to the mean.
 Read More
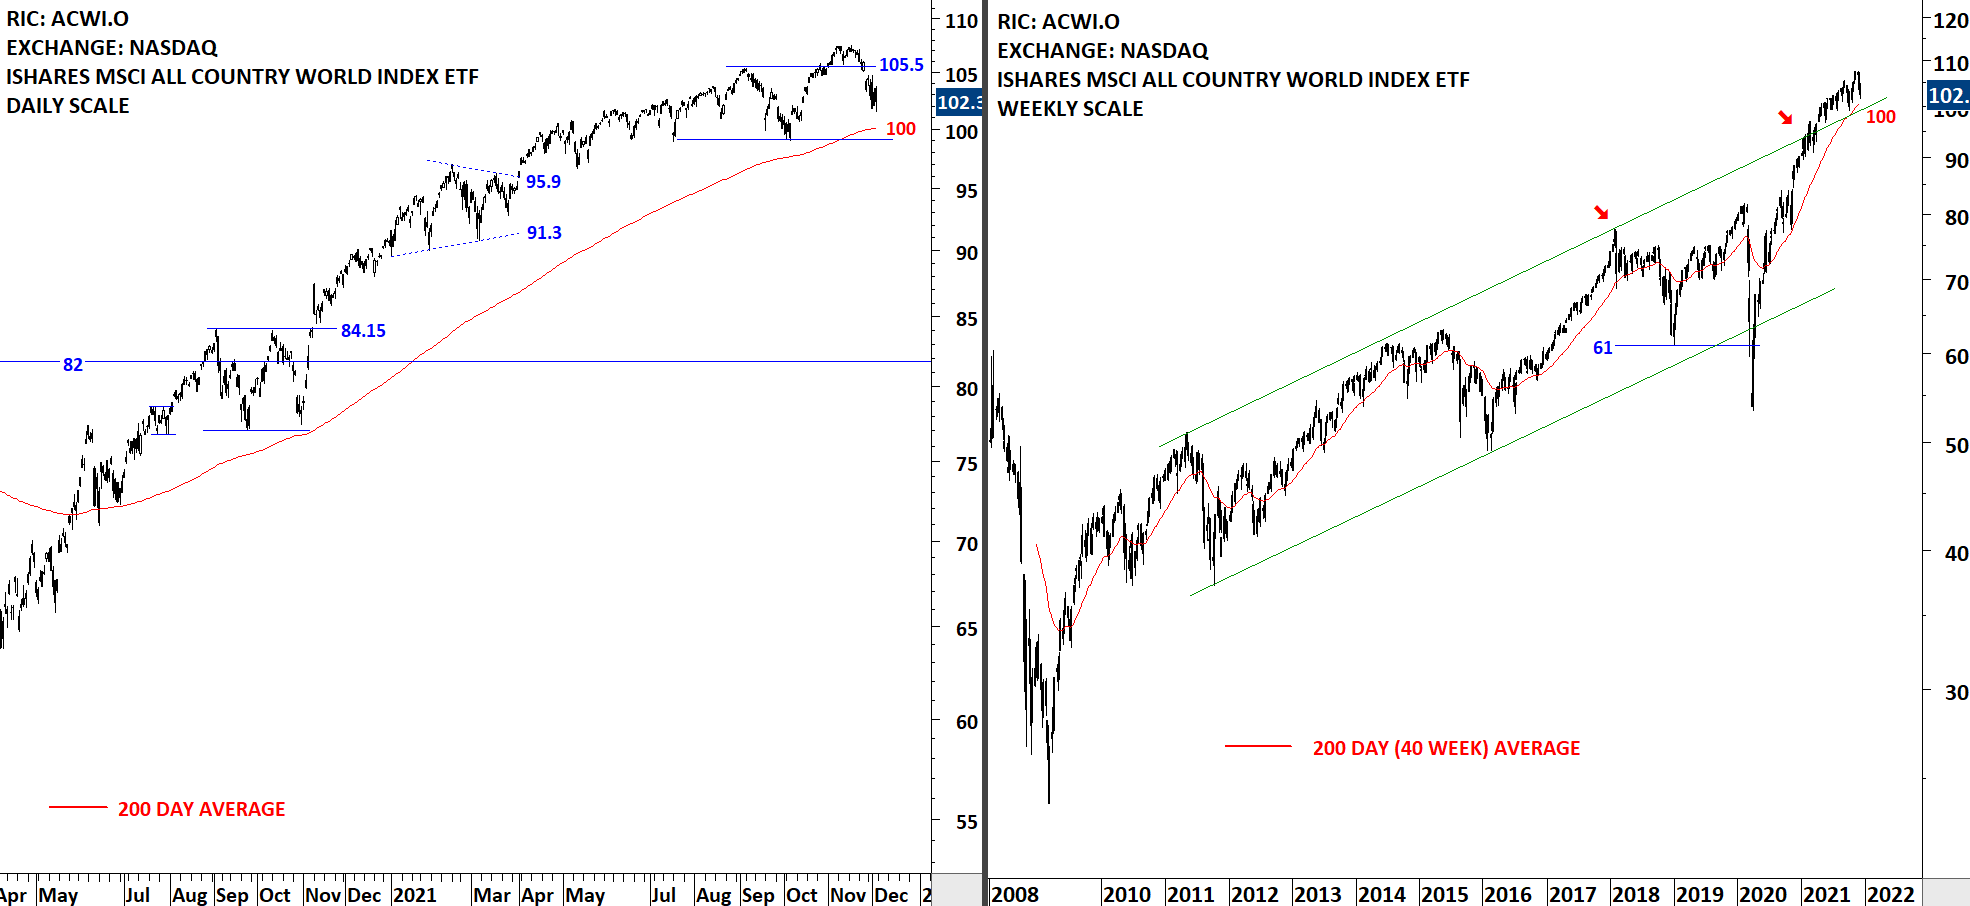
GLOBAL EQUITY MARKETS – November 27, 2021
REVIEW
The benchmark for the Global equity markets performance, the iShares MSCI All Country World Index ETF (ACWI.O) is in an uptrend. Failure to hold above 105.5 levels resulted in a failed breakout and is now pull the price towards the long-term average at 100 levels. Another horizontal support is standing at 99 levels, making the range 99-100 the next possible strong support area. 105.5 becomes resistance again.
 Read More
CRYPTOCURRENCIES – November 21, 2021
Some of the exciting chart patterns that have completed are cup & handle continuation on ETHUSD, H&S continuation on EGLDUSD and CHRUSD. I've added more exciting setups and also pairs that can outperform BTC in the following months.

