
CRYPTOCURRENCIES – May 9, 2022
The last report on cryptocurrencies read make or break week for many crypto pairs. So many chart were at inflection points. These was a bullish case to be made if right shoulders developed on chart. On the other hand if they failed, there were many chart that were waiting to break down well-defined horizontal supports. Right shoulders never developed and many horizontal setups broke down. Charts below are an update on those developing downtrends and also additional fresh setups.
GLOBAL EQUITY MARKETS – May 7, 2022
REVIEW
The benchmark for the Global equity markets performance, the iShares MSCI All Country World Index ETF (ACWI.O) remains below its 200-day average. To get bullish on Global Equities, I want to see the ETF clearing the 200-day average and settling above it. Until that happens I will view this as part of larger scale complex correction. The 200-day average is currently at 99.2 levels. Breakdown below the lows can result in a continuation of the downtrend. This week the ETF closed below the minor low at 91.7. Unless we see a sharp reversal with a long white daily candle that closes above 91.7, I will expect continuation of the downtrend. A sharp reversal can result in a rebound towards the 200-day average.
 Read More
GLOBAL EQUITY MARKETS – April 30, 2022
REVIEW
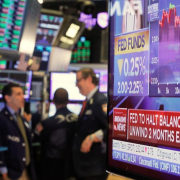
The benchmark for the Global equity markets performance, the iShares MSCI All Country World Index ETF (ACWI.O) remains below its 200-day average. To get bullish on Global Equities, I want to see the ETF clearing the 200-day average and settling above it. Until that happens I will view this as part of larger scale complex correction. The 200-day average is currently at 99.7 levels. The ETF failed to form the right shoulder of a possible reversal which led the price to test the previous lows at 91.7 levels. Breakdown below the lows can result in a continuation of the downtrend. On the weekly scale chart, price is inside the channel and also clearly below the long-term average, exposing the ETF to further downside if the minor lows are broken down.
 Read More
