
GLOBAL EQUITY MARKETS – June 11, 2022
REVIEW
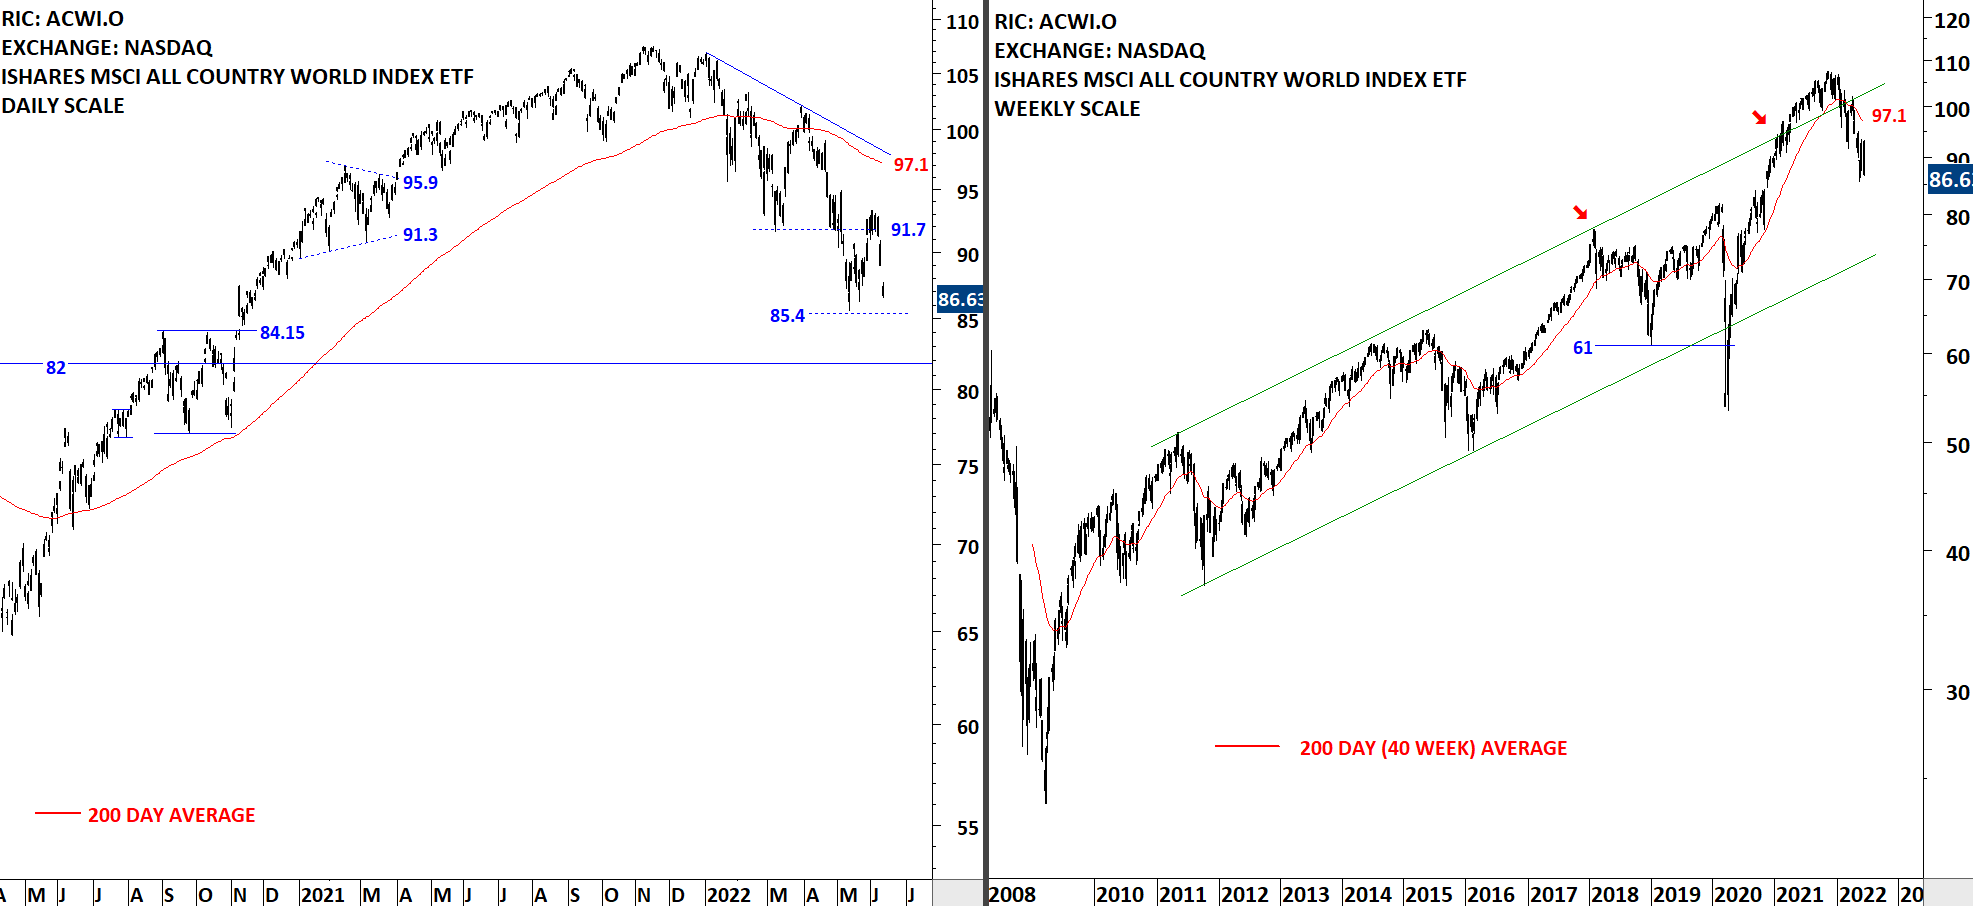
The benchmark for the Global equity markets performance, the iShares MSCI All Country World Index ETF (ACWI.O) remains below its 200-day average. The ETF failed to hold above 91.7 levels. The 200-day average is currently at 97.1 levels. Global equities are in a downtrend. There are strong resistances ahead. I continue to monitor the ETF for a reversal chart pattern. Too early to call for a bottom reversal at this point. Short-term support stands at 85.4 levels.
 Read More
CRYPTOCURRENCIES – June 5, 2022
Several altcoins have broken major support levels. In this update I feature those altcoins that still haven't met their chart pattern price targets. Also I discuss the current outlook for BTCUSD, ETHUSD and feature a breakout opportunity on TRXUSD.

GLOBAL EQUITY MARKETS – June 4, 2022
REVIEW
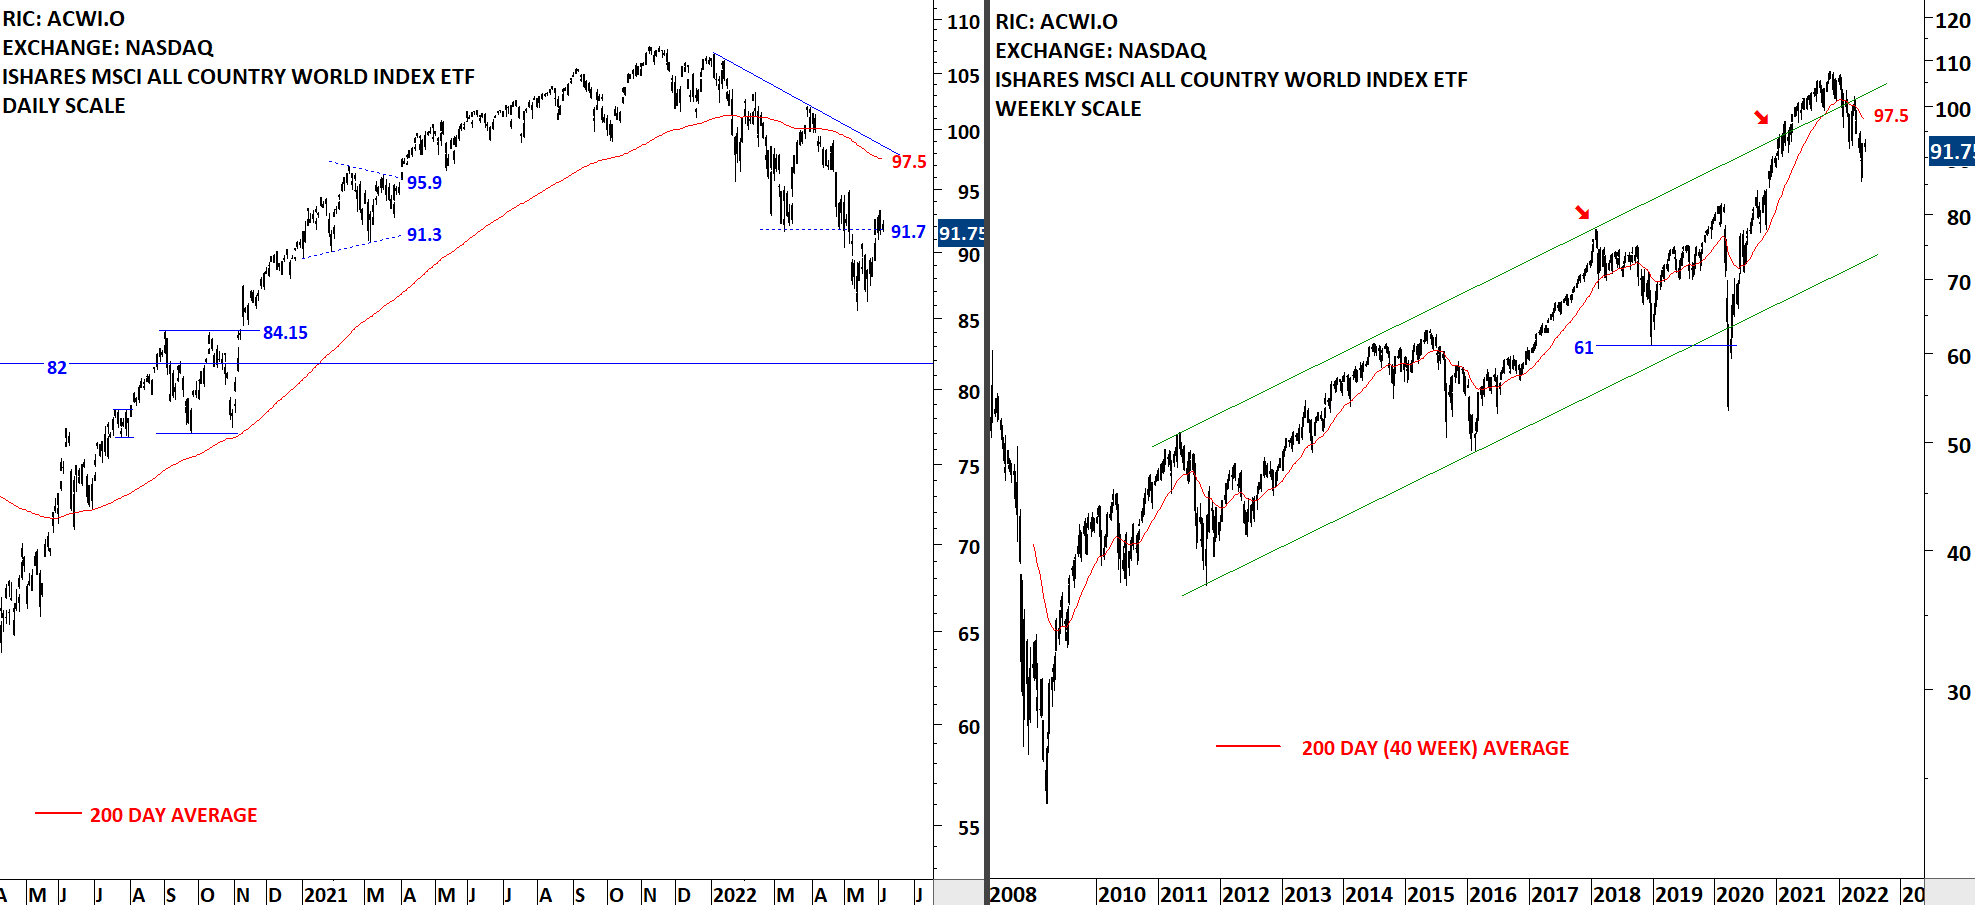
The benchmark for the Global equity markets performance, the iShares MSCI All Country World Index ETF (ACWI.O) remains below its 200-day average. The ETF is trying to hold above the minor low at 91.7 levels. The 200-day average is currently at 97.5 levels. Global equities are rebounding in a downtrend. There are strong resistances ahead. I continue to monitor the ETF for a reversal chart pattern. Upward momentum can push the ETF towards the long-term average. Too early to call for a bottom reversal at this point.
 Read More
