Tech Charts Year in Review – Year Five, May 2022 Webinar
- A study on Chart Pattern Reliability with the available sample data over the past year.
- Rectangle has been a reliable chart pattern with the H&S variations. Examples and studies on those reliable patterns.
- Detailed statistics on different types of breakouts.
- The impact of different market cycles on chart pattern opportunities.
- Live Q&A
- SLIDE 5 - I only look for patterns that begin with a pivot point countering the preceding trend. However, I see on slide 5 that you've labeled the pattern beginning with two lower pivots after an uptrend. Am I being too rigid in defining my patterns? 50:55
- SLIDE 8 - In a Type 4 breakout, if the price reverses down and the negation level is hit, but the price then rebounds/recovers and breaks out again, why is the chart pattern destroyed? 52:20
- How is the breakout confirmation price calculated? 54:21 (Technical Analysis of Stock Trends, 5th Edition, Edwards and Magee)
- In Peter Brandt's book "Diary of a Professional Commodity Trader: Lessons from 21 Weeks of Real Trading," he described the average duration of some classic patterns; my question is: do you have your own durations for classic chart patterns, or is the average duration universal to all classic chart patterns? 55:35 (Diary of a Professional Commodity Trader, Peter L. Brandt)
- Do you take profits once a chart reaches its target, or do you let the trade run until you see signs of reversals? 56:35
- How many concurrent positions do you recommend a breakout trader hold? I'm reading the Mark Minervini books from your reading list, and he recommends holding no more than 4 positions (non-margined) to 8 positions (fully margined). Do you recommend similarly? 57:40
- I just want to make sure I understand that 1. the success rate is calculated from subjectively identified inside pattern minor price points? and hence 2. the success rate showed here has nothing to do with my trading success rate because everyone's stop level can be different? so 3. if that's the case, what's the point of calculating the success rate here unless we all use that minor point inside the pattern as a stop level? 59:03
CRYPTOCURRENCIES – May 22, 2022
Since the last report where we discussed breakdowns of major support levels on several pairs, cryptocurrencies have been under pressure. Many bearish chart patterns met their price objectives and several other are midway, still short of their chart pattern price targets. This issue will discuss those that still might have more downside and new pairs that can offer trends.
GLOBAL EQUITY MARKETS – May 21, 2022
REVIEW
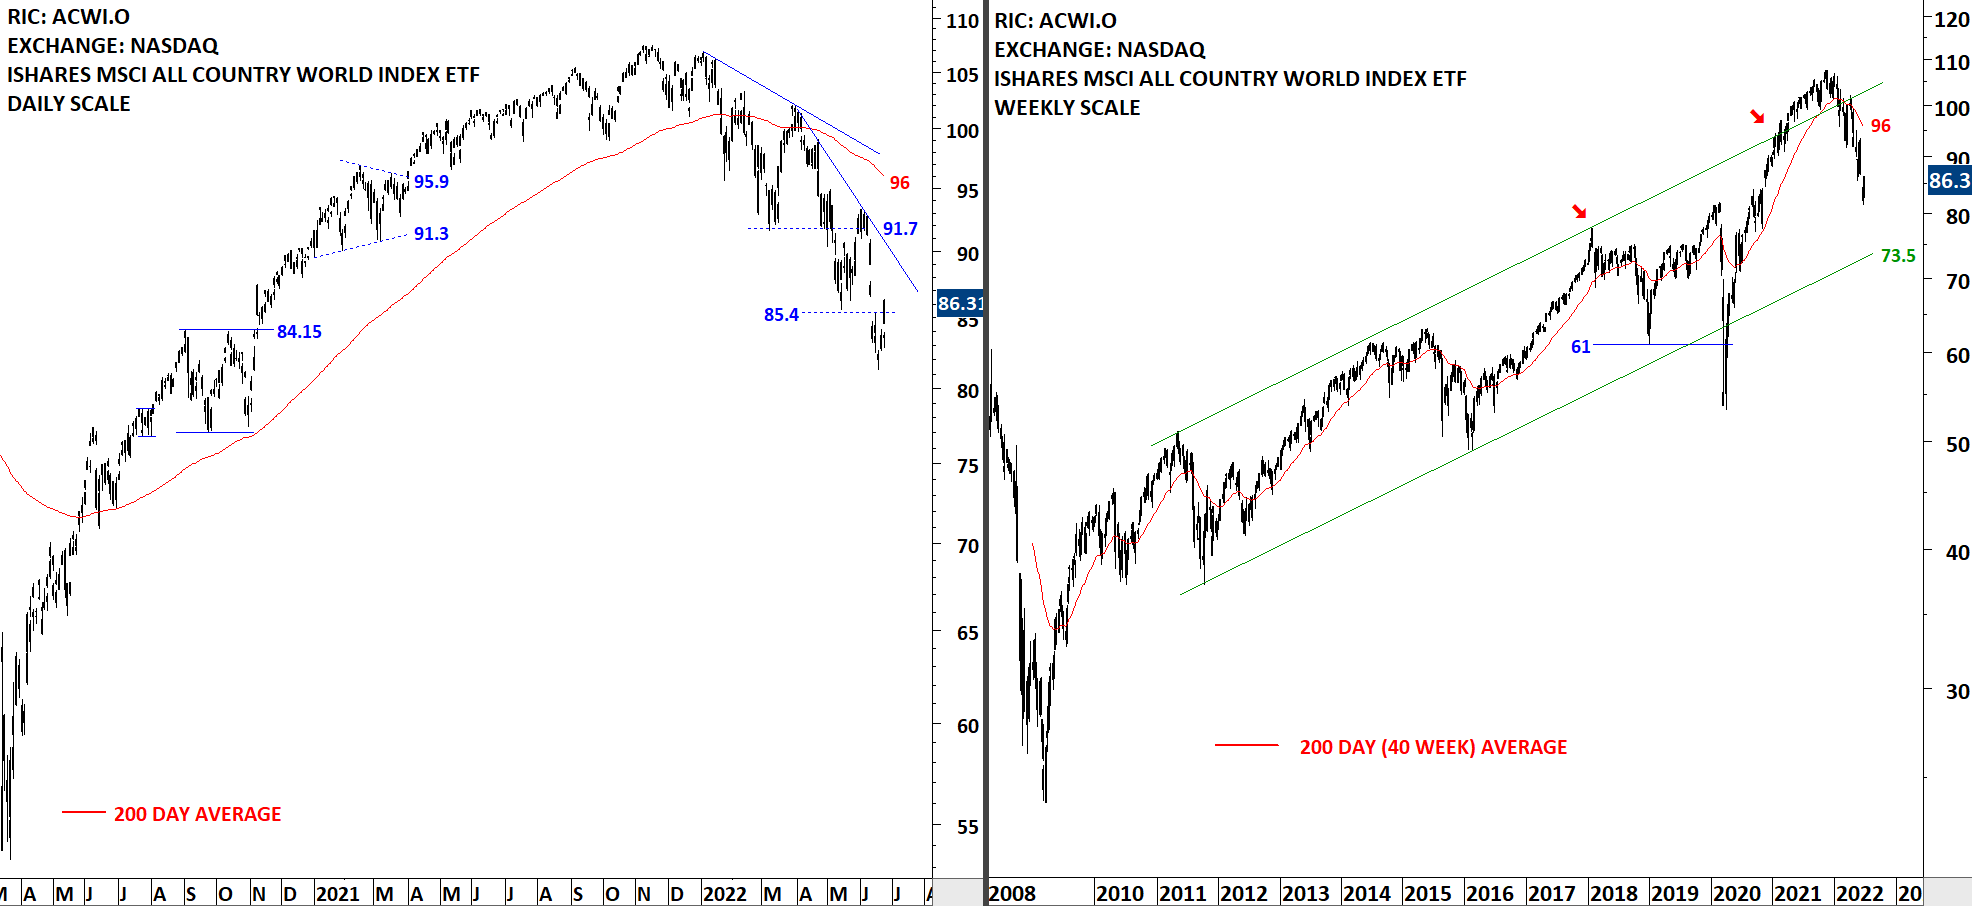
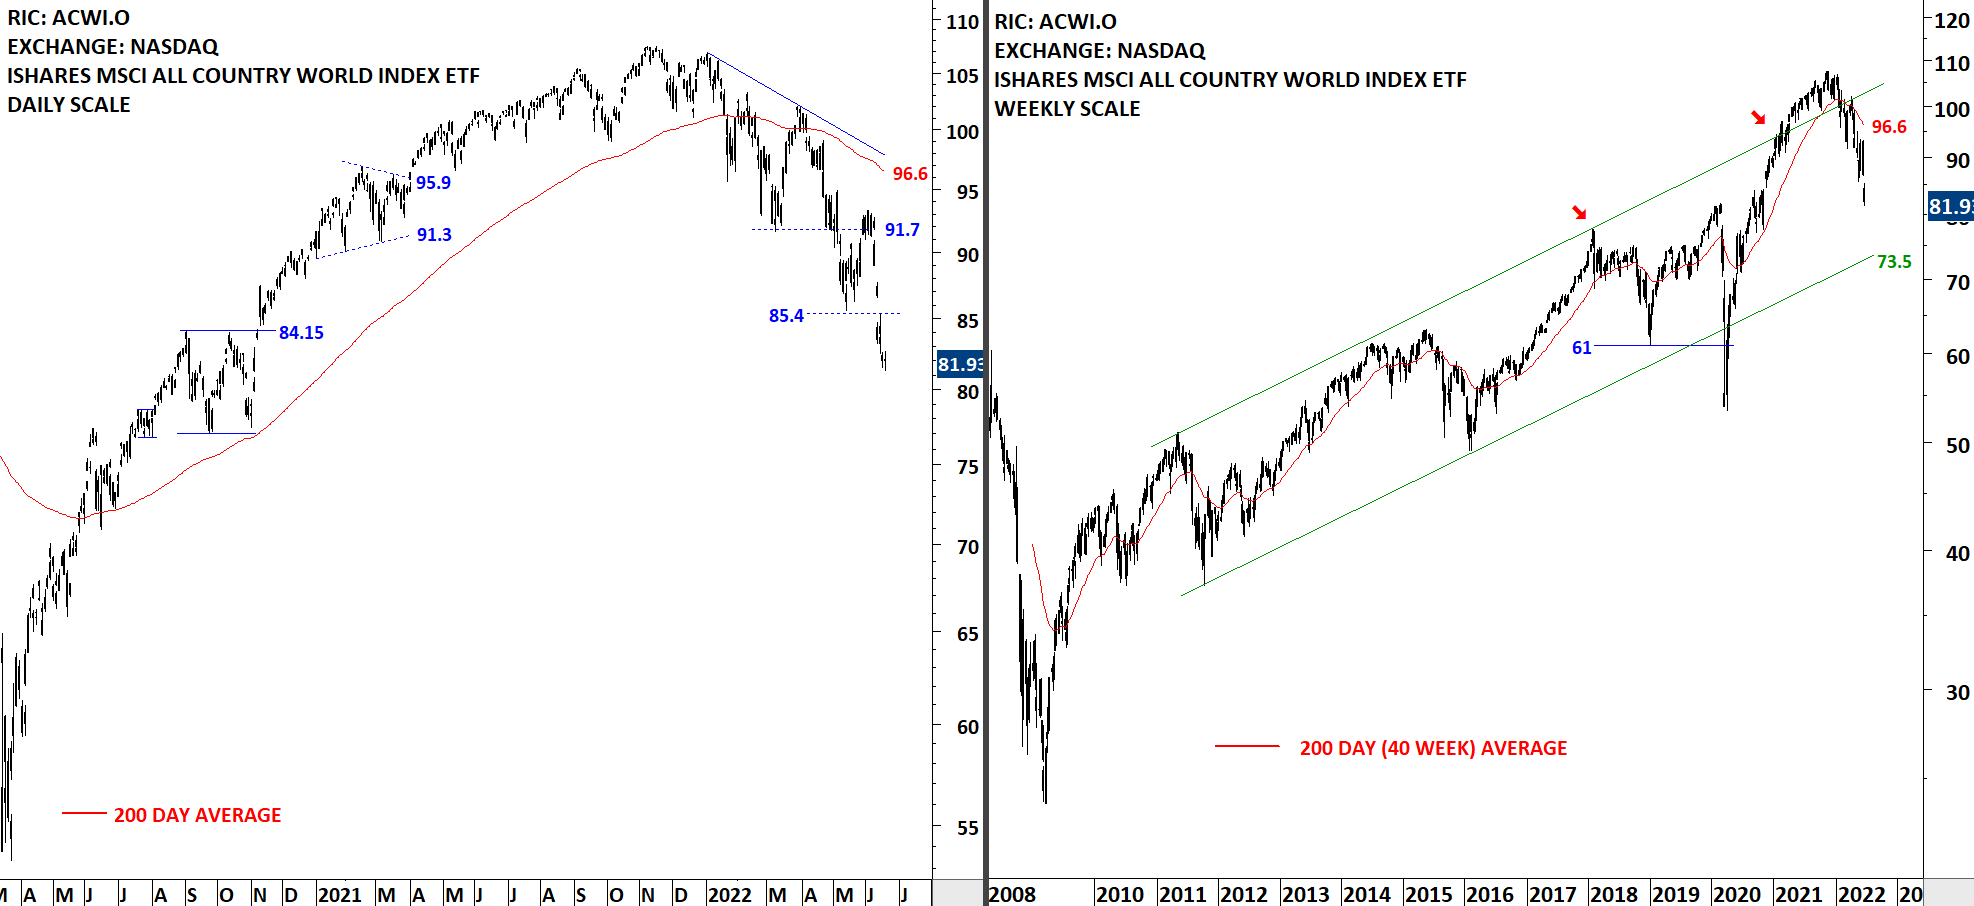
The benchmark for the Global equity markets performance, the iShares MSCI All Country World Index ETF (ACWI.O) remains below its 200-day average and the minor low at 91.7 levels. The 200-day average is currently at 98.5 levels. Breakdown below the minor low resumed the downtrend. 91.7 levels becomes the resistance. There is no clear bottom reversal chart pattern on daily and weekly scale price charts. During any rebound, 91.7 levels will act as resistance.
Read More


