Review of Chart Pattern Reliability Statistics and Opportunities in Global Markets – September 2022 Tech Charts Webinar

Review of Chart Pattern Reliability Statistics and Opportunities in Global Markets - September 2022 Tech Charts Webinar

We are continuing our Member webinar series with chart pattern reliability and how the latest market conditions have impacted success rates on different chart patterns. We plan to have an interactive session and an open discussion to answer members' questions on different markets and specific charts of interest. Webinar Outline
  • Review of chart pattern statistics and discussion on chart pattern reliability covering the third quarter of 2022
  • Review of global equity markets and latest opportunities
  • Review of cryptocurrencies and latest opportunities
  • Open discussion answering member's questions on different markets and specific charts they want to discuss
  • Education/analysis of fine points on classical charting as we go through different charts/questions

Live questions from Members

  1. India has been in a sideways movement for a year. I know you've featured a bunch of names from here. Do you see this EM as an outlier of strength amongst most EMs? 48:45
  2. I have been looking at the crypto ticker XLM/USD and XLM/BTC. It seems to be setting up a strong bottom. 49:39
  3. I see you use MetaStock. Is there any specific reason? 51:08 (LINK for MetaStock)
  4. Do you only trade the chart patterns? Do you wait for the confirmation for the price close? What do you do when closing diminishes the Risk reward relationship? 52:14
  5. Would you be able to give me a stop loss (as you would use) for your India positions? 53:20
  6. Can you go over the breakout setup in NOC? 55:06 (LINK ATR TRAILING STOP-LOSS
  7. How important is EEM nowadays? Isn't it mostly made up of China tech? Isn't it better to look at individual EM ETFs rather than EEM? 57:05
  8. In your weekly report for some index or stocks, you are using DEMA200 or DSMA200. It's a bit confusing which one to use. 57:43
  9. Yen had a crazy day today. 58:03
  10. Your thoughts on the continuing strength of the U S Dollar & its effect globally? 58:05
  11. Could you give us your view on EWZ (brazil) and also an update on NIKKEI? It looks like a bull trap confirmed above the rectangle breakout. 59:38
  12. Can you summarize any charts that look bullish? Everything seems bearish. 01:01:43
  13. Can you please chart BBBY on daily? Is that a falling wedge from 8/17 to the present day? 01:02:08
  14. How do you trade Turkey ETF? On a USD or at a TRY base? 01:03:51
  15. On the BBBY monthly, is that a double bottom? 01:05:15

Educational Videos mentioned in this webinar 

Recorded live 09.22.2022  Read More

GLOBAL EQUITY MARKETS – September 24, 2022

REVIEW


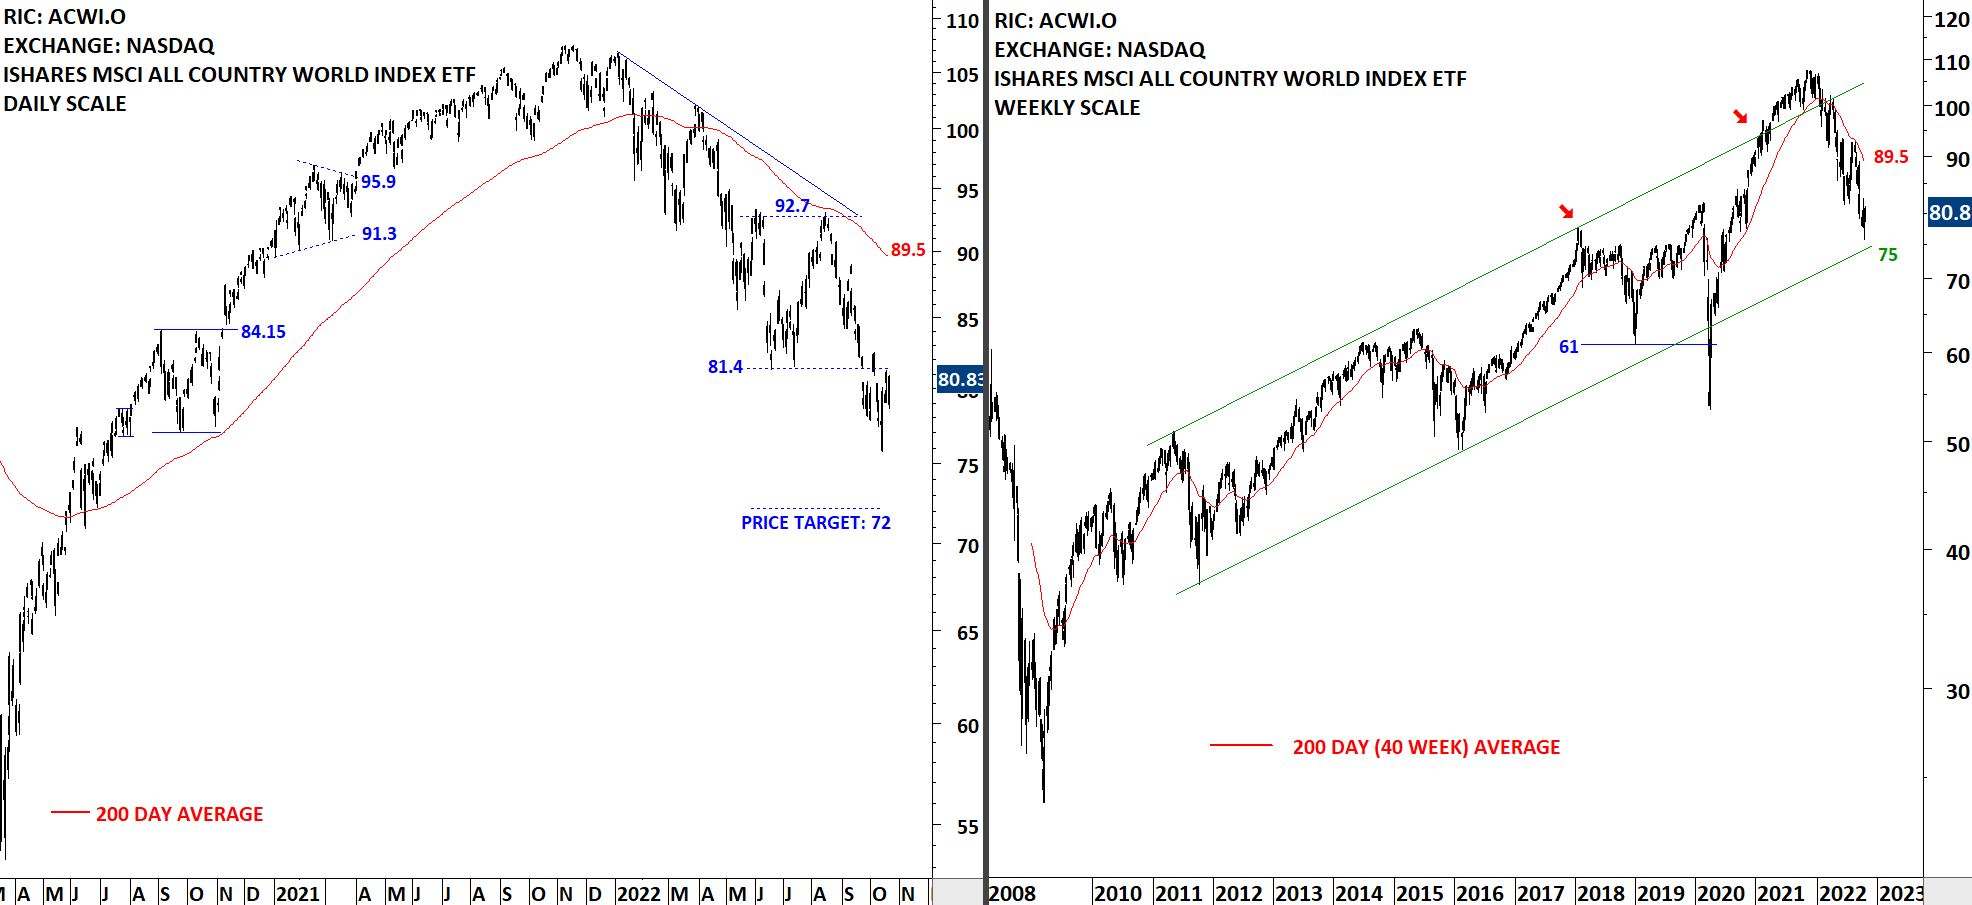
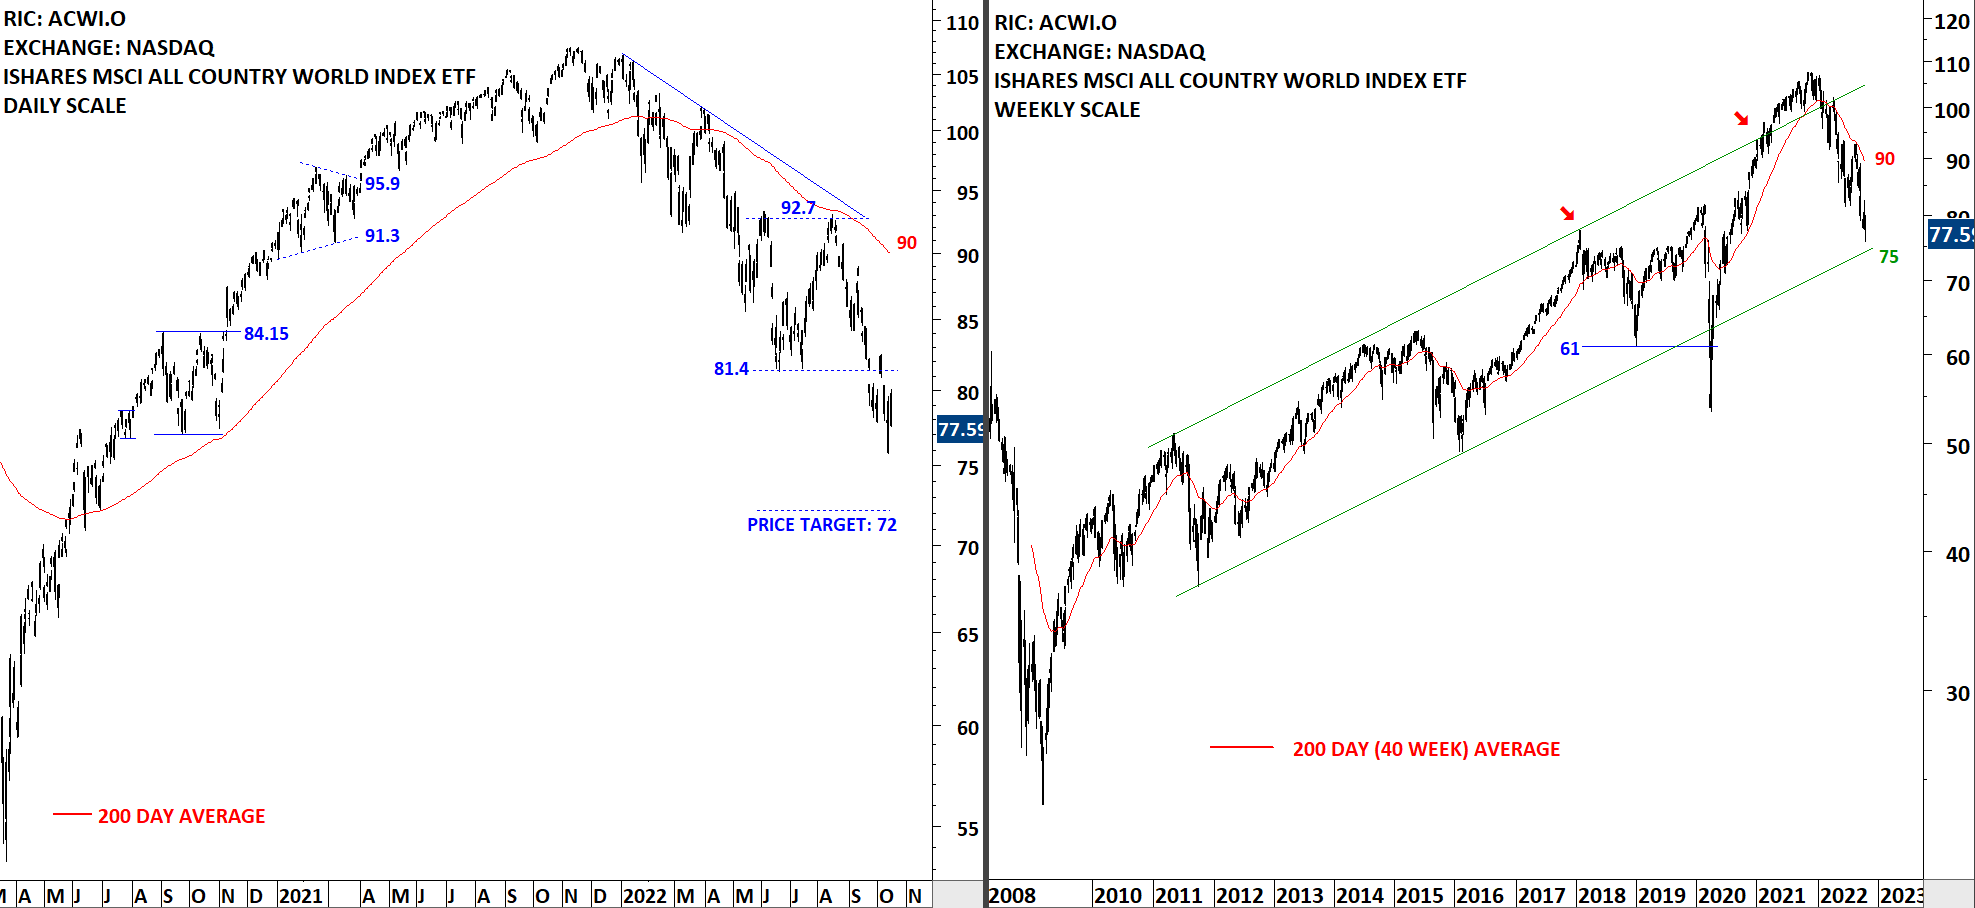
The benchmark for the Global equity markets performance, the iShares MSCI All Country World Index ETF (ACWI.O) remains below its 200-day average which is acting as resistance at 91.7 levels. This week's price action took out the low at 81.4 levels with a gap opening. If the range between 81.4 and 92.7 levels act as bearish rectangle, price target for the downtrend will stand at 72 levels. 81.4 level becomes the new resistance. Recovery above 81.4 levels can result in a failed breakdown.

Read More

Live Webinar and Q&A with Aksel – Thursday, September 22, 8:30 am mountain

Dear Tech Charts Members, We are continuing our Member webinar series with chart pattern reliability and how the latest market conditions have impacted success rates on different chart patterns. We plan to have an interactive session and an open discussion to answer members' questions on different markets and specific charts of interest. Please send your charts and questions to aksel@techcharts.net, and I will add them to the webinar discussion points. Scheduled for: Thursday, September 22, 8:30 am mountain (register below) Read More