GLOBAL EQUITY MARKETS – October 10, 2020

REVIEW


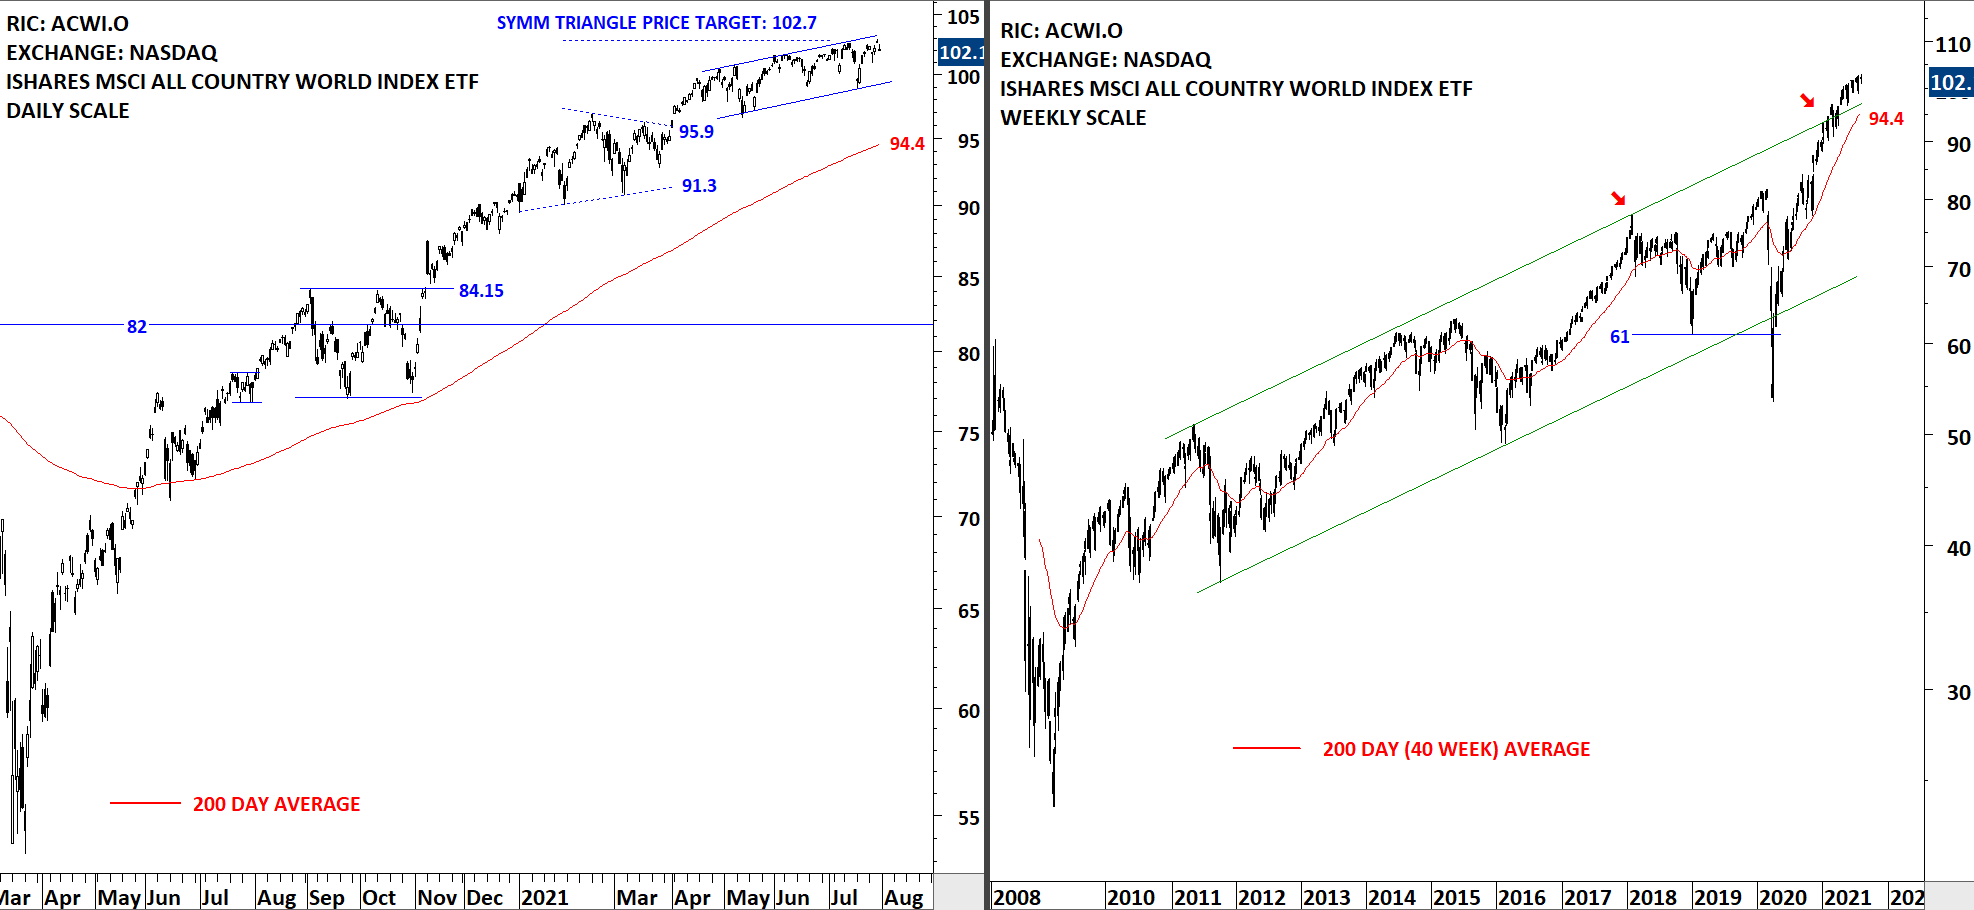
The benchmark for the Global equity markets performance, the iShares MSCI All Country World Index ETF (ACWI.O) broke out f a consolidation that could possibly be a bullish flag. The ETF closed the week above 82 levels and slightly below the all-time high at 84 levels. The uptrend on Global equities is intact and ACWI ETF continues to trend higher above its 200-day average which is acting as support at 76 levels.

Read more

INTERIM UPDATE – October 9, 2020

I start my research on Mondays and finalize by end of day Thursday. Friday is dedicated to putting all ideas to the report format. During the week I come across good setups and those are featured in the weekly report. However, there are those that pop during the week and is worth bringing to your attention before the week finalizes. Below are latest additions to Tech Charts watchlist in case they experience breakouts in the last day of the week. These charts will also be included in the weekly update.

Read more

CHINA SSE COMPOSITE INDEX

Every week Tech Charts Global Equity Markets report features some of the well-defined, mature classical chart patterns under a lengthy watchlist and the chart pattern breakout signals that took place during that week. Global Equity Markets report covers single stocks from developed, emerging and frontier markets, ETF’s and global equity indices. The report starts with a review section that highlights the important chart developments on global equity benchmarks. This blog post features from the review section the China SSE Composite Index.

CHINA SSE COMPOSITE INDEX (.SSEC)

The chart below shows the China SSE Composite Index (larger universe for China equities). Following the strong rally during June-July period the index entered into a sideways consolidation. The Chinese benchmark is now at an important inflection point. If the support at 3,190 levels holds, given the price testing the uptrend line and holding above the 200-day average, we can expect a rebound and strong quarter for Chinese equities. Last 3 month’s price action can form a well-defined rectangle chart pattern. After a long holiday, China equities start trading on the 9th of October.


Tech Charts Membership

By becoming a Premium Member, you’ll be able to improve your knowledge of the principles of classical charting.

With this knowledge, you can merge them with your investing system. In fact, some investors use my analyses to modify their existing style to invest more efficiently and successfully.

Get Access Now

As a Premium Member of Aksel Kibar’s Tech Charts,

You will receive:

  • Global Equities Report. Delivered weekly.
  • Classical charting principles. Learn patterns and setups.
  • Actionable information. Worldwide indices and stocks of interest.
  • Risk management advice. The important trading points of each chart.
  • Information on breakout opportunities. Identify the ones you want to take action on.
  • Video tutorials. How patterns form and why they succeed or fail.
  • Watch list alerts. As they become available so you can act quickly.
  • Breakout alerts. Usually once a week.
  • Access to everything (now and as it becomes available)
    o Reports
    o Videos and video series
  • Multi-part webinar course. You learn the 8 most common charting principles.
  • Webinars. Actionable and timely advice on breaking out chart patterns.

For your convenience your membership auto renews each year.

Get Access Now

H&S Bottom Reversal with a Hard Re-Test

You don’t have access to view this content

GLOBAL EQUITY MARKETS – October 3, 2020

REVIEW


The benchmark for the Global equity markets performance, the iShares MSCI All Country World Index ETF (ACWI.O) continues to consolidate above its 200-day average. I analyze the latest correction as a reversion to the mean. As we are still above the 200-day average for the ACWI ETF, It is difficult for me to put my bear market cap on. I’ve discussed the possibility of a short-term H&S top on the ETF, but so far we haven’t seen a follow through which puts the bearish interpretation in question. There is no clear chart pattern development on the daily scale price chart.

Read more

INTERIM UPDATE – October 1, 2020

I start my research on Mondays and finalize by end of day Thursday. Friday is dedicated to putting all ideas to the report format. During the week I come across good setups and those are featured in the weekly report. However, there are those that pop during the week and is worth bringing to your attention before the week finalizes. Below are latest additions to Tech Charts watchlist in case they experience breakouts in the last two days of the week. These charts will also be included in the weekly update.

Read more

RECTANGLE – GUBRE FABRIKALARI TAS

Every week Tech Charts Global Equity Markets report features some of the well-defined, mature classical chart patterns under a lengthy watchlist and the chart pattern breakout signals that took place during that week. Global Equity Markets report covers single stocks from developed, emerging and frontier markets, ETF’s and global equity indices. The report starts with a review section that highlights the important chart developments on global equity benchmarks. This blog post features from the watchlist section Gubre Fabrikalari TAS (Gubretas) listed on the Istanbul Stock Exchange.

GUBRE FABRIKALARI TAS (GUBRF.IS)

Gubre Fabrikalari TAS (Gubretas) is a Turkey-based company engaged in the production and marketing of chemical fertilizers, including solid fertilizers, liquid fertilizers, powder-based fertilizers and organic fertilizers. The stock is listed on the Istanbul Stock Exchange. Price chart formed a 3 month-long rectangle with the horizontal boundary acting as strong resistance at 32.15 levels. The horizontal boundary was tested several times over the course of the chart pattern. A daily close above 33.15 levels will confirm the breakout from the 3 month long rectangle with the possible chart pattern price target of 38.50 levels. Breakout will push the stock to all-time highs.


Tech Charts Membership

By becoming a Premium Member, you’ll be able to improve your knowledge of the principles of classical charting.

With this knowledge, you can merge them with your investing system. In fact, some investors use my analyses to modify their existing style to invest more efficiently and successfully.

Get Access Now

As a Premium Member of Aksel Kibar’s Tech Charts,

You will receive:

  • Global Equities Report. Delivered weekly.
  • Classical charting principles. Learn patterns and setups.
  • Actionable information. Worldwide indices and stocks of interest.
  • Risk management advice. The important trading points of each chart.
  • Information on breakout opportunities. Identify the ones you want to take action on.
  • Video tutorials. How patterns form and why they succeed or fail.
  • Watch list alerts. As they become available so you can act quickly.
  • Breakout alerts. Usually once a week.
  • Access to everything (now and as it becomes available)
    o Reports
    o Videos and video series
  • Multi-part webinar course. You learn the 8 most common charting principles.
  • Webinars. Actionable and timely advice on breaking out chart patterns.

For your convenience your membership auto renews each year.

Get Access Now

TRADERS SUMMIT – SUMMARY

Dear Tech Charts members,

On the 27th of September, I gave a presentation at the Online Traders Summit. You might have missed the opportunity to attend. If you have registered for the event a recording will probably be sent out.

I wanted to summarize the main points I’ve discussed at the online event also you can find attached the charts I’ve shared with the attendees. You might find these long-term charts interesting. Though, the first part of the presentation where I discuss the general concepts for classical charting might be familiar if you have been a long-time Tech Charts member.

Read more

GLOBAL EQUITY MARKETS – September 26, 2020

Announcement:

On the 27th of September I will be making a presentation at the Online Traders Summit. I will discuss long-term aspects of classical charting principles with examples from Global Equity & FX markets. If you want to register (FREE) for the 2 day event, you can find the link here. I hope you can make it. I’m excited to hear and learn from several other great presenters.

REVIEW


The benchmark for the Global equity markets performance, the iShares MSCI All Country World Index ETF (ACWI.O) broke down the neckline of a possible short-term H&S top. The 200-day average is acting as support at 75.5 levels. Please note that this is a short-term chart pattern and the shorter -term the chart pattern the more prone it is to failure or morphing (eventually becoming part of a larger scale chart pattern). Friday’s price action was strong and reversed back to close slightly below the neckline. The following week will offer more insight of the H&S is successful and price will test the 200-day average. Several equity benchmarks have already reached their 200-day averages during the latest correction. As we are still above the 200-day average for the ACWI ETF, It is difficult for me to put my bear market cap on. I continue to view any correction or weakness in the market as reversion to the mean.

Read more

GLOBAL EQUITY MARKETS – September 19, 2020

Announcement:

On the 27th of September I will be making a presentation at the Online Traders Summit. I will discuss long-term aspects of classical charting principles with examples from Global Equity & FX markets. If you want to register (FREE) for the 2 day event, you can find the link here. I hope you can make it. I’m excited to hear and learn from several other great presenters.

REVIEW


The benchmark for the Global equity markets performance, the iShares MSCI All Country World Index ETF (ACWI.O) experienced its first setback after a lengthy uptrend. I’ve adjusted the boundary of the trend channel. The daily price chart might be forming a short-term H&S top with this week’s price action completing the right shoulder. The neckline is at 79.25 levels. Breakdown below 79.25 levels can extend the correction towards the 200-day average at 75.3 levels. A breach above the high (82) of the right shoulder will result in a H&S failure and will suggest higher levels. Please note that this is a short-term chart pattern and the shorter -term the chart pattern the more prone it is to failure or morphing (eventually becoming part of a larger scale chart pattern). I’m reading several comments on social media, regarding the possibility of another sharp sell-off similar to Feb-March correction. While anything is possible in the markets, I want to draw your attention to the concept of recency bias.

Read more