
CRYPTOCURRENCIES – August 21, 2022
Mixed performance for cryptocurrencies. Sharp reversal on BTCUSD reminds us the bearish outlook once again. Some of the altcoins managed to offer short-term uptrends while others continued to remain rangebound.
Mixed performance for cryptocurrencies. Sharp reversal on BTCUSD reminds us the bearish outlook once again. Some of the altcoins managed to offer short-term uptrends while others continued to remain rangebound.

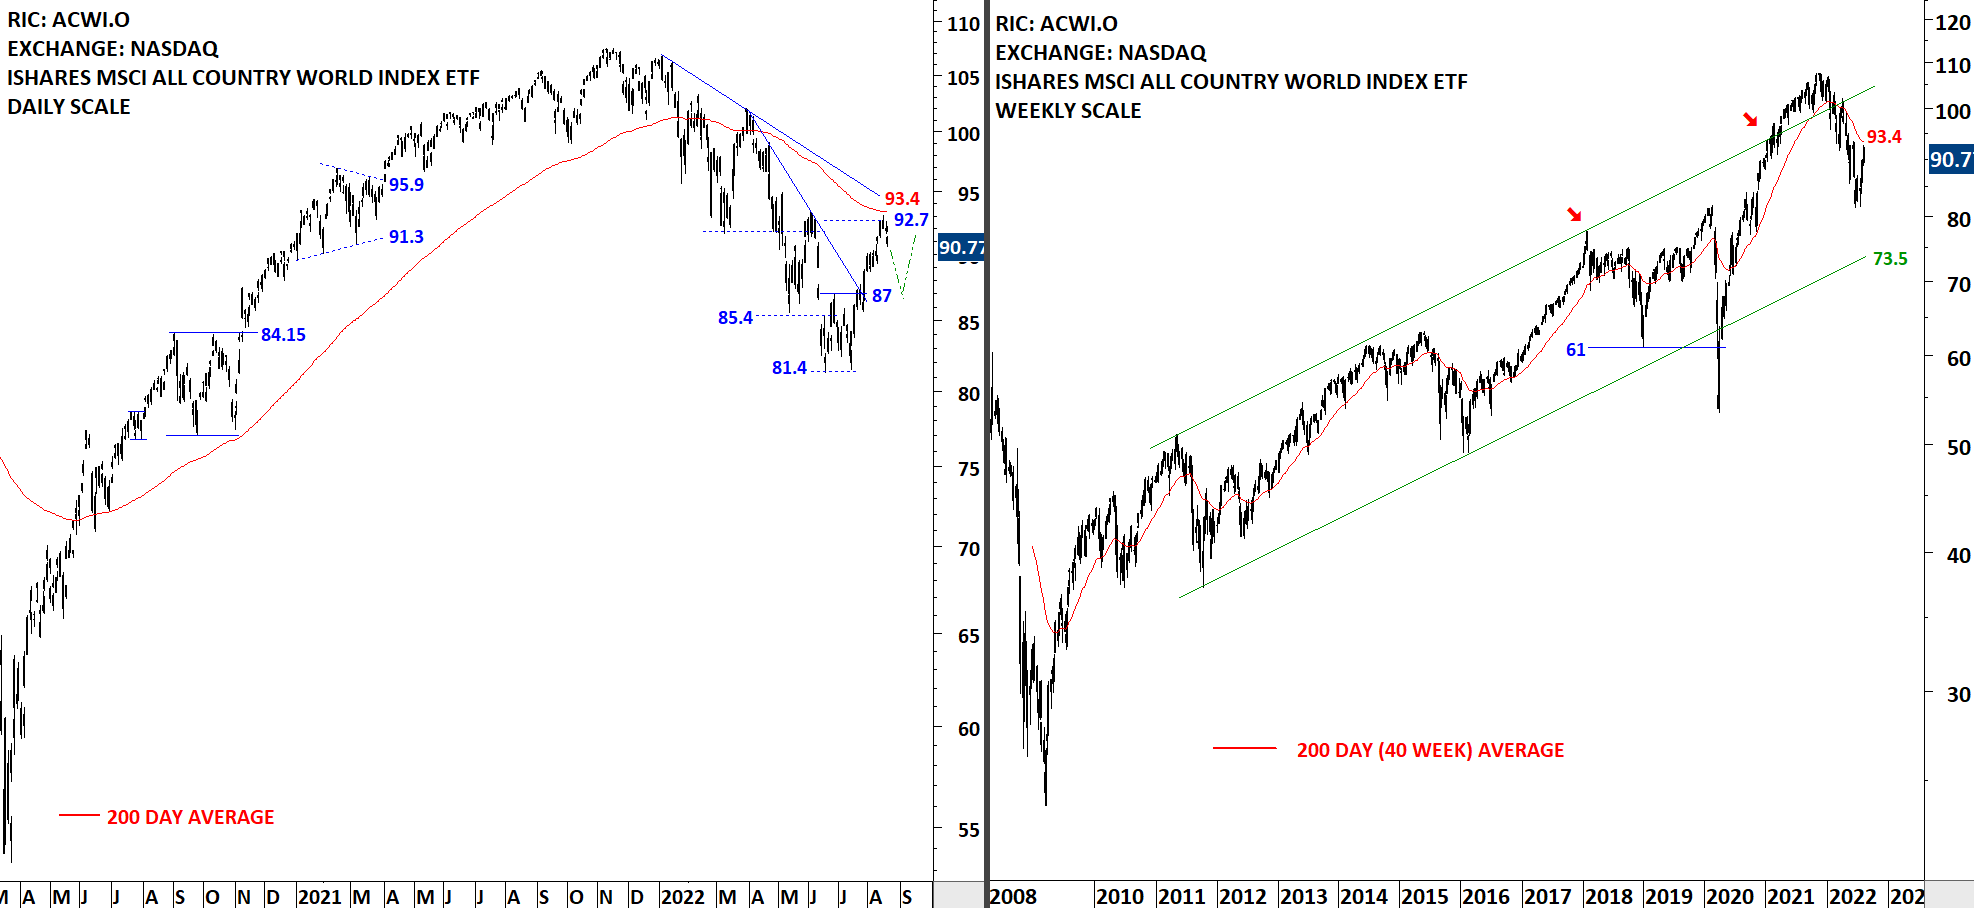
The benchmark for the Global equity markets performance, the iShares MSCI All Country World Index ETF (ACWI.O) remains below its 200-day average. Breakout above 87 levels completed a short-term double bottom with the price target of 92.7 levels. The 200-day average is acting as resistance at 93.4 levels. Price target for the short-term double bottom was met. A text-book H&S bottom reversal can develop if the index pulls back towards 87 levels to form the possible right shoulder. For now I monitor the price action around the 200-day average.
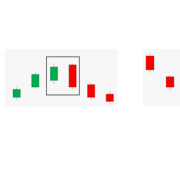
Are you familiar with those candlestick patterns? Candlestick patterns at well-defined support & resistance areas can offer great insight and can become part of a successful trading strategy. Formation of those reversal candlesticks can offer good levels to measure risk/reward and act on a possible swing trade opportunity.
I continue to add new features to Tech Charts membership service. This latest educational video has interactive components where you can pause, answer questions and make sure that the learning experience becomes memorable and fun.
I hope you enjoy it.

By becoming a Premium Member, you’ll be able to improve your knowledge of the principles of classical charting.
With this knowledge, you can merge them with your investing system. In fact, some investors use my analyses to modify their existing style to invest more efficiently and successfully.
You will receive:
For your convenience your membership auto renews each year.

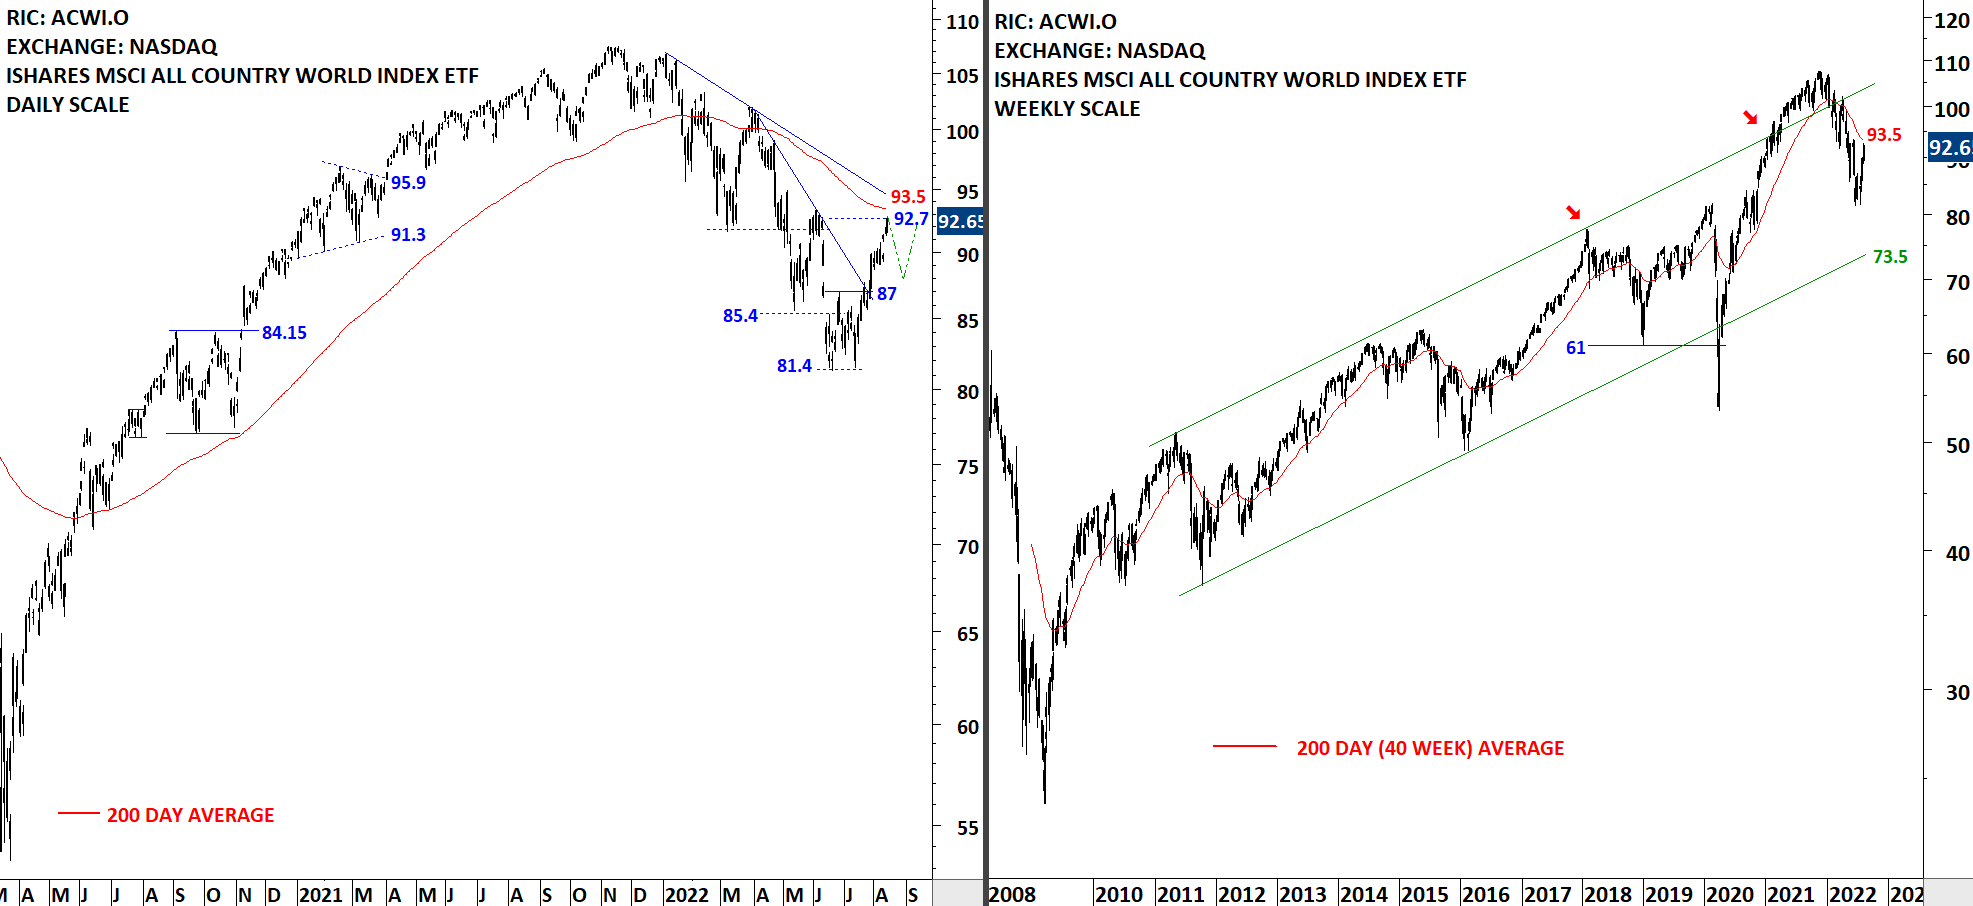
The benchmark for the Global equity markets performance, the iShares MSCI All Country World Index ETF (ACWI.O) remains below its 200-day average. Breakout above 87 levels completed a short-term double bottom with the price target of 92.7 levels. The 200-day average is acting as resistance at 93.5 levels. Price target for the short-term double bottom was met during the week. A text-book H&S bottom reversal can develop if the index pauses around the 200-day average and pulls back to form the possible right shoulder. For now I monitor the price action around the 200-day average.
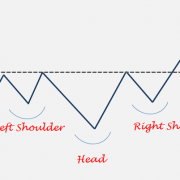
One of the common discussions start with the validity of such pattern… There is a common misconception regarding the continuation type H&S pattern.
Yes, it exists and it is a reliable chart pattern.
Let’s dive into this frequently identified chart pattern…

I will start this week’s update with an exciting opportunity from altcoins and then we will continue with the updates on other pairs. The opportunity is on a weekly scale and has the potential of breaking out to all-time highs from a well-defined ascending triangle.

The benchmark for the Global equity markets performance, the iShares MSCI All Country World Index ETF (ACWI.O) remains below its 200-day average. Price rebounded from the previous low at 81.4 levels. Breakout above 87 levels completed a possible short-term double bottom with the price target of 92.7 levels. The 200-day average is acting as resistance at 93.5 levels. So far price action is reversion to the mean.
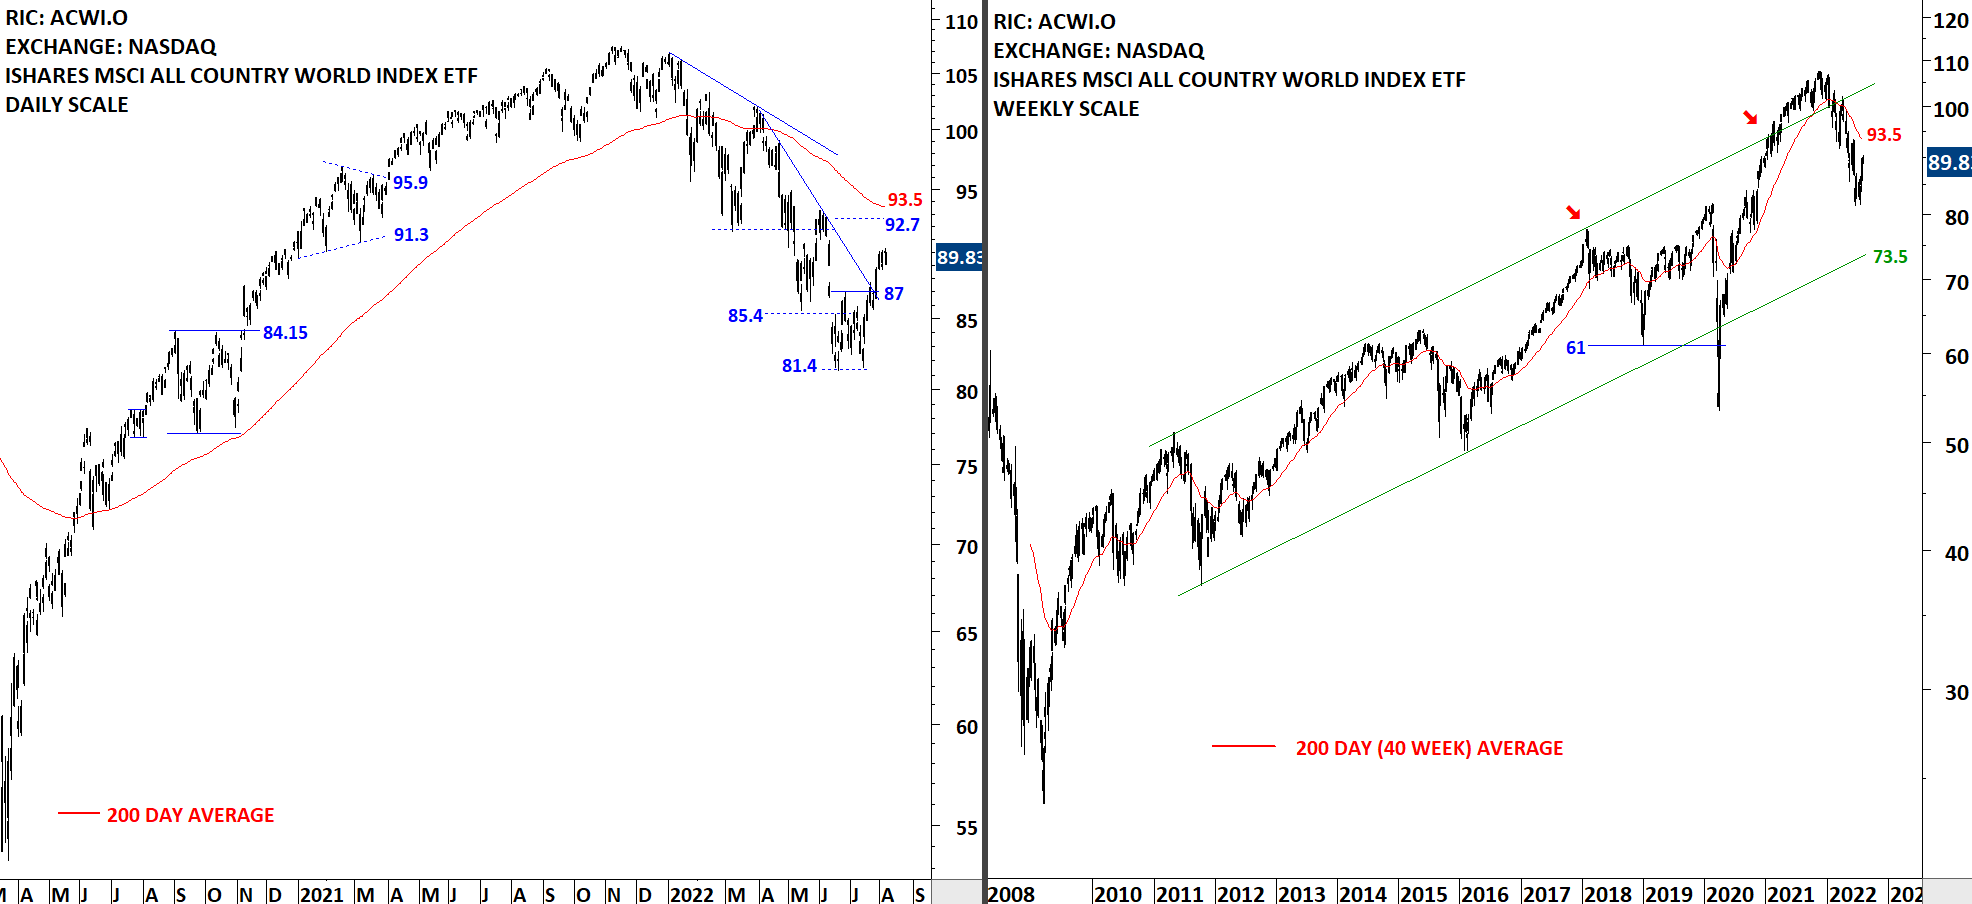
The benchmark for the Global equity markets performance, the iShares MSCI All Country World Index ETF (ACWI.O) remains below its 200-day average. Price rebounded from the previous low at 81.4 levels. Breakout above 87 levels completed a possible short-term double bottom with the price target of 92.7 levels. The 200-day average is acting as resistance at 93.8 levels.


Price action on many crypto pairs has been muted so far with many charts going through sideways consolidations. Minor lows held but rebounds have been weak.

Every week Tech Charts Global Equity Markets report features some of the well-defined, mature classical chart patterns under a lengthy watchlist and the chart pattern breakout signals that took place during that week. Global Equity Markets report covers single stocks from developed, emerging and frontier markets, ETF’s, select commodities, cryptocurrencies and global equity indices. Below chart is from the watchlist section of the weekly report. It is featuring a H&S bottom reversal chart pattern on Aon PLC listed on the New York Stock Exchange.
Aon PLC is a global professional services company. The Company provides advice and solutions to clients focused on risk, retirement and health, delivering distinctive client value via risk management and workforce productivity solutions. The stock is listed on the New York Stock Exchange. Price chart formed a 3 month-long head and shoulder bottom with the horizontal boundary acting as strong resistance at 281.00 levels. The horizontal boundary was tested several times over the course of the chart pattern. A daily close above 286.60 levels will confirm the breakout from the 3 month-long head and shoulder bottom with the possible chart pattern price target of 313.00 levels.
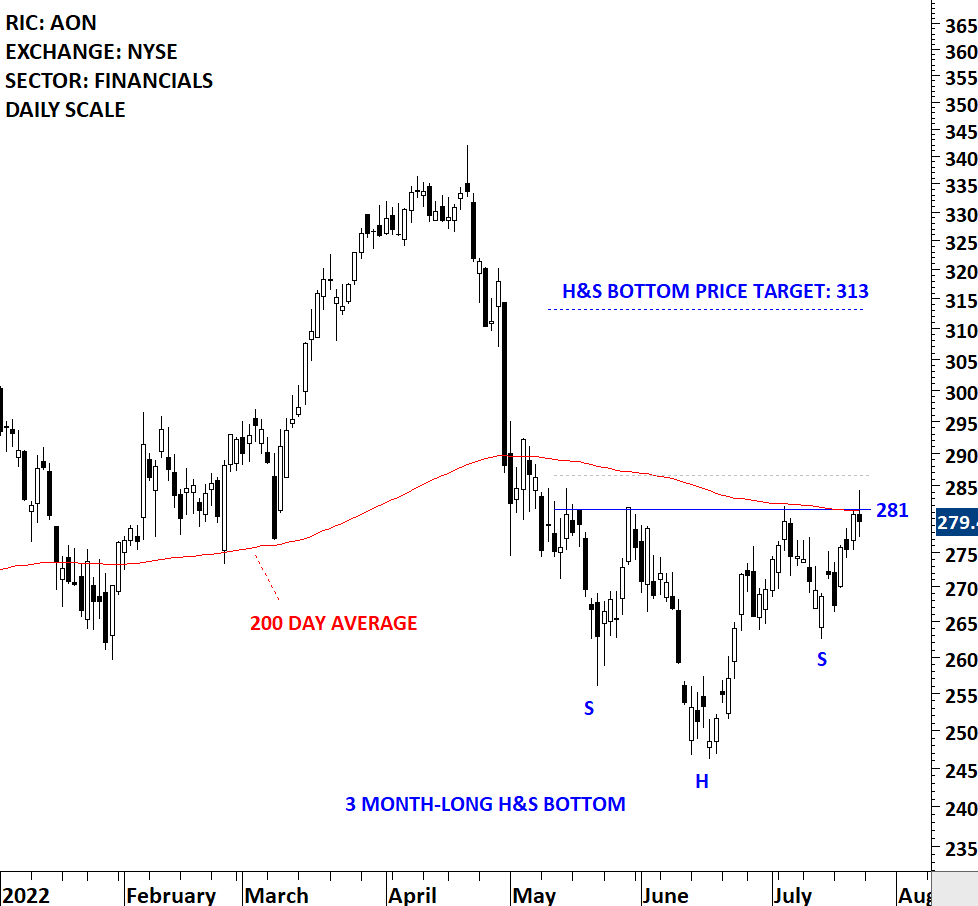
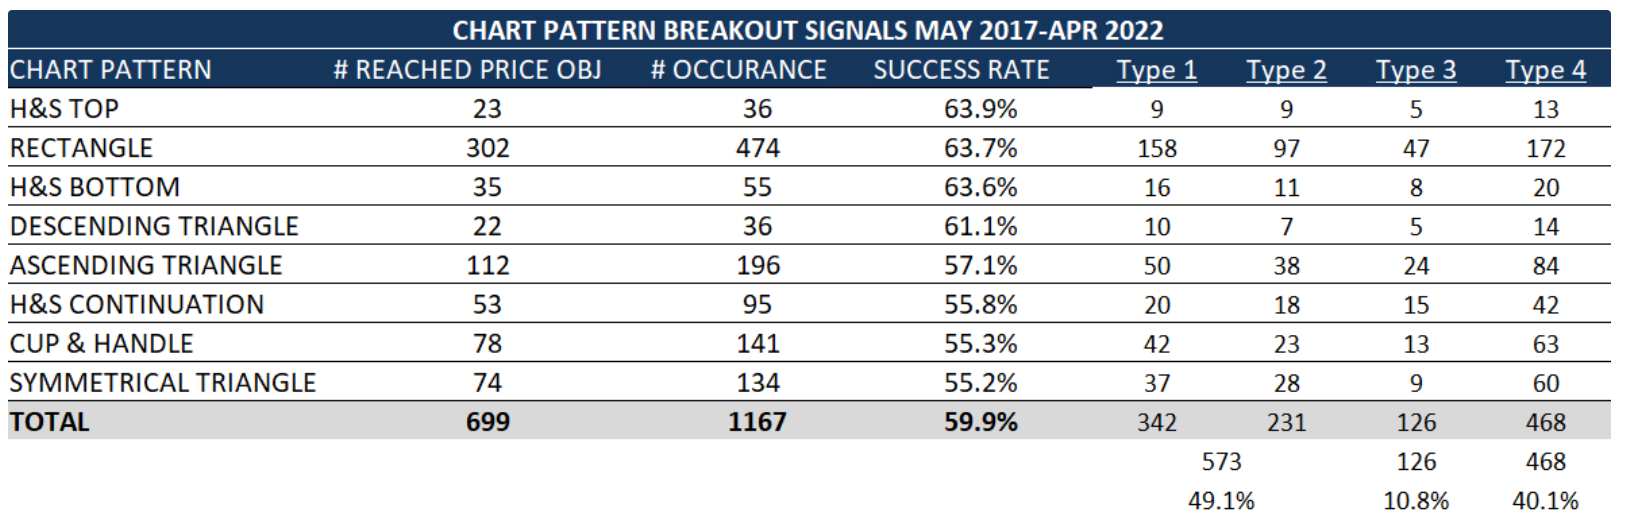
H&S top and bottom reversals have been reliable chart patterns over the past 5 years. While there hasn’t been many H&S reversals (as they only form at market turning points) those that have completed had good success rates. I’m monitoring the H&S bottom reversal on AON PLC closely as breakout can also clear the 200-day average at the same time as the neckline. Those are usually high conviction setups as they signal not only a reversal but a change in trend.
By becoming a Premium Member, you’ll be able to improve your knowledge of the principles of classical charting.
With this knowledge, you can merge them with your investing system. In fact, some investors use my analyses to modify their existing style to invest more efficiently and successfully.
You will receive:
For your convenience your membership auto renews each year.


