CRYPTOCURRENCIES – February 23, 2022

In this report I’m adding more range-trading opportunities. There are several pairs that are testing strong support areas. Those can experience rebounds. Charts are mostly on weekly scale.

Read more

GLOBAL EQUITY MARKETS – February 19, 2022

REVIEW


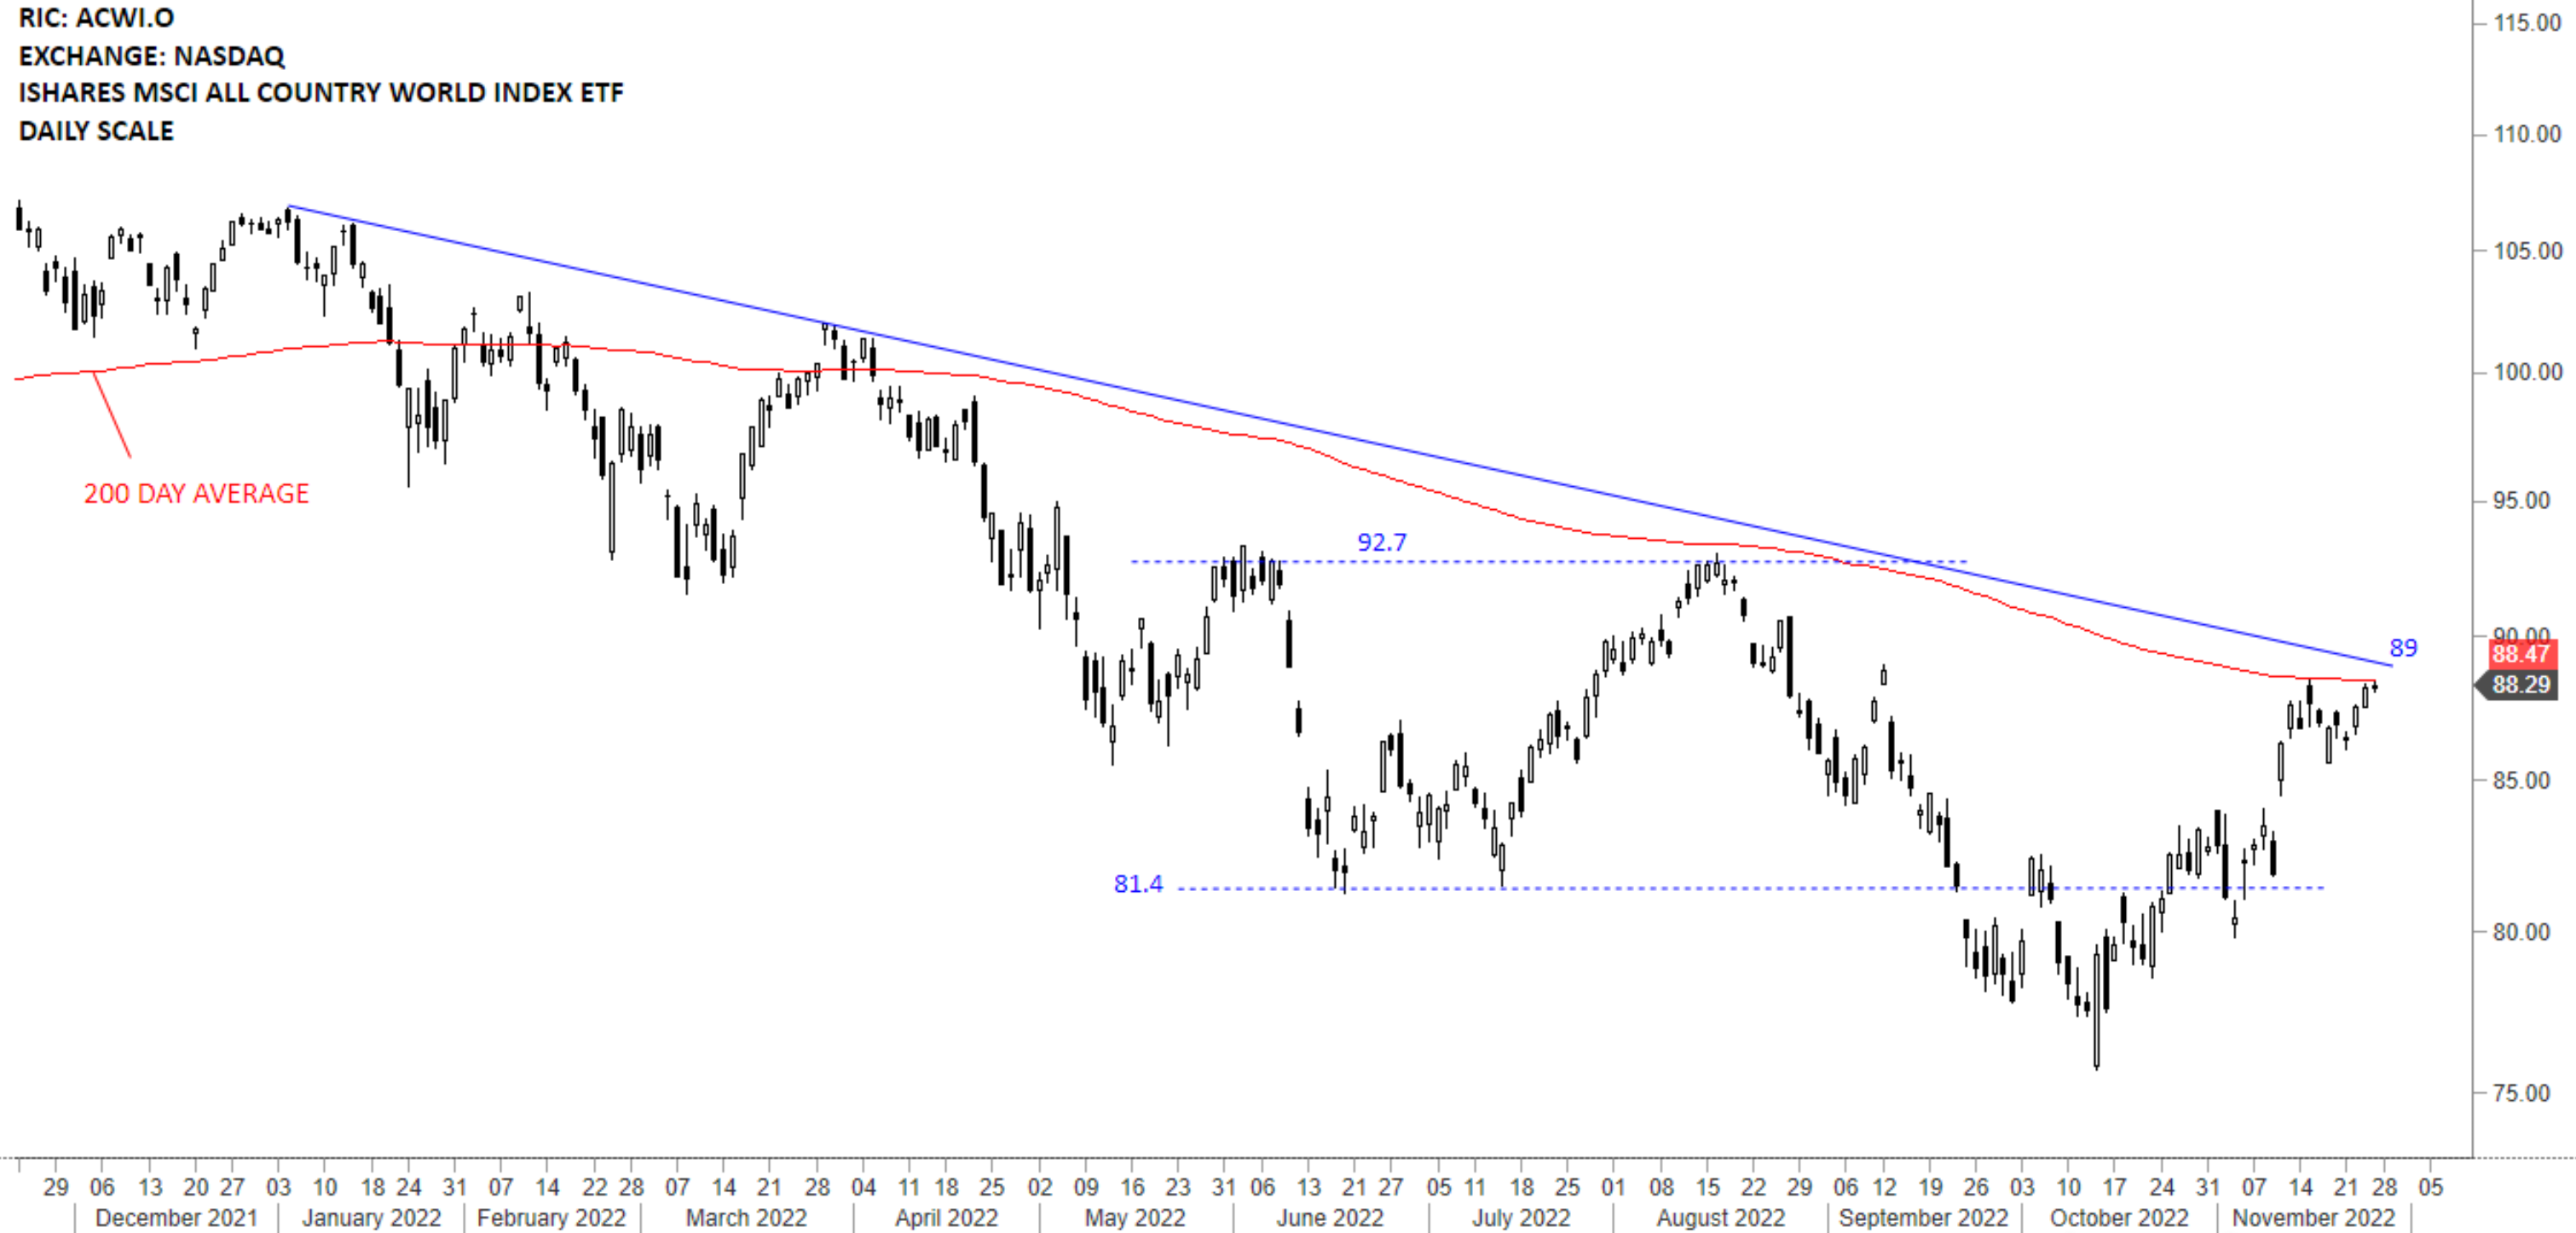
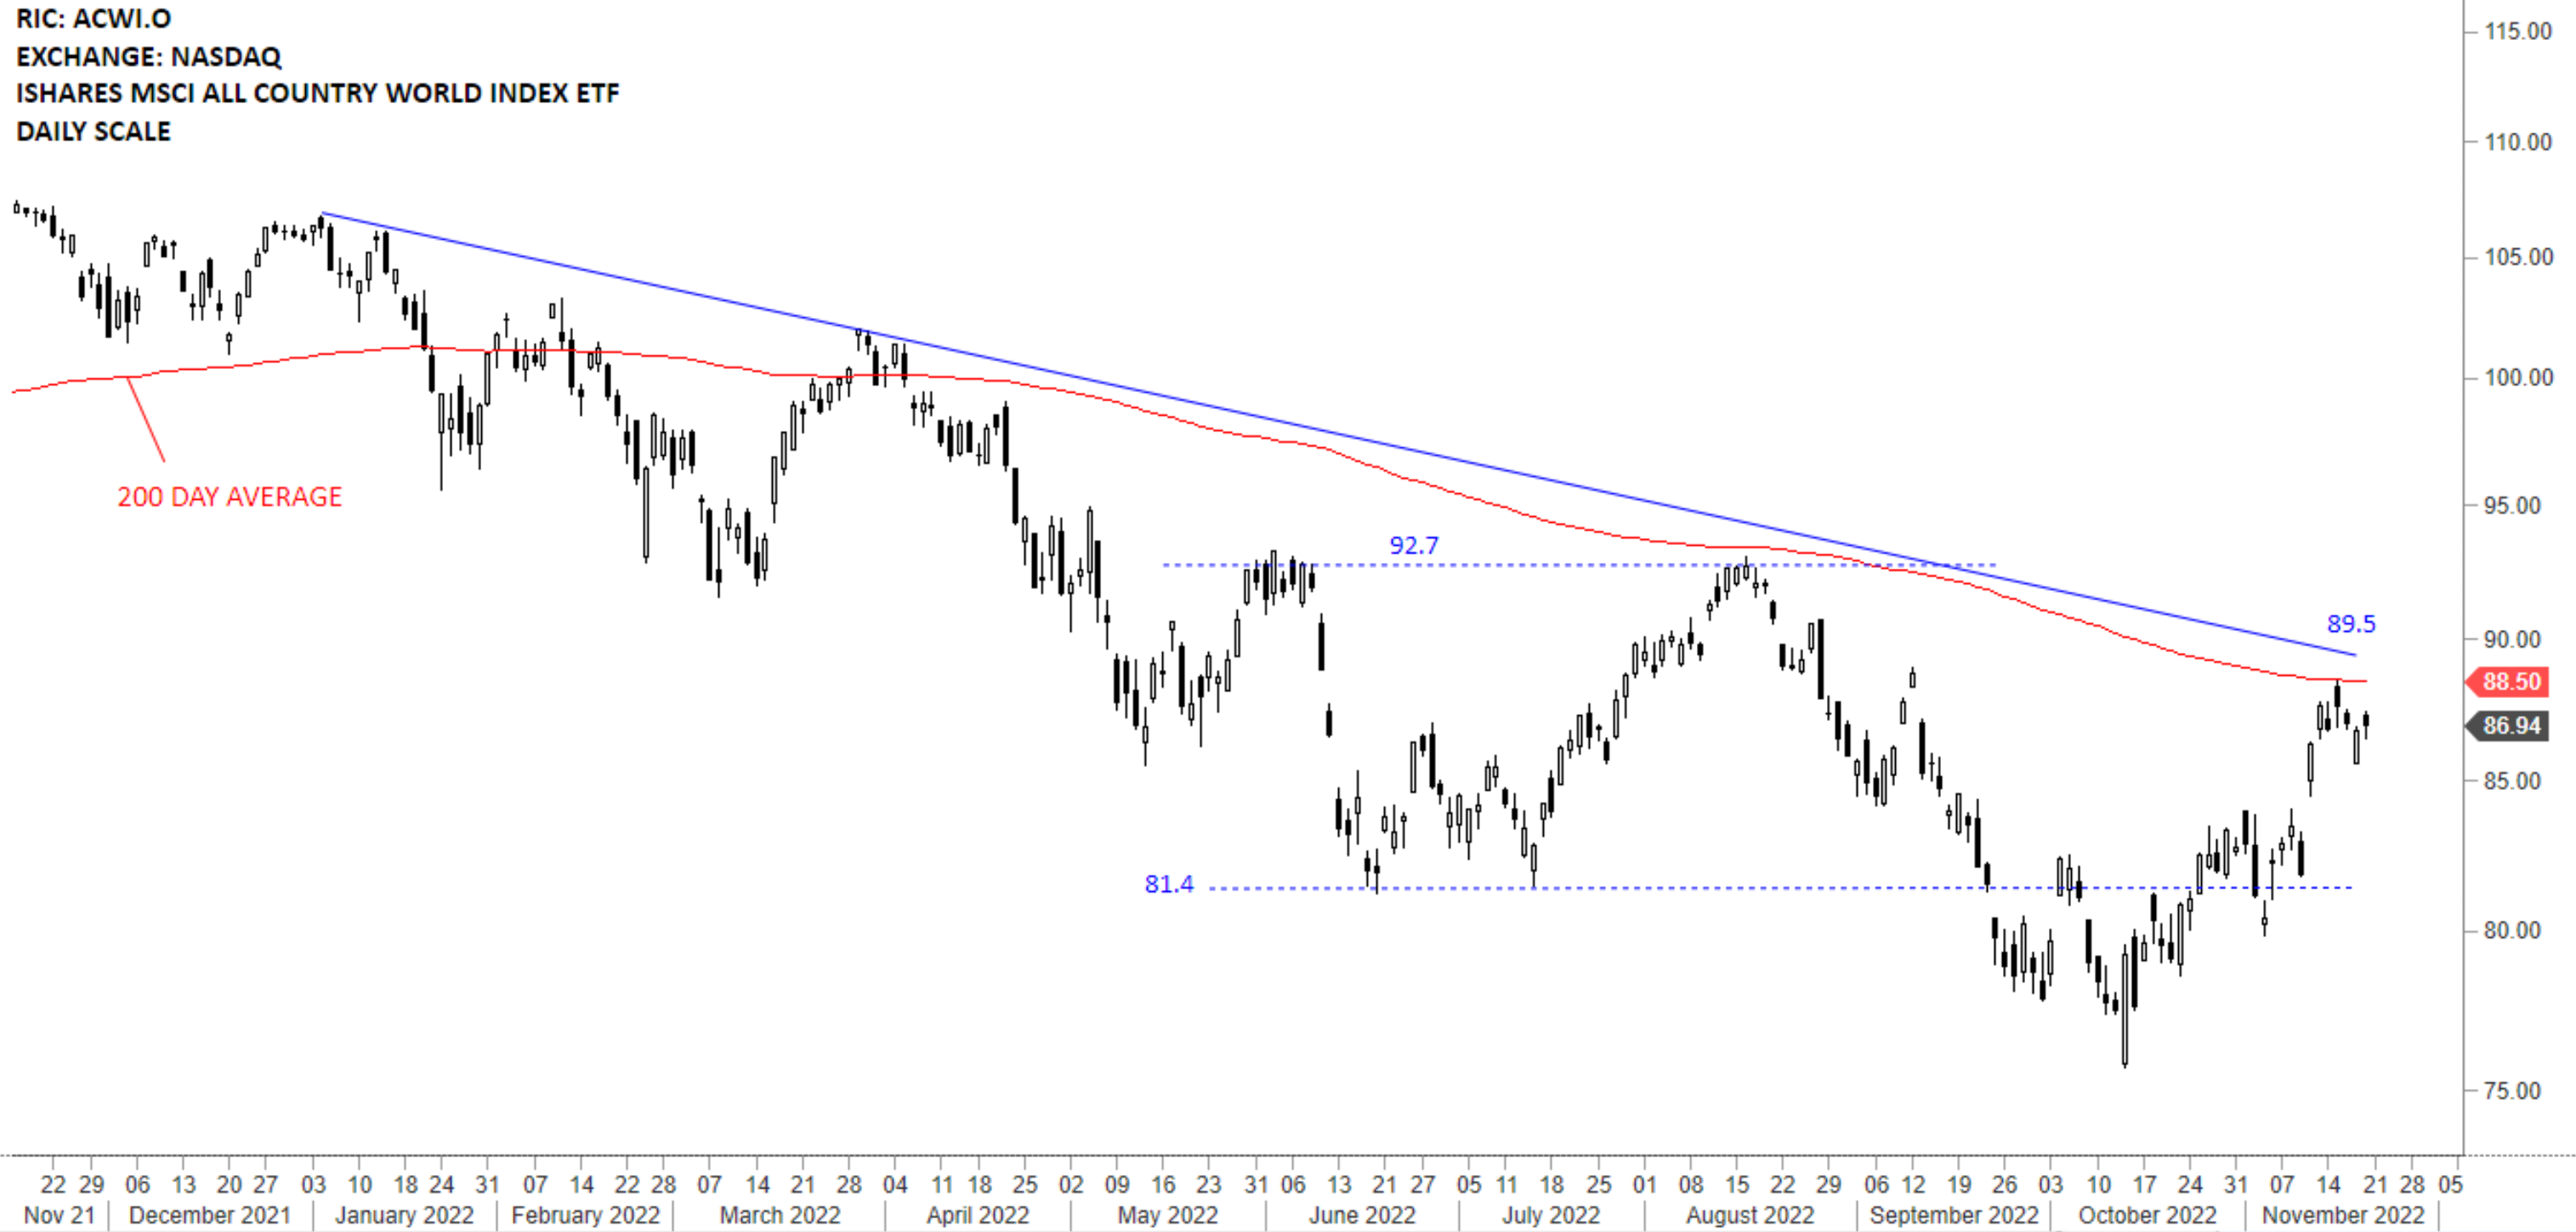
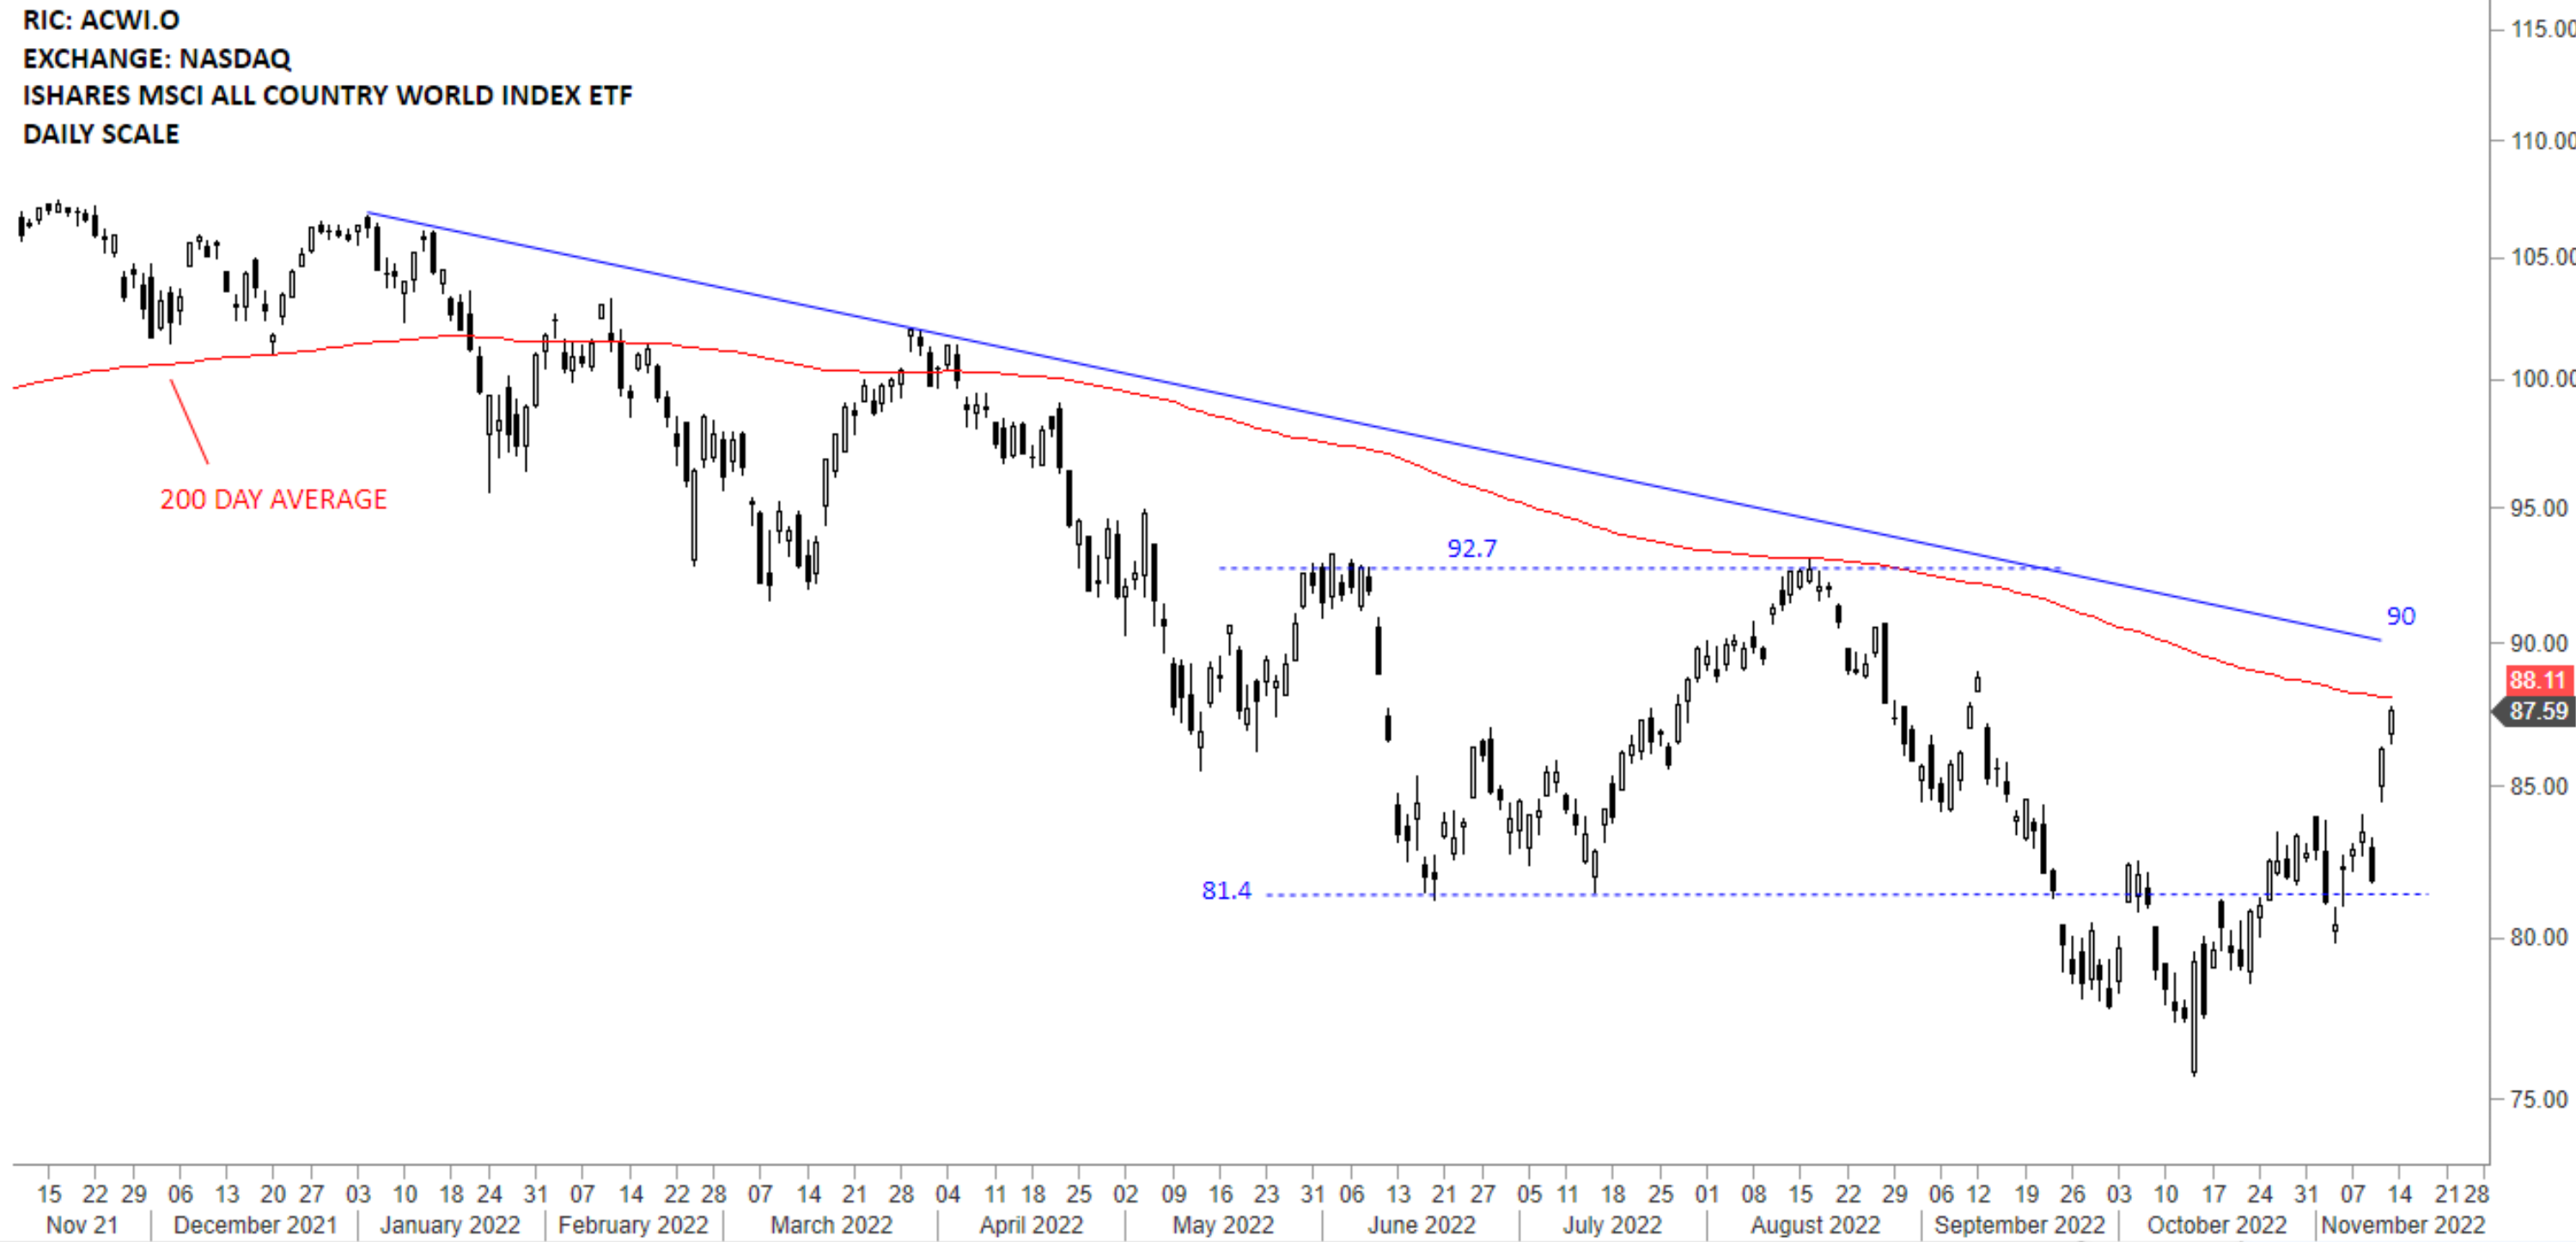
The benchmark for the Global equity markets performance, the iShares MSCI All Country World Index ETF (ACWI.O) is looking for direction around the 200-day average. Latest rebound got rejected at the 200-day average. 99-101.2 area is the new resistance. Unless we see a quick recovery above this resistance area, I will expect lower prices in the coming weeks.

Read more

TATA MOTORS LTD.

Every week Tech Charts Global Equity Markets report features some of the well-defined, mature classical chart patterns under a lengthy watchlist and the chart pattern breakout signals that took place during that week. Global Equity Markets report covers single stocks from developed, emerging and frontier markets, ETF’s, select commodities, cryptocurrencies and global equity indices. Below chart is from the watchlist section of the weekly report. It is featuring the text-book H&S continuation on Tata Motors listed on National Stock Exchange of India as well as the ADR that is listed on NYSE. Both charts have similar setups.

TATA MOTORS LTD (TAMO.NS)

Tata Motors Limited is an automobile company. The Company is engaged in manufacture of motor vehicles. The Company’s segments include automotive operations and all other operations. The stock is listed on the National Stock Exchange. Price chart formed a 3 month-long head and shoulder continuation with the horizontal boundary acting as strong resistance at 531.00 levels. The horizontal boundary was tested several times over the course of the chart pattern. A daily close above 547.00 levels will confirm the breakout from the 3 month-long consolidation with the possible chart pattern price target of 621.00 levels. Below I added the ADR price chart that is listed on the NYSE.


Tech Charts Membership

By becoming a Premium Member, you’ll be able to improve your knowledge of the principles of classical charting.

With this knowledge, you can merge them with your investing system. In fact, some investors use my analyses to modify their existing style to invest more efficiently and successfully.

Get Access Now

As a Premium Member of Aksel Kibar’s Tech Charts,

You will receive:

  • Global Equities Report. Delivered weekly.
  • Classical charting principles. Learn patterns and setups.
  • Actionable information. Worldwide indices and stocks of interest.
  • Risk management advice. The important trading points of each chart.
  • Information on breakout opportunities. Identify the ones you want to take action on.
  • Video tutorials. How patterns form and why they succeed or fail.
  • Watch list alerts. As they become available so you can act quickly.
  • Breakout alerts. Usually once a week.
  • Access to everything (now and as it becomes available)
    o Reports
    o Videos and video series
  • Multi-part webinar course. You learn the 8 most common charting principles.
  • Webinars. Actionable and timely advice on breaking out chart patterns.

For your convenience your membership auto renews each year.

Get Access Now

GLOBAL EQUITY MARKETS – February 12, 2022

REVIEW


The benchmark for the Global equity markets performance, the iShares MSCI All Country World Index ETF (ACWI.O) is looking for direction around the 200-day average. The ETF recovered above 99 levels but still hasn’t settled above the 200-day average. Latest price action changed my positive view on this ETF. 99-101.2 is the new resistance. Unless we see a quick recovery above this resistance area, I will expect lower prices in the coming weeks.

Read more

INTERIM UPDATE – February 9, 2022

I start my research on Mondays and finalize by end of day Thursday. Friday is dedicated to putting all ideas to the report format. During the week I come across good setups and those are featured in the weekly report. However, there are those that pop during the week and is worth bringing to your attention before the week finalizes. Below are the latest additions to Tech Charts watchlist. This charts will also be included in the weekly update.

Read more

CRYPTOCURRENCIES – February 6, 2022

In this report I’m adding more range-trading opportunities. There are several pairs that are testing strong support areas. Those can experience rebounds. Charts are mostly on weekly scale.

Read more

GLOBAL EQUITY MARKETS – February 5, 2022

REVIEW


The benchmark for the Global equity markets performance, the iShares MSCI All Country World Index ETF (ACWI.O) is looking for direction around the 200-day average. The ETF recovered above 99 levels but still hasn’t settled above the 200-day average. Latest price action changed my positive view on this ETF. 99-101.2 is the new resistance. Unless we see a quick recovery above this resistance area, I will expect lower prices in the coming weeks.

Read more

GLOBAL EQUITY MARKETS – January 29, 2022

REVIEW


The benchmark for the Global equity markets performance, the iShares MSCI All Country World Index ETF (ACWI.O) not only breached the 200-day average but also broke down the horizontal support at 99 levels. Latest price action changed my positive view on this ETF. 99-101.2 area becomes the resistance. Unless we see a quick recovery above this resistance area, I will expect lower prices in the coming weeks.

Read more

NETHERLANDS AEX INDEX

Every week Tech Charts Global Equity Markets report features some of the well-defined, mature classical chart patterns under a lengthy watchlist and the chart pattern breakout signals that took place during that week. Global Equity Markets report covers single stocks from developed, emerging and frontier markets, ETF’s, select commodities, cryptocurrencies and global equity indices. Below chart is from the review section of the weekly report. It is featuring the text-book H&S top reversal on Netherlands AEX Index.

NETHERLANDS AEX INDEX

As Global equities came under pressure a text-book H&S top reversal can be identified on Netherlands AEX Index. 5 month-long H&S top has a neckline at 754 levels. The neckline is also overlapping with the 200-day average. I call these inflection points where a chart pattern boundary overlaps with a long-term average (200-day). They are high conviction setups for me. A breakdown of the chart pattern horizontal boundary will also push the price below the long-term average, confirming the downtrend. H&S top has a price target of 694 levels. It is important to note that there has been several cases where H&S top reversals failed. Those failures can offer tradable long opportunities. Below video explains how to take advantage of a H&S top failure.

H&S top failure and how to trade it from the long side


Tech Charts Membership

By becoming a Premium Member, you’ll be able to improve your knowledge of the principles of classical charting.

With this knowledge, you can merge them with your investing system. In fact, some investors use my analyses to modify their existing style to invest more efficiently and successfully.

Get Access Now

As a Premium Member of Aksel Kibar’s Tech Charts,

You will receive:

  • Global Equities Report. Delivered weekly.
  • Classical charting principles. Learn patterns and setups.
  • Actionable information. Worldwide indices and stocks of interest.
  • Risk management advice. The important trading points of each chart.
  • Information on breakout opportunities. Identify the ones you want to take action on.
  • Video tutorials. How patterns form and why they succeed or fail.
  • Watch list alerts. As they become available so you can act quickly.
  • Breakout alerts. Usually once a week.
  • Access to everything (now and as it becomes available)
    o Reports
    o Videos and video series
  • Multi-part webinar course. You learn the 8 most common charting principles.
  • Webinars. Actionable and timely advice on breaking out chart patterns.

For your convenience your membership auto renews each year.

Get Access Now

GLOBAL EQUITY MARKETS – January 22, 2022

REVIEW


The benchmark for the Global equity markets performance, the iShares MSCI All Country World Index ETF (ACWI.O) is in an uptrend. The ETF found resistance at the minor high at 107.5. Friday’s price action breached the 200-day average but still remains above the horizontal support at 99 levels. Breakdown below 99 will change my positive view on this ETF. I will monitor ACWI ETF in the following week to see if price will quickly recover above the 200-day average and remain in trading range between 99 and 107.5. Note; price is resting above the upper boundary of the trend channel on weekly scale price chart. Breakdown can result in a lager scale correction.

Read more