Dear Tech Charts Members,
Another year is behind us. I want to take this opportunity to Thank you all for being part of Tech Charts community. It has been a great year of finding out, sharing, communicating and improving. Our engagements, be it through social media or through e-mails, helped me to make the service better and review what I can add more that would help you to make better financial decisions. I’m grateful for having you as members and part of our community. I look forward to serving you in the New Year with great chart pattern ideas, educational videos and with many more new interactive content.
I wish you all a healthy and successful New Year.
Regards,
Aksel Kibar, CMT
REVIEW
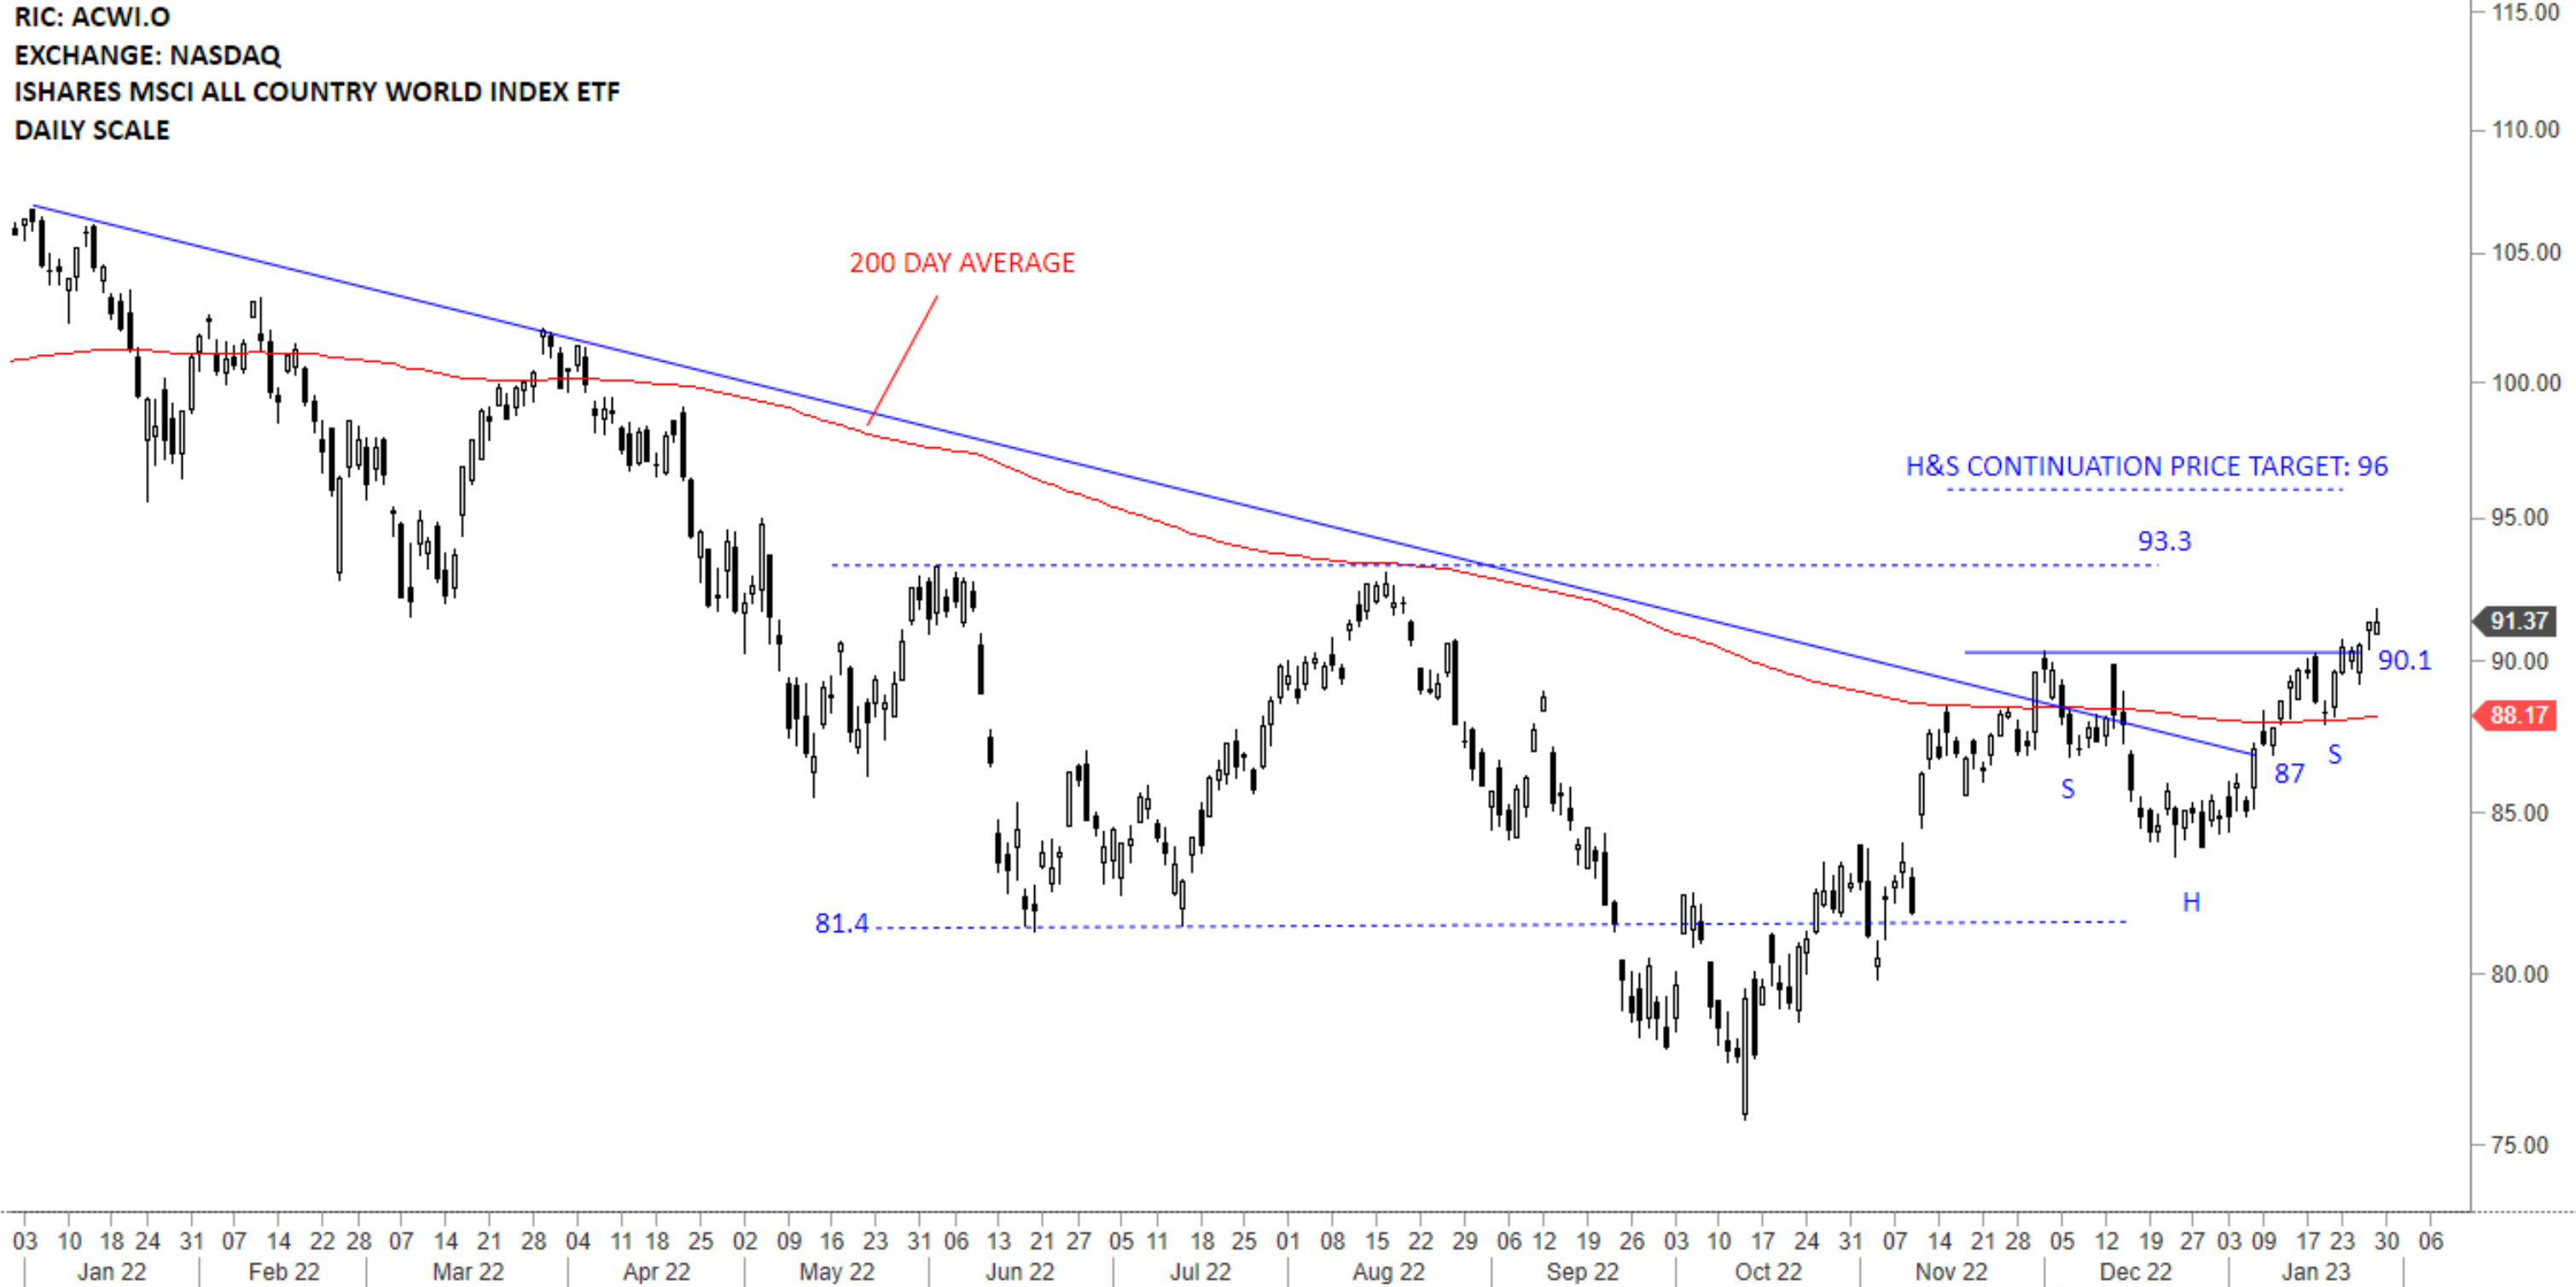
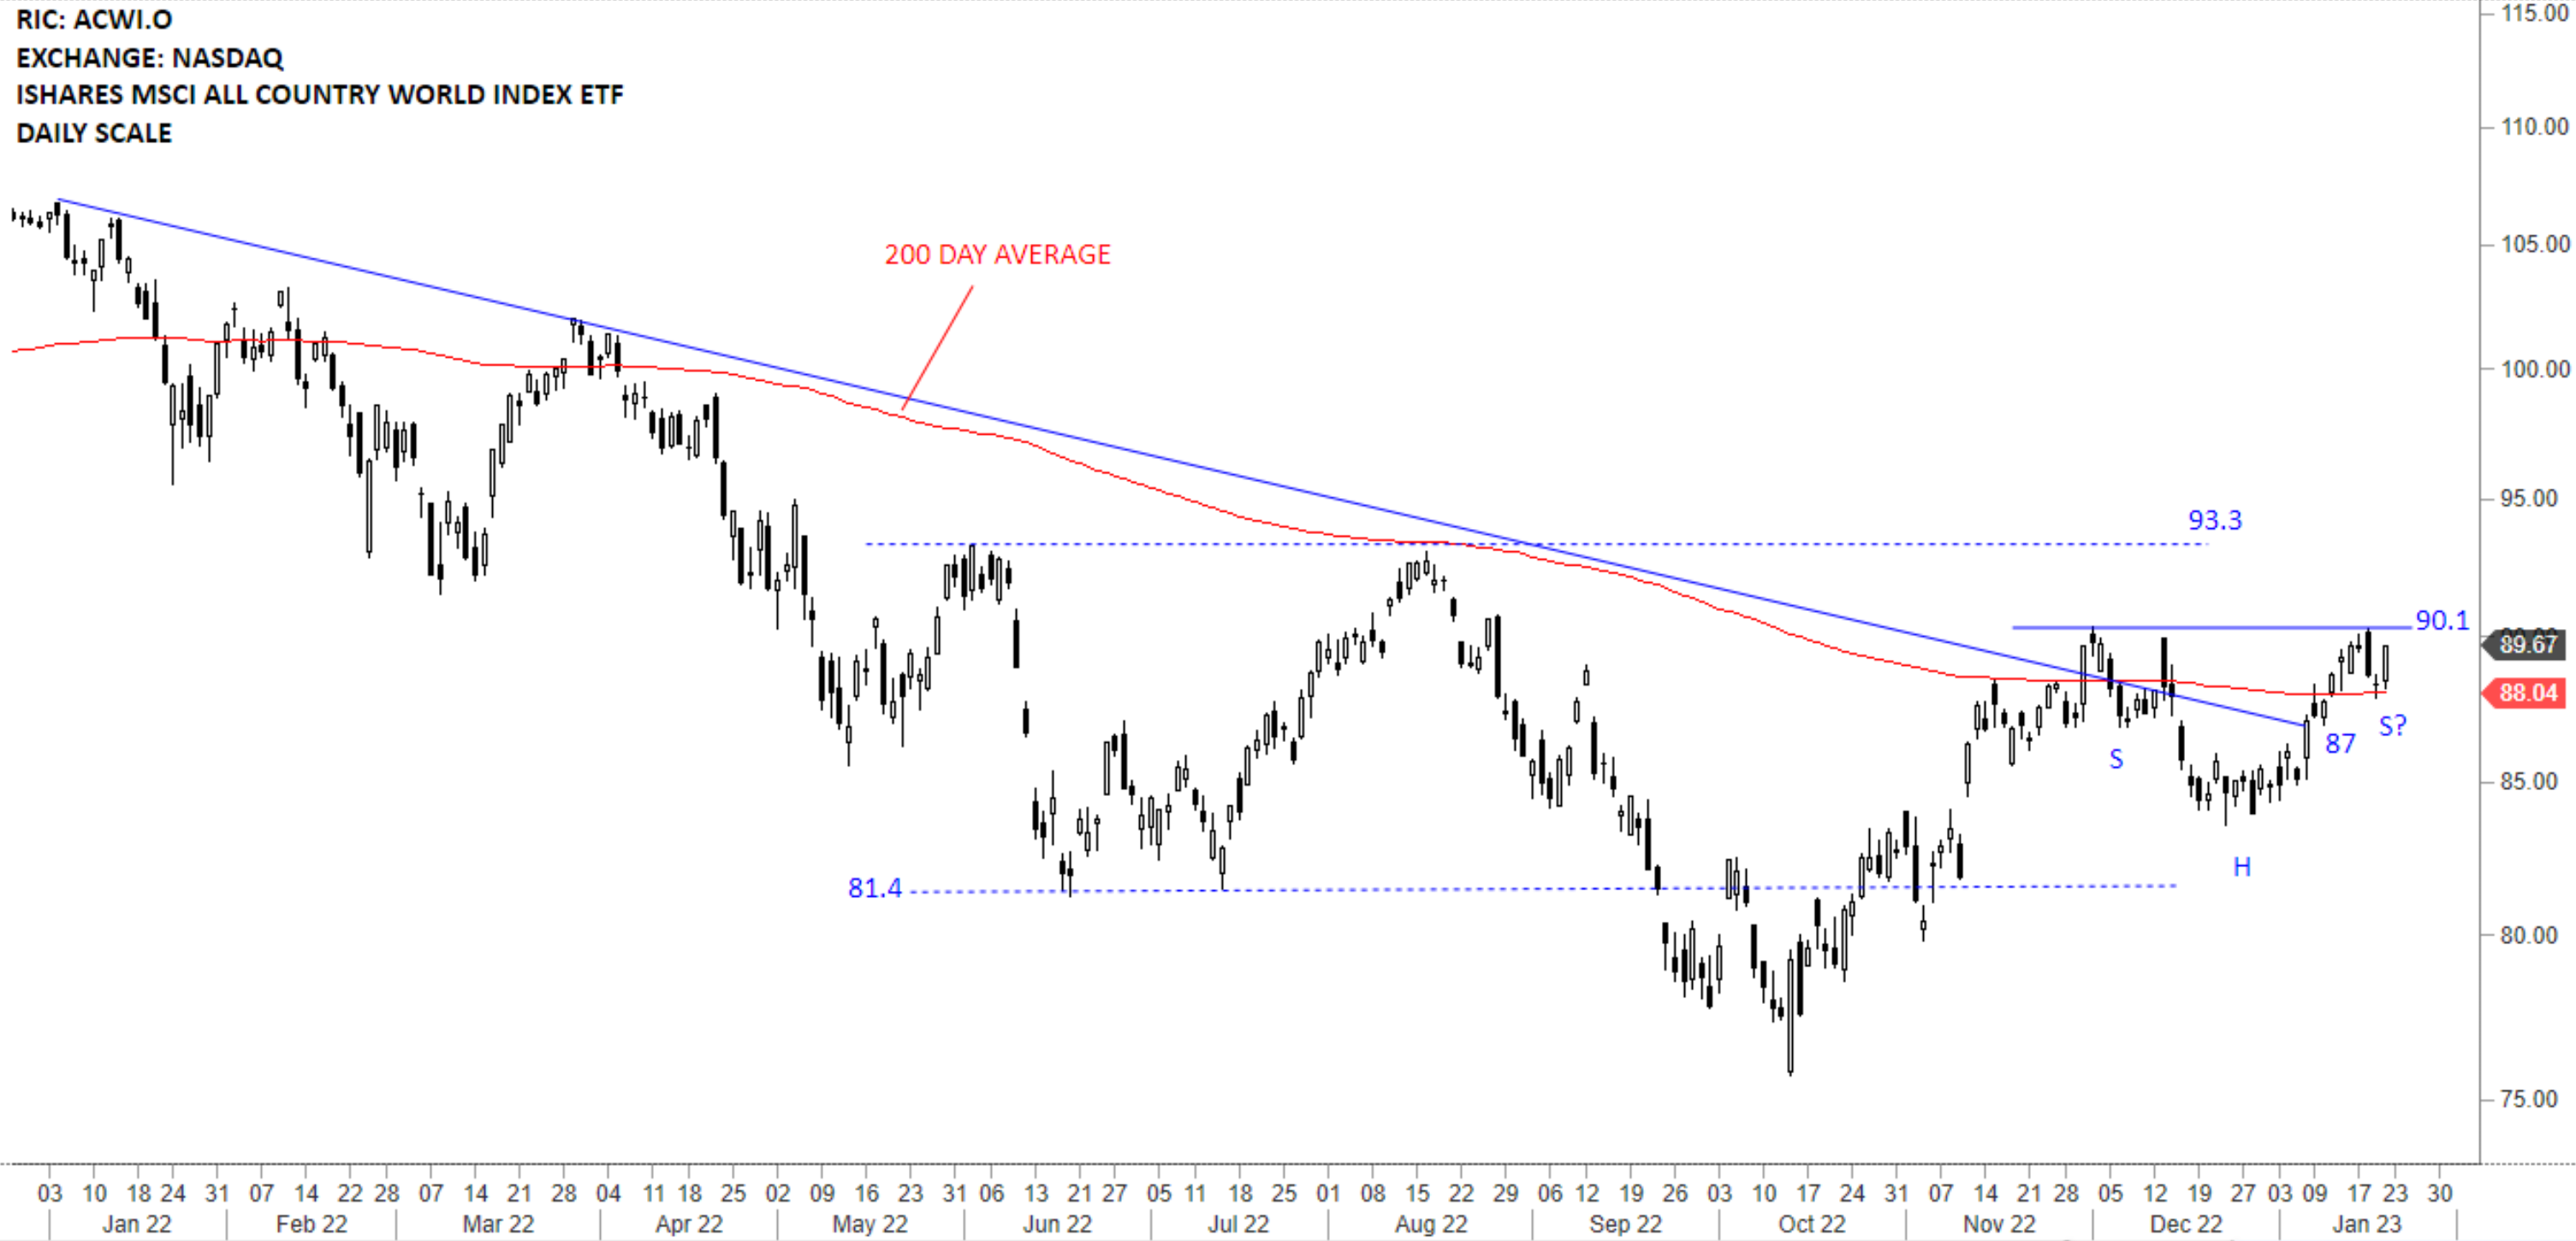
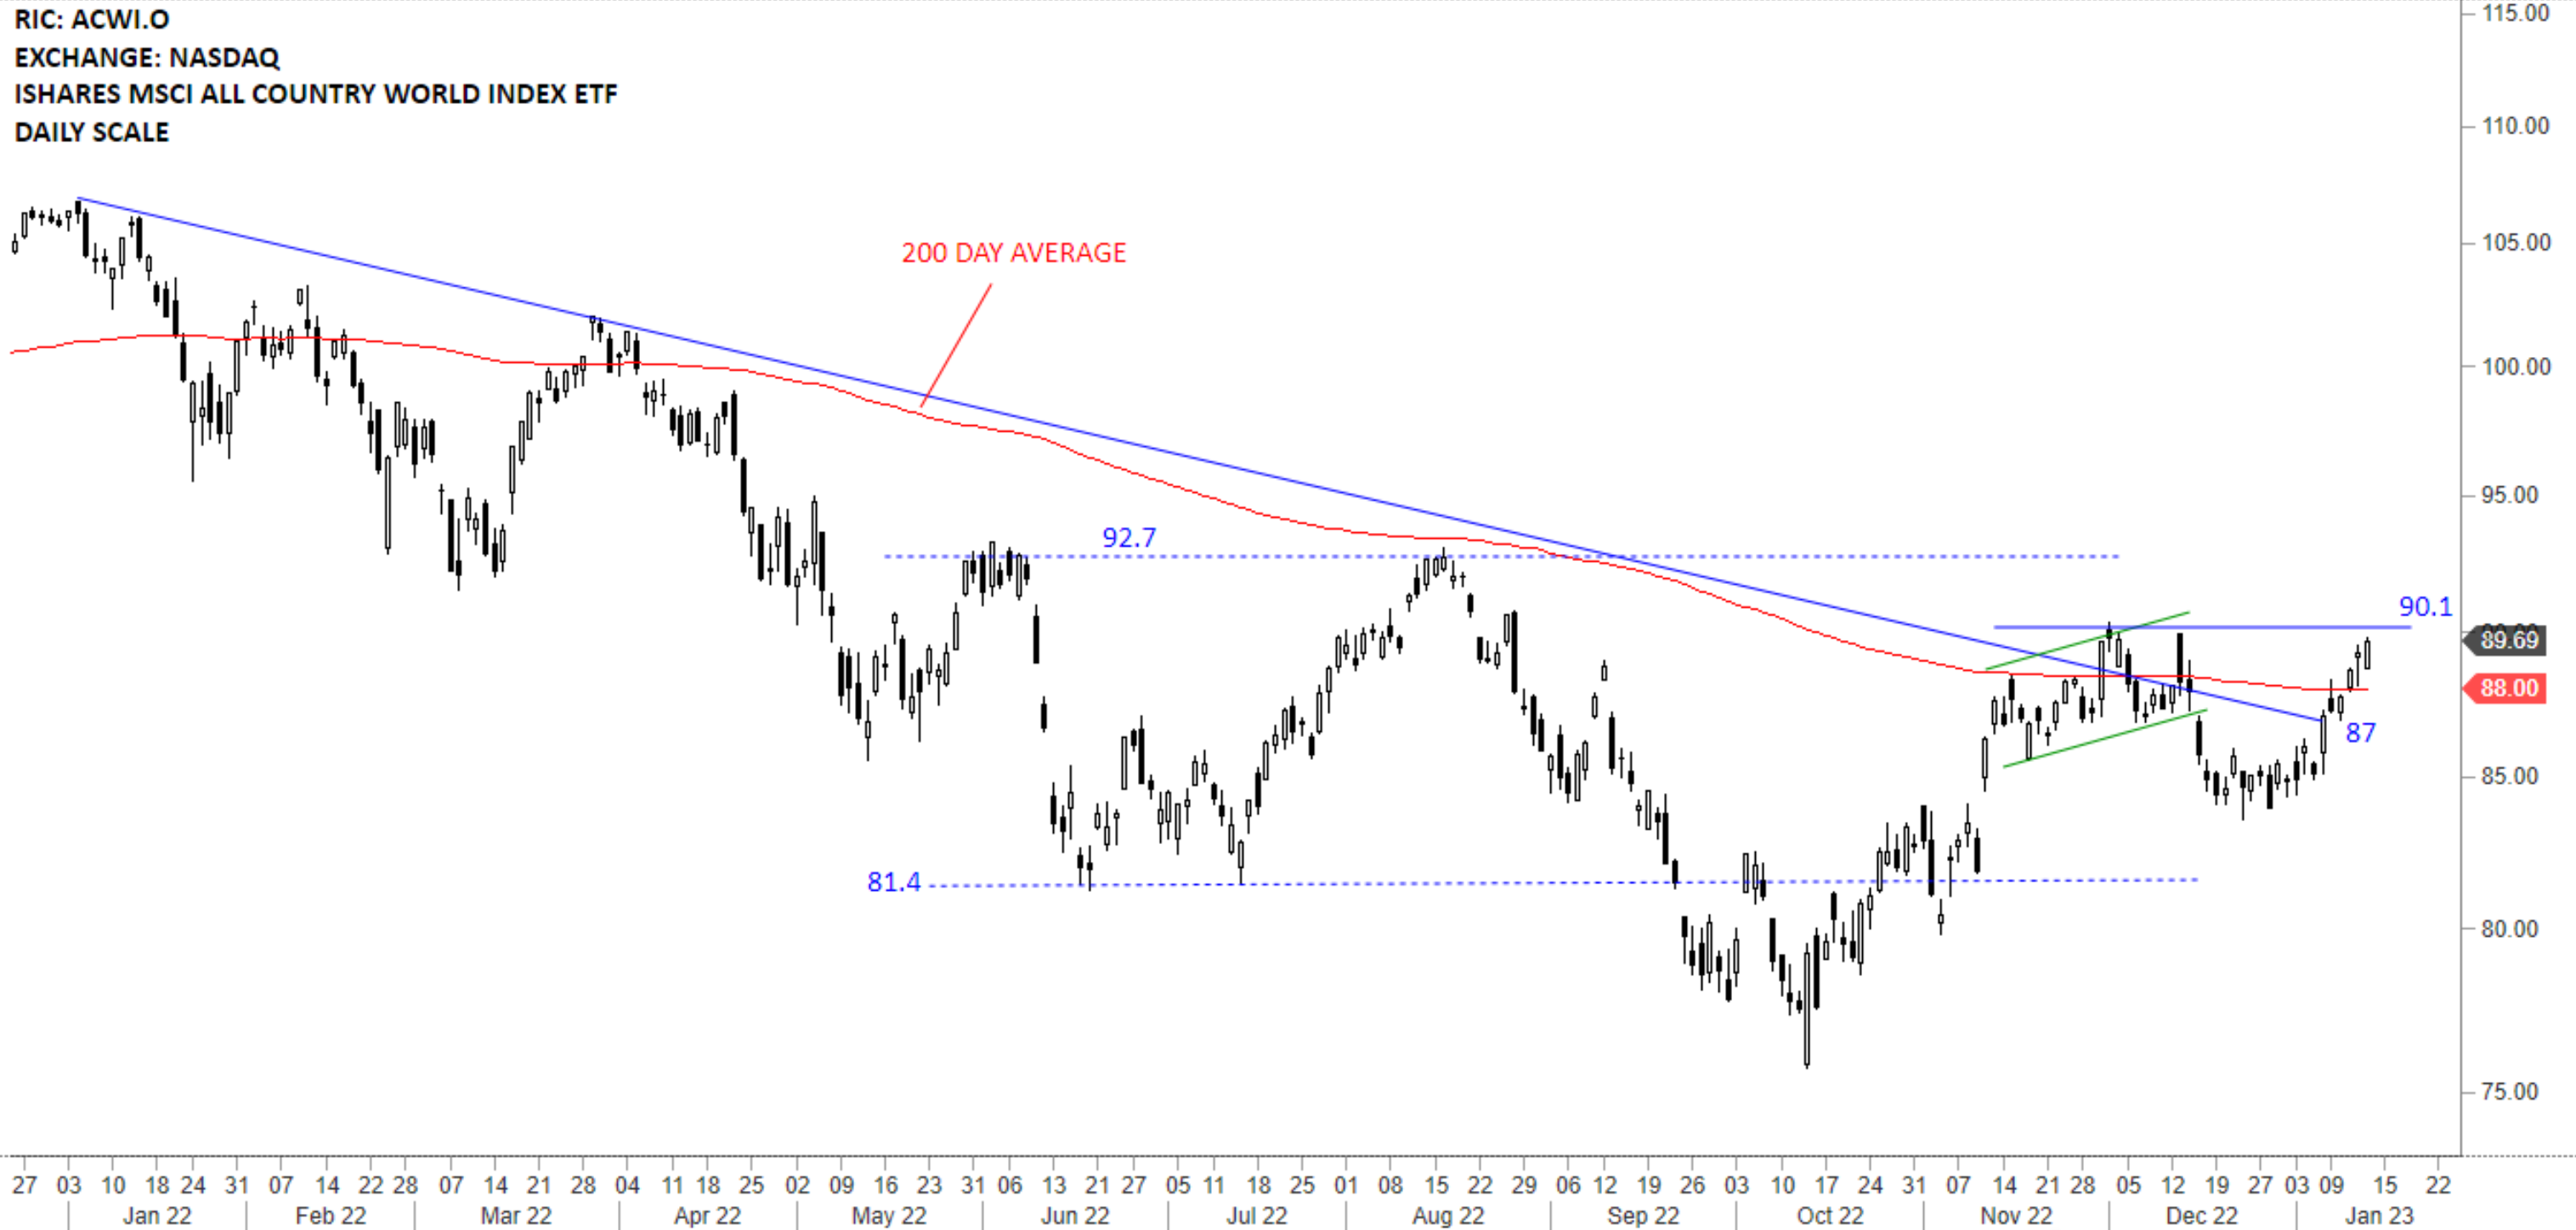
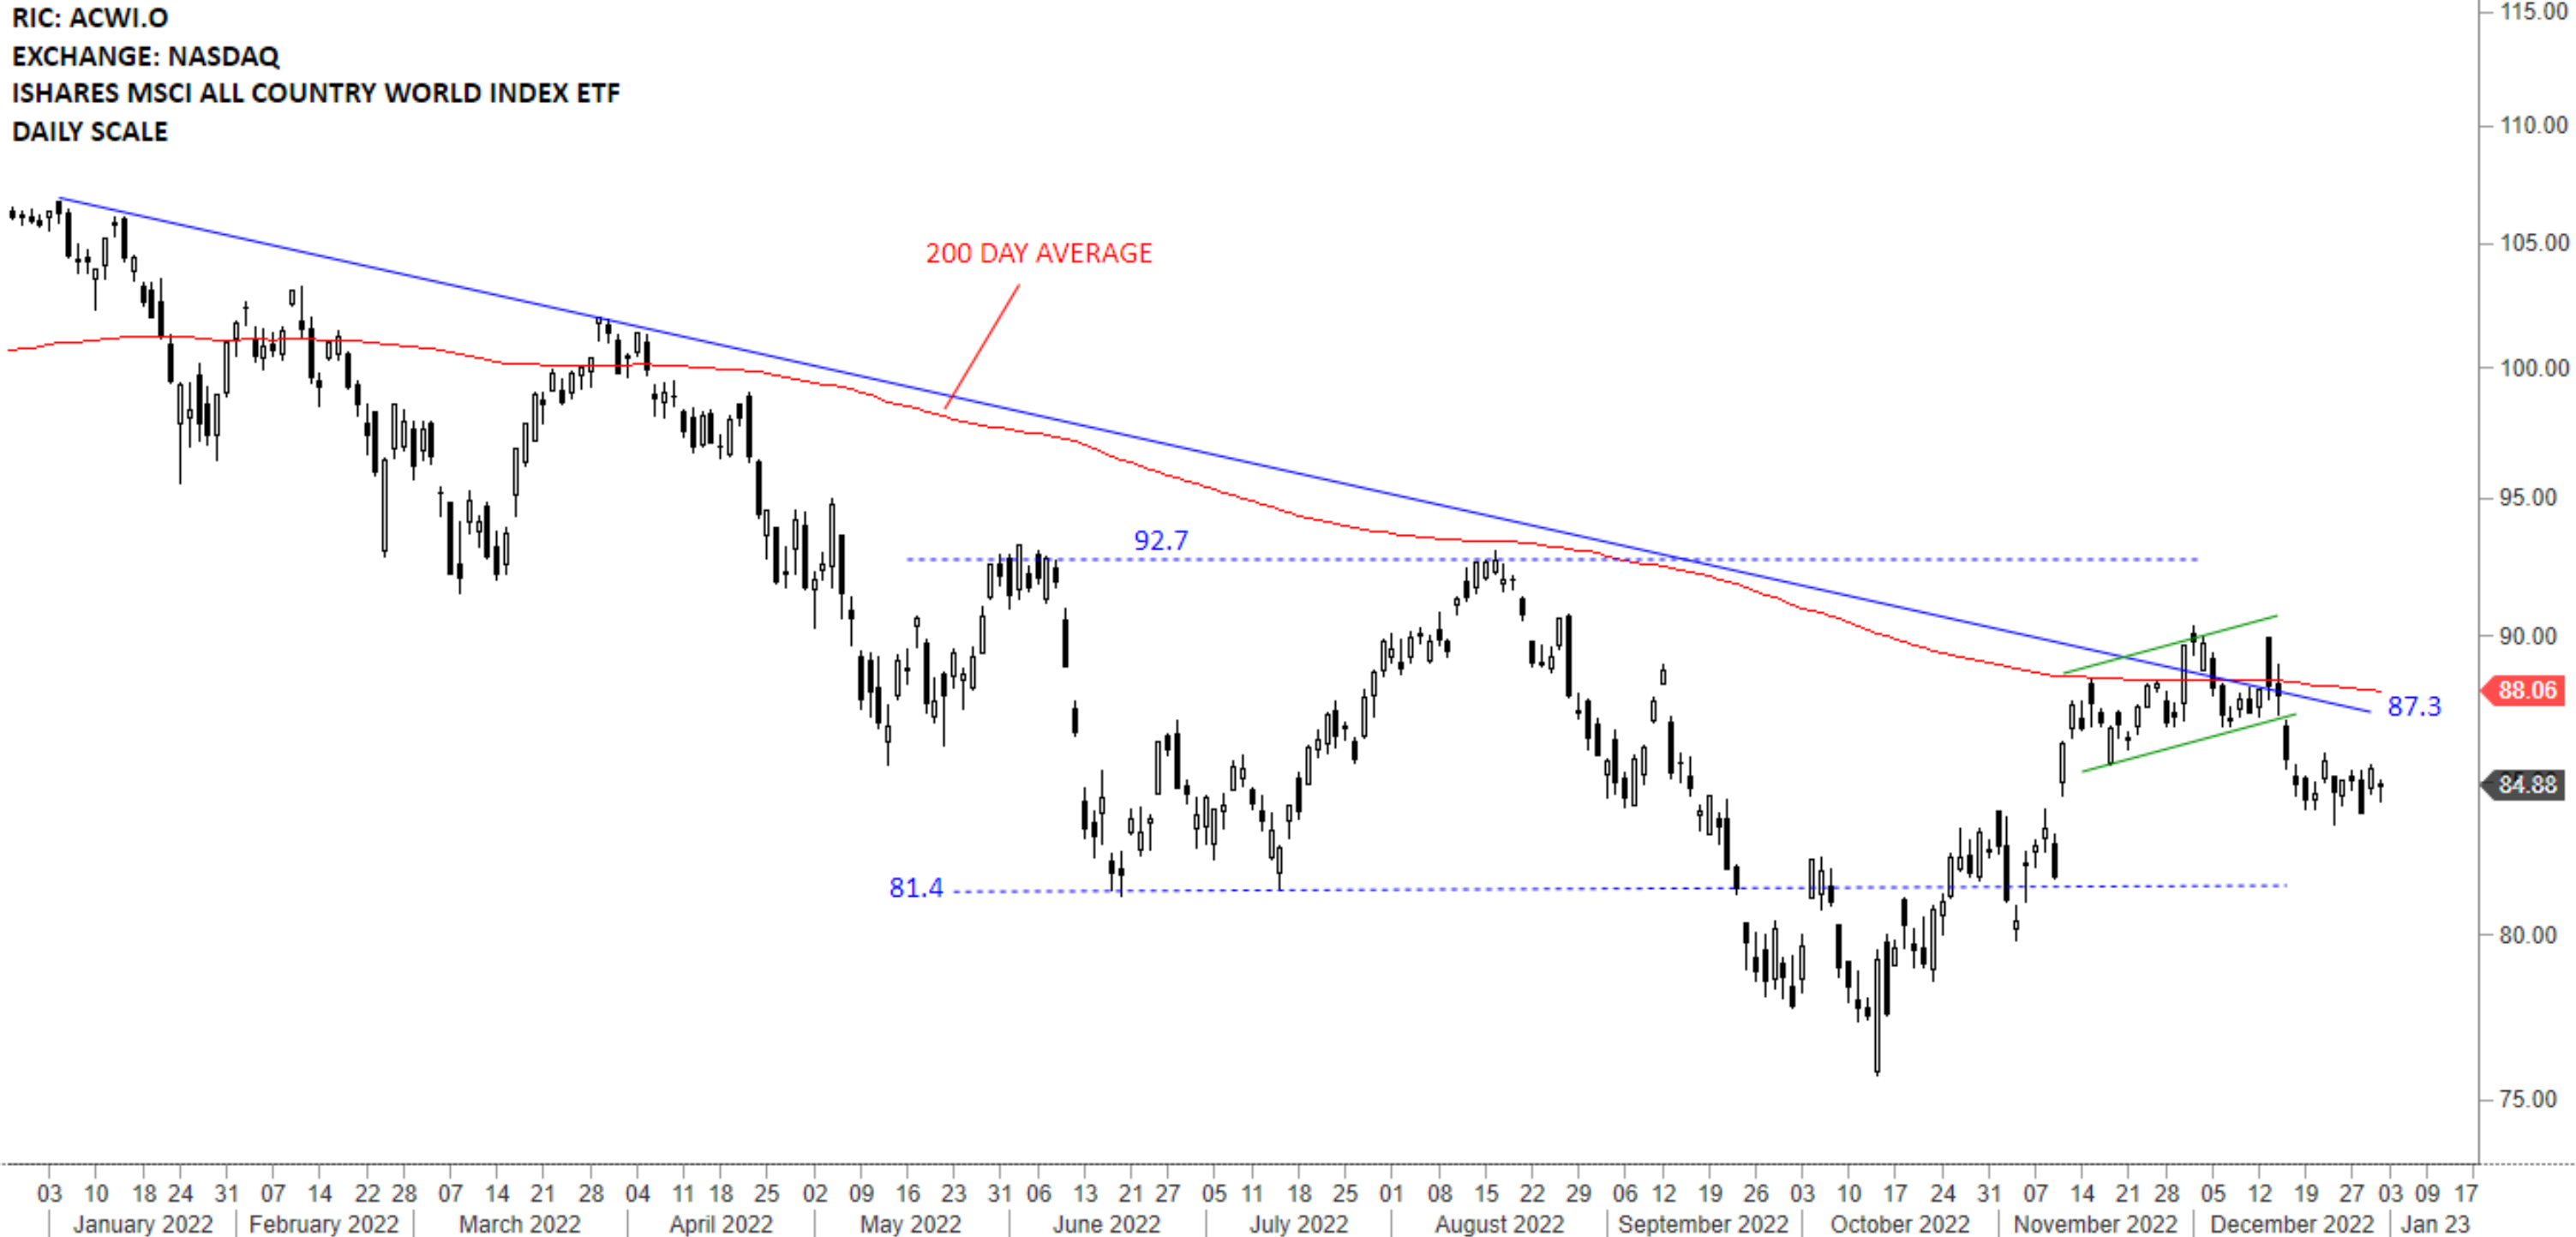
The benchmark for the Global equity markets performance, the iShares MSCI All Country World Index ETF (ACWI.O) failed to clear its 200-day average which is resulting in a downtrend towards 81.4 levels. It is now clear that 88.06-90 area will act as strong resistance. Breakout above this area will possibly reverse the existing downtrend. Until that happens we continue to view the chart as a downtrend. Price continues to remain below strong resistance area.
Read more