STAR BULK CARRIERS CORP (SBLK.O)

Every week Tech Charts Global Equity Markets report features some of the well-defined, mature classical chart patterns under a lengthy watchlist and the chart pattern breakout signals that took place during that week. Global Equity Markets report covers single stocks from developed, emerging and frontier markets, ETF’s, select commodities, cryptocurrencies and global equity indices. Below chart is from the watchlist section of the weekly report. It is featuring a rectangle continuation chart pattern on Star Bulk Carriers Corp listed on the Nasdaq Stock Exchange.

STAR BULK CARRIERS CORP (SBLK.O)

Star Bulk Carriers Corp is a Greece-based shipping company. It owns and operates a fleet of dry bulk carrier vessels. The Company’s vessels transport major bulks, which include iron ore, coal and grain, and minor bulks, which include bauxite, fertilizers and steel products. The stock is listed on the Nasdaq Stock Exchange. Price chart formed a 2 month-long rectangle with the horizontal boundary acting as resistance at 31.90 levels. The horizontal boundary was tested several times over the course of the chart pattern. A daily close above 32.80 levels will confirm the breakout from the 2 month-long rectangle with the possible chart pattern price target of 39.00 levels. Rectangle can act as a continuation chart pattern after the stock completed a larger scale ascending triangle. Data as of May 16, 2022.


Tech Charts Membership

By becoming a Premium Member, you’ll be able to improve your knowledge of the principles of classical charting.

With this knowledge, you can merge them with your investing system. In fact, some investors use my analyses to modify their existing style to invest more efficiently and successfully.

Get Access Now

As a Premium Member of Aksel Kibar’s Tech Charts,

You will receive:

  • Global Equities Report. Delivered weekly.
  • Classical charting principles. Learn patterns and setups.
  • Actionable information. Worldwide indices and stocks of interest.
  • Risk management advice. The important trading points of each chart.
  • Information on breakout opportunities. Identify the ones you want to take action on.
  • Video tutorials. How patterns form and why they succeed or fail.
  • Watch list alerts. As they become available so you can act quickly.
  • Breakout alerts. Usually once a week.
  • Access to everything (now and as it becomes available)
    o Reports
    o Videos and video series
  • Multi-part webinar course. You learn the 8 most common charting principles.
  • Webinars. Actionable and timely advice on breaking out chart patterns.

For your convenience your membership auto renews each year.

Get Access Now

Tech Charts Year in Review with Aksel – Thursday, May 19, 830 am mountain

Dear Tech Charts Members,

Tech Charts Year in Review. Aksel will compare the before and after of charts shared with Members over the last year. As always, we’ll end the webinar with a live Q&A.

Scheduled for: Thursday, May 19, 2022, at 8:30 am mountain (register below)

Tech Charts Year in Review – Year Five

  • A study on Chart Pattern Reliability with the available sample data over the past year.
  • Rectangle has been a reliable chart pattern with the H&S variations. Examples and studies on those reliable patterns.
  • Detailed statistics on different types of breakouts. 
  • The impact of different market cycles on chart pattern opportunities.
  • Live Q&A

Read more

GLOBAL EQUITY MARKETS – May 14, 2022

REVIEW


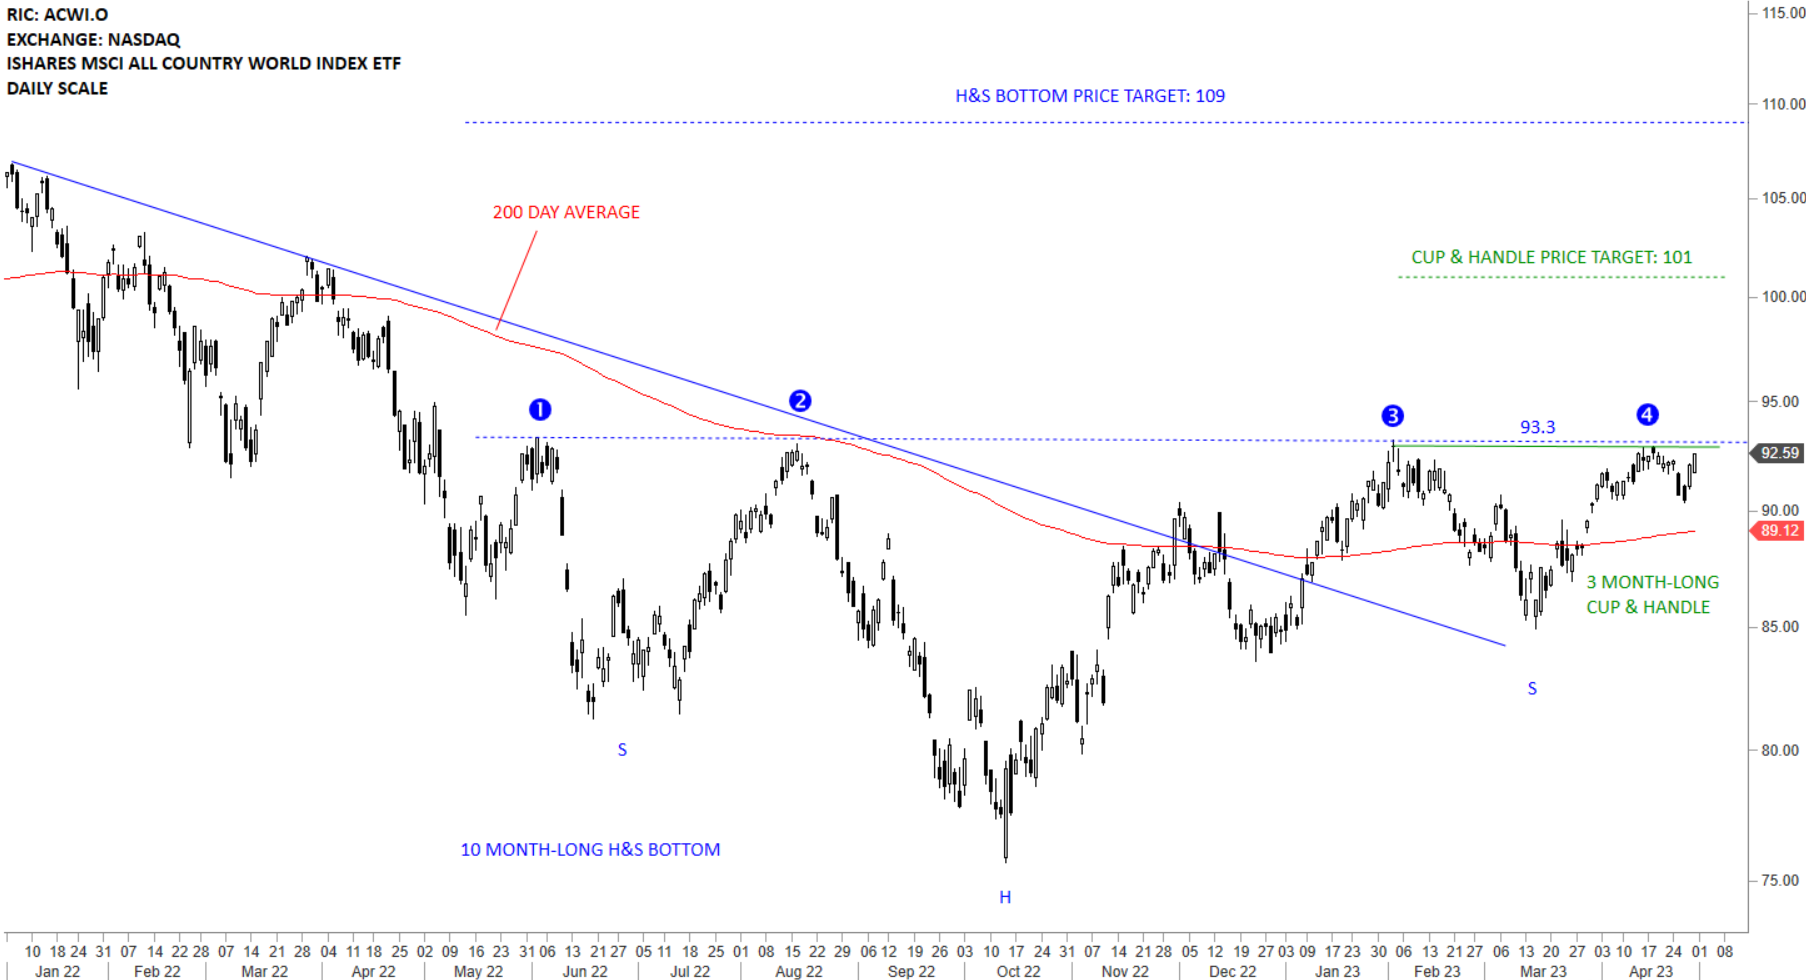
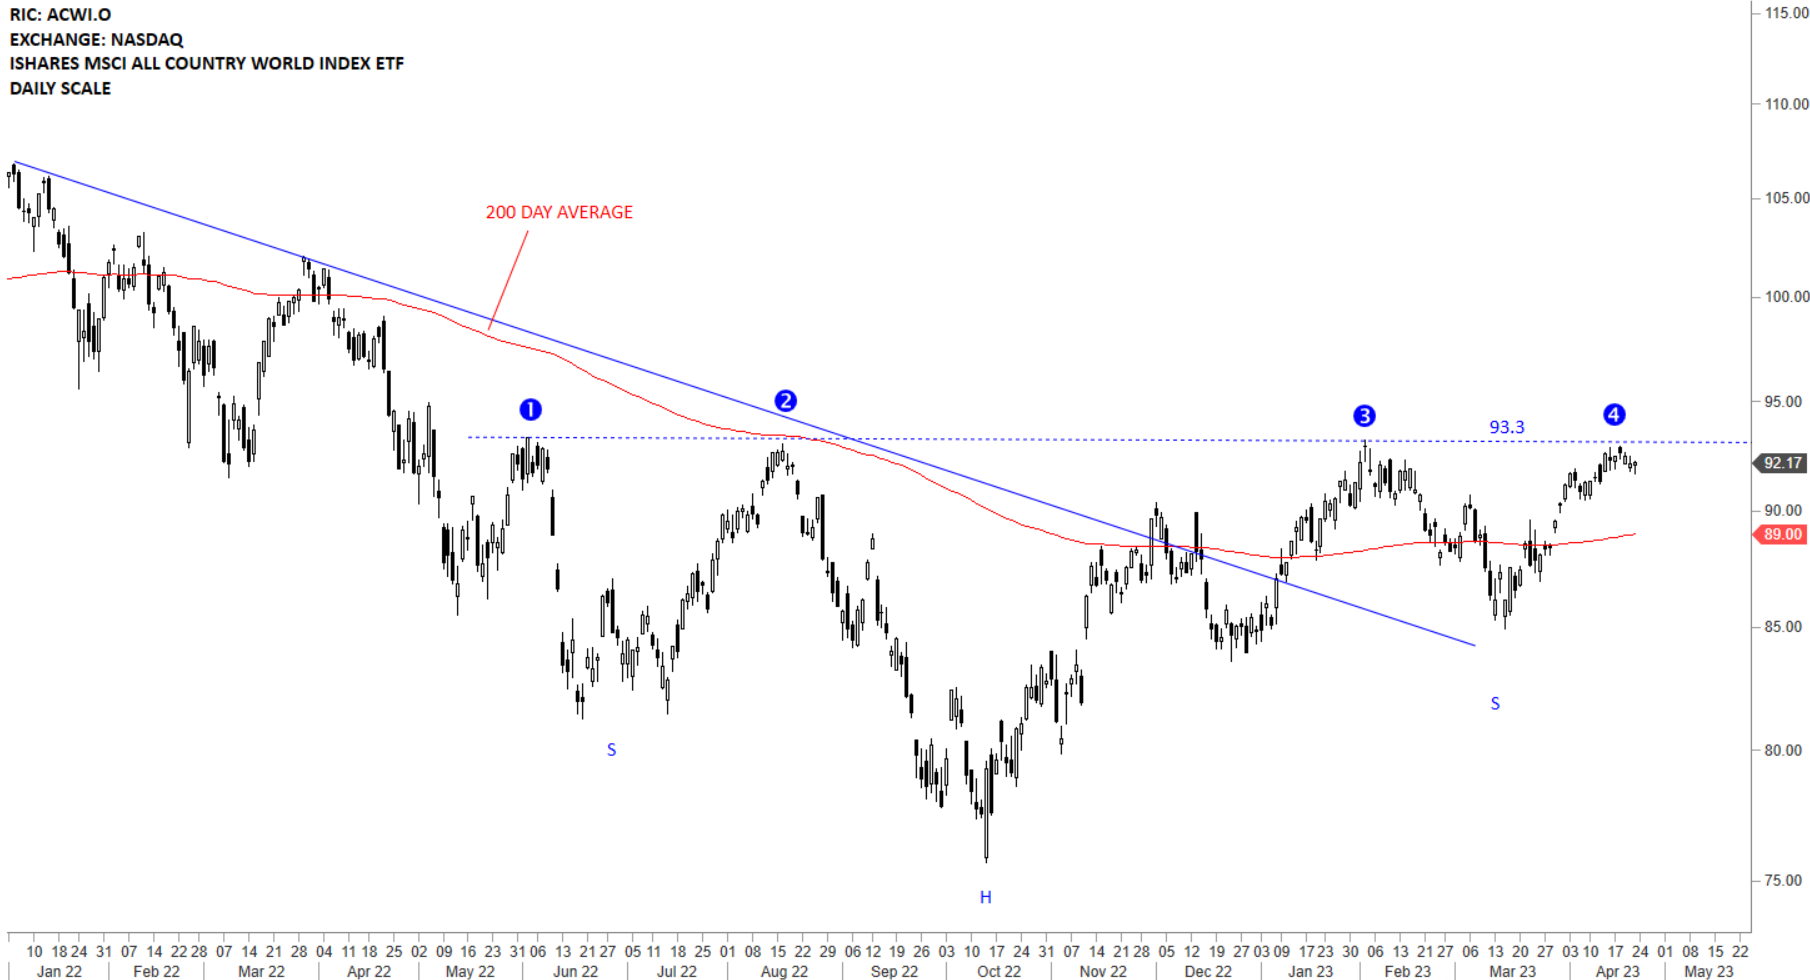
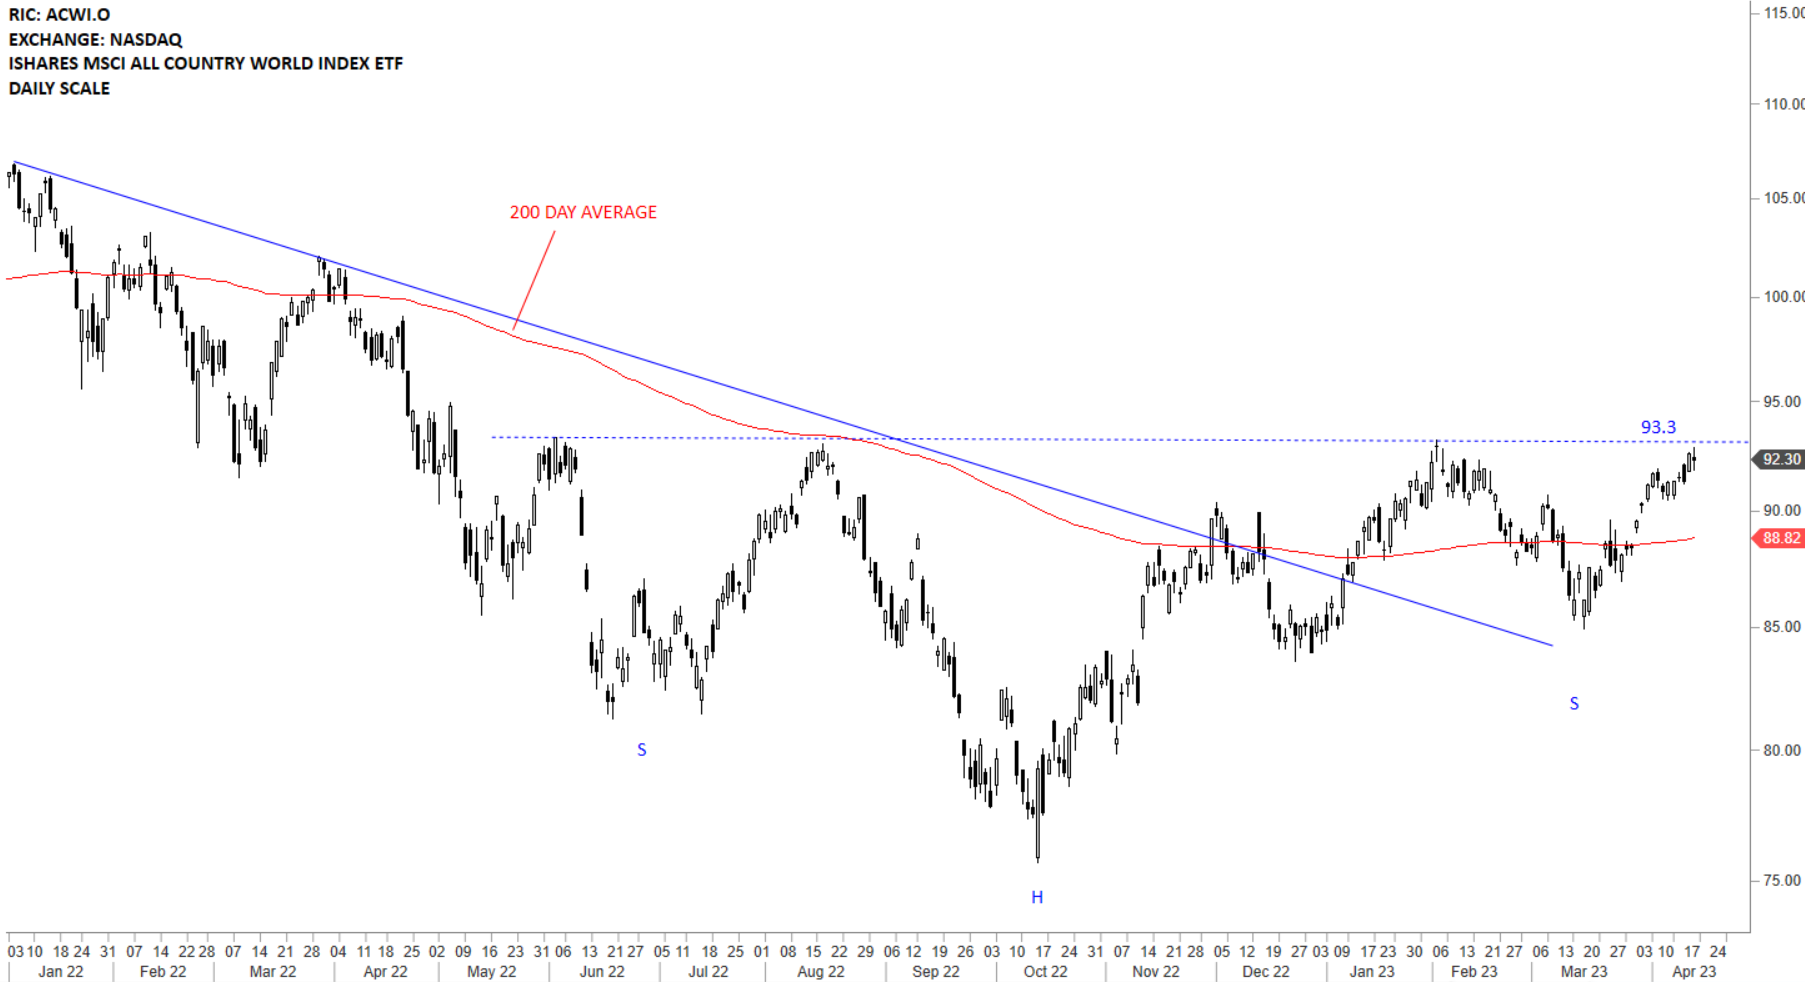
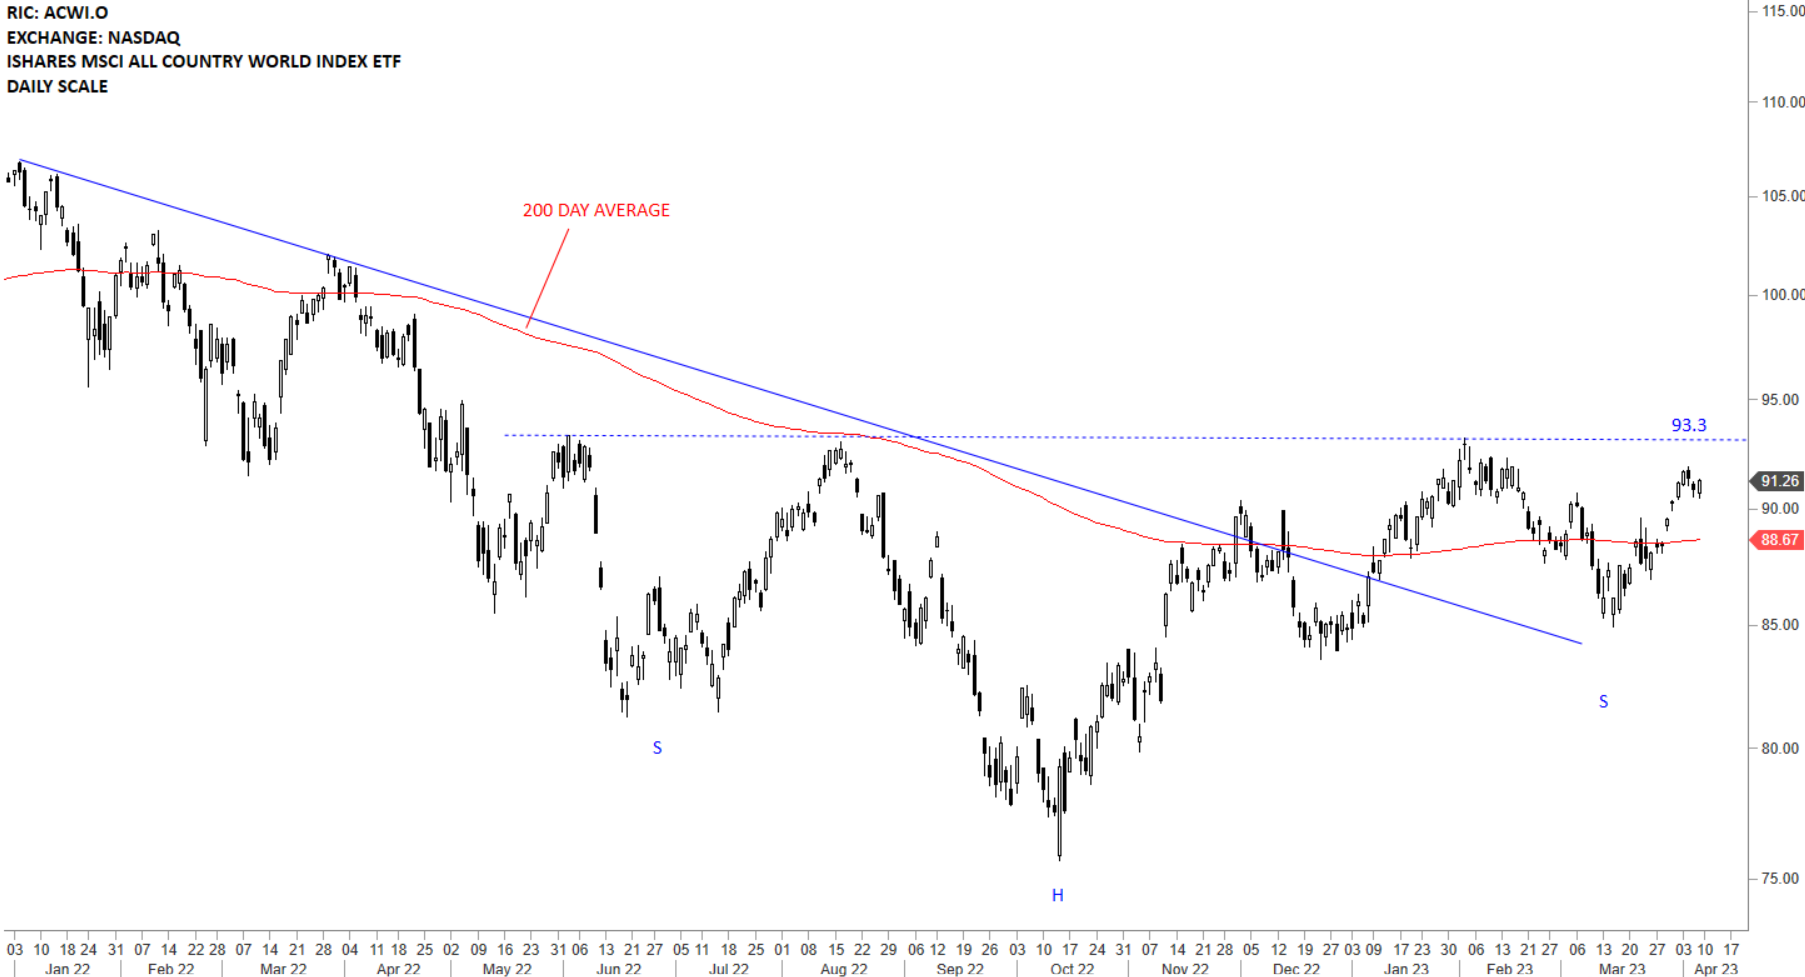
The benchmark for the Global equity markets performance, the iShares MSCI All Country World Index ETF (ACWI.O) remains below its 200-day average and the minor low at 91.7 levels. The 200-day average is currently at 98.5 levels. Breakdown below the minor low resumed the downtrend. 91.7 levels becomes the resistance. The weekly scale price chart formed a long lower shadow with this week’s close and could be the first sign of a short-term bottom. There is no clear bottom reversal chart pattern on daily and weekly scale price charts.

Read more

CRYPTOCURRENCIES – May 9, 2022

The last report on cryptocurrencies read make or break week for many crypto pairs. So many chart were at inflection points. These was a bullish case to be made if right shoulders developed on chart. On the other hand if they failed, there were many chart that were waiting to break down well-defined horizontal supports. Right shoulders never developed and many horizontal setups broke down. Charts below are an update on those developing downtrends and also additional fresh setups.


Read more

PHILLIPS 66 (PSX)

Every week Tech Charts Global Equity Markets report features some of the well-defined, mature classical chart patterns under a lengthy watchlist and the chart pattern breakout signals that took place during that week. Global Equity Markets report covers single stocks from developed, emerging and frontier markets, ETF’s, select commodities, cryptocurrencies and global equity indices. Below chart is from the watchlist section of the weekly report. It is featuring the head and shoulder continuation chart pattern on Phillips 66 listed on the New York Stock Exchange.

PHILLIPS 66 (PSX)

Phillips 66 is an energy manufacturing and logistics company with midstream, chemicals, refining, and marketing and specialties businesses. The stock is listed on the New York Stock Exchange. Price chart formed a year-long head and shoulder continuation with the horizontal boundary acting as strong resistance at 93.90 levels. The horizontal boundary was tested several times over the course of the chart pattern. A daily close above 96.70 levels will confirm the breakout from the year-long head and shoulder continuation with the possible chart pattern price target of 121.00 levels. Friday’s price action was borderline breakout. I will monitor this name for another day of strength to confirm the breakout.


Tech Charts Membership

By becoming a Premium Member, you’ll be able to improve your knowledge of the principles of classical charting.

With this knowledge, you can merge them with your investing system. In fact, some investors use my analyses to modify their existing style to invest more efficiently and successfully.

Get Access Now

As a Premium Member of Aksel Kibar’s Tech Charts,

You will receive:

  • Global Equities Report. Delivered weekly.
  • Classical charting principles. Learn patterns and setups.
  • Actionable information. Worldwide indices and stocks of interest.
  • Risk management advice. The important trading points of each chart.
  • Information on breakout opportunities. Identify the ones you want to take action on.
  • Video tutorials. How patterns form and why they succeed or fail.
  • Watch list alerts. As they become available so you can act quickly.
  • Breakout alerts. Usually once a week.
  • Access to everything (now and as it becomes available)
    o Reports
    o Videos and video series
  • Multi-part webinar course. You learn the 8 most common charting principles.
  • Webinars. Actionable and timely advice on breaking out chart patterns.

For your convenience your membership auto renews each year.

Get Access Now

GLOBAL EQUITY MARKETS – May 7, 2022

REVIEW


The benchmark for the Global equity markets performance, the iShares MSCI All Country World Index ETF (ACWI.O) remains below its 200-day average. To get bullish on Global Equities, I want to see the ETF clearing the 200-day average and settling above it. Until that happens I will view this as part of larger scale complex correction. The 200-day average is currently at 99.2 levels. Breakdown below the lows can result in a continuation of the downtrend. This week the ETF closed below the minor low at 91.7. Unless we see a sharp reversal with a long white daily candle that closes above 91.7, I will expect continuation of the downtrend. A sharp reversal can result in a rebound towards the 200-day average.

Read more

GLOBAL EQUITY MARKETS – April 30, 2022

REVIEW


The benchmark for the Global equity markets performance, the iShares MSCI All Country World Index ETF (ACWI.O) remains below its 200-day average. To get bullish on Global Equities, I want to see the ETF clearing the 200-day average and settling above it. Until that happens I will view this as part of larger scale complex correction. The 200-day average is currently at 99.7 levels. The ETF failed to form the right shoulder of a possible reversal which led the price to test the previous lows at 91.7 levels. Breakdown below the lows can result in a continuation of the downtrend. On the weekly scale chart, price is inside the channel and also clearly below the long-term average, exposing the ETF to further downside if the minor lows are broken down.

Read more

CRYPTOCURRENCIES – April 24, 2022

As I go through several cryptocurrency pairs I’m seeing many at inflection points. Inflection point is a level right before a major shift in demand and supply and as a result followed by a trend period. I’m not sure if we are going to see a strong uptrend or a downtrend in the crypto space. However, below chart will offer a good game plan whichever direction markets move in the coming weeks.

Read more

GLOBAL EQUITY MARKETS – April 23, 2022

REVIEW


The benchmark for the Global equity markets performance, the iShares MSCI All Country World Index ETF (ACWI.O) once again fell below its 200-day average. To get bullish on Global Equities, I want to see the ETF clearing the 200-day average and settling above it. Until that happens I will view this as a counter trend rebound. We can see more sideways consolidation around the 200-day average until the index finds direction. The 200-day average is currently at 100 levels. The bullish case would be the formation of a H&S bottom reversal with the right shoulder being in progress. I would give few more days for the ETF to prove the bullish thesis wrong. An upward move towards 100-101.7 area will increase my confidence on the H&S bottom reversal development. Failure to form a right shoulder and continued weakness will establish the downtrend below the 200-day average for the coming months.

Read more

GLOBAL EQUITY MARKETS – April 16, 2022

REVIEW


The benchmark for the Global equity markets performance, the iShares MSCI All Country World Index ETF (ACWI.O) is consolidating around its 200-day average. To get bullish on Global Equities, I want to see the ETF clearing the 200-day average and settling above it. Until that happens I will view this as a counter trend rebound. We can see more sideways consolidation around the 200-day average until the index finds direction. The 200-day average is currently at 100 levels. The bullish case would be the formation of a H&S bottom reversal with the right shoulder being in progress. An upward move towards 100-101.7 area will increase my confidence on the H&S bottom reversal development.

Read more