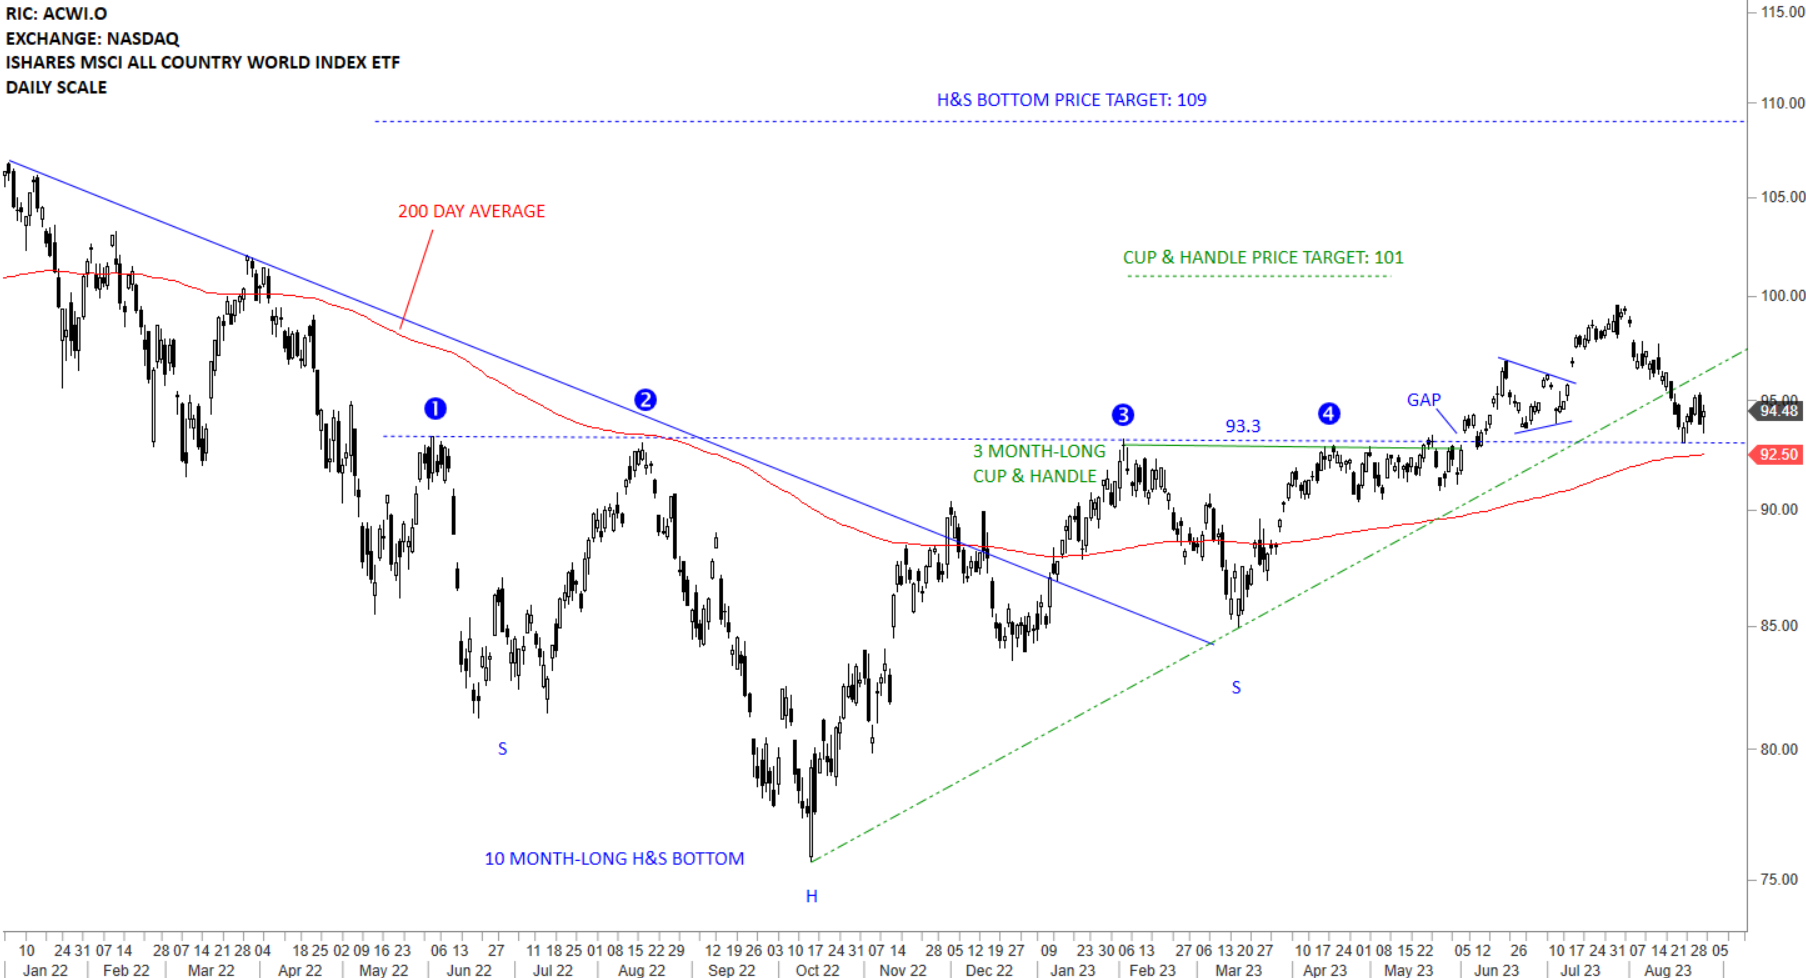
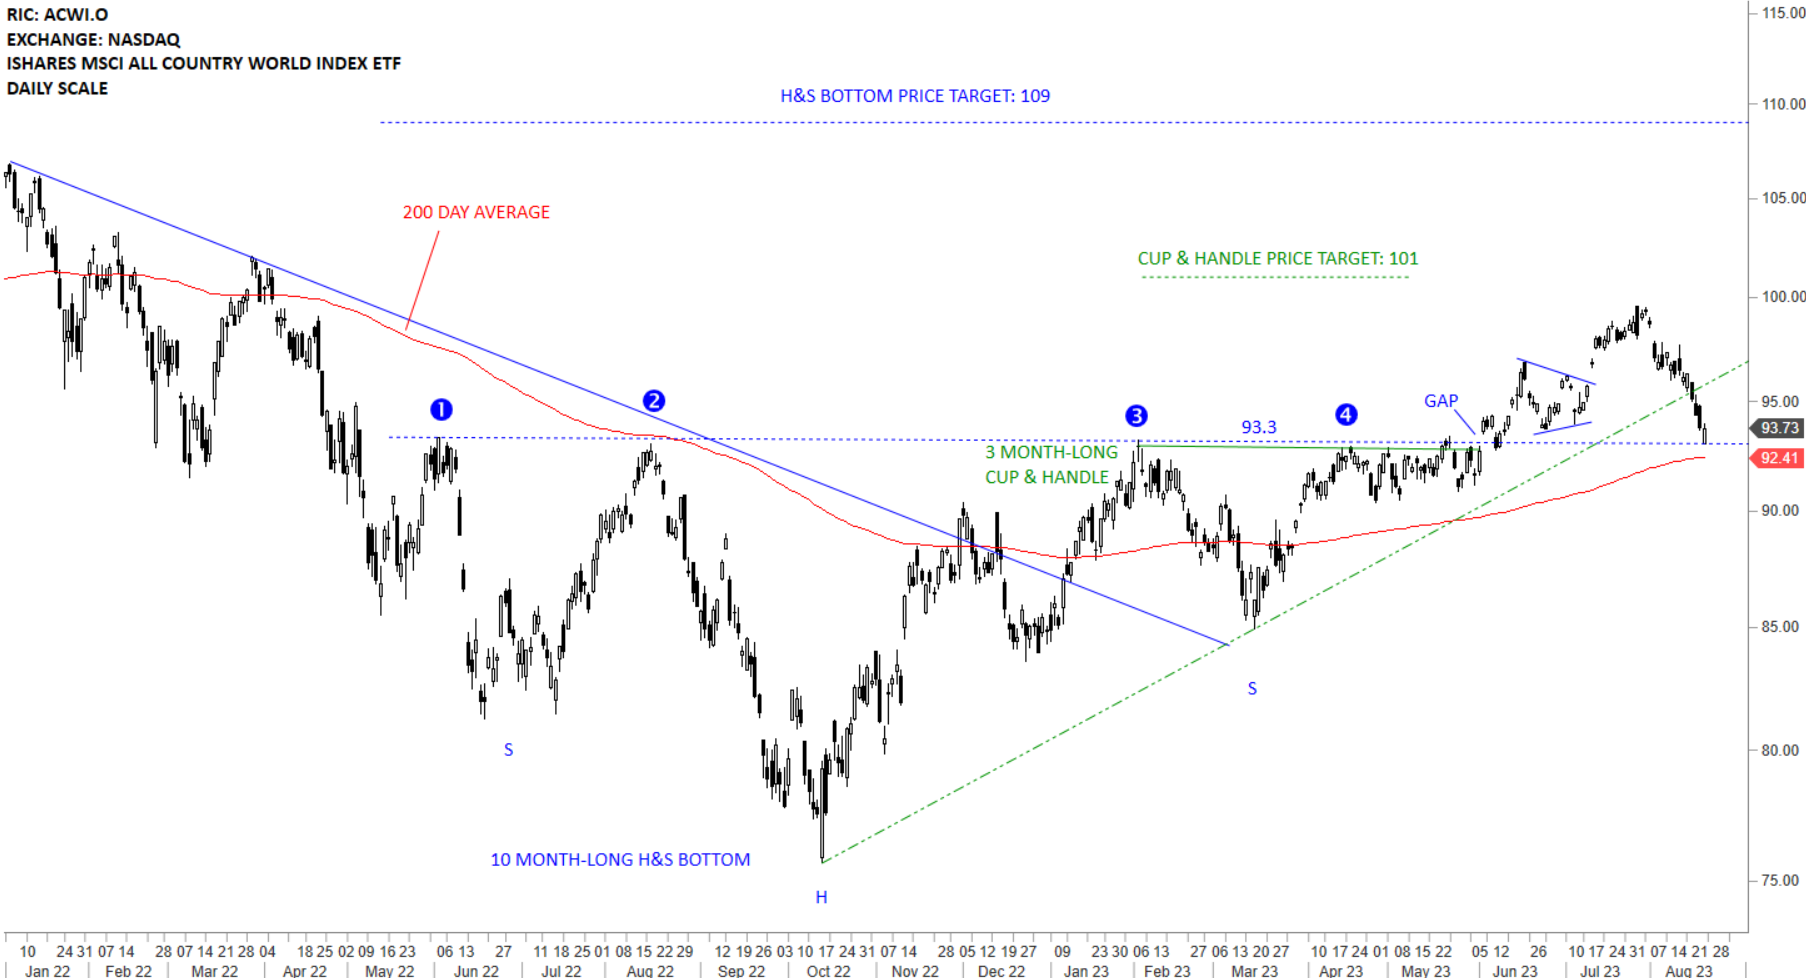
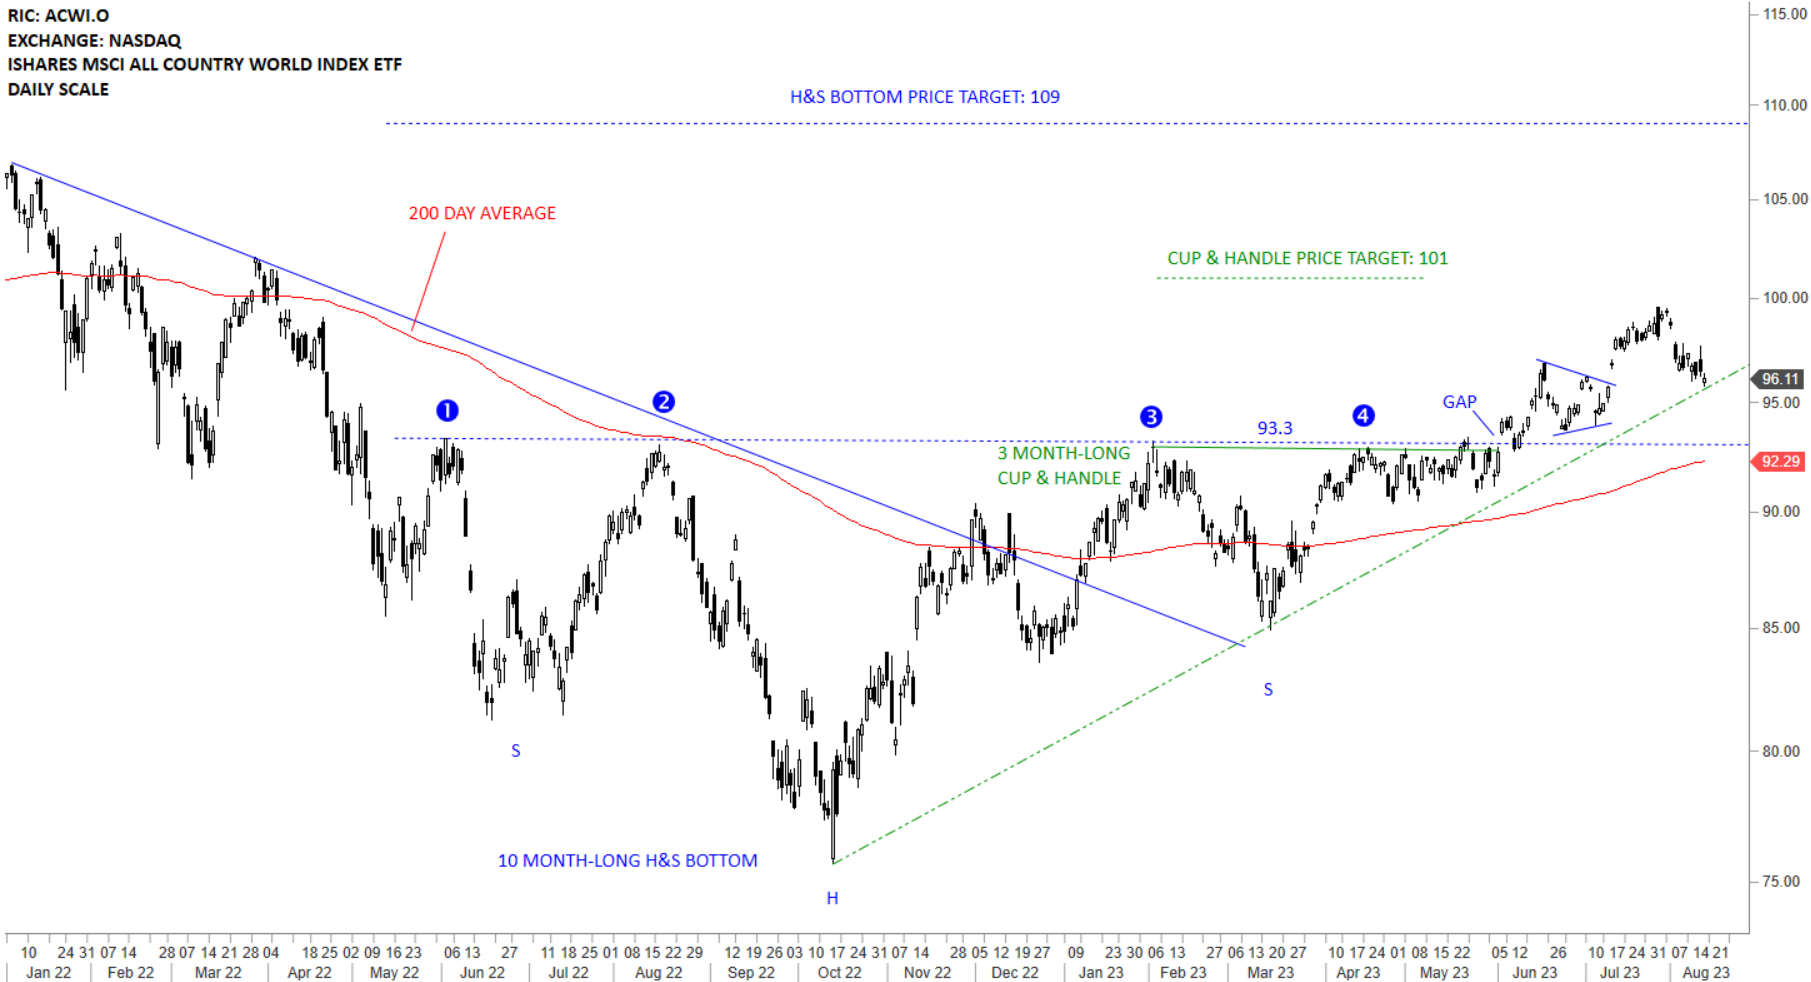
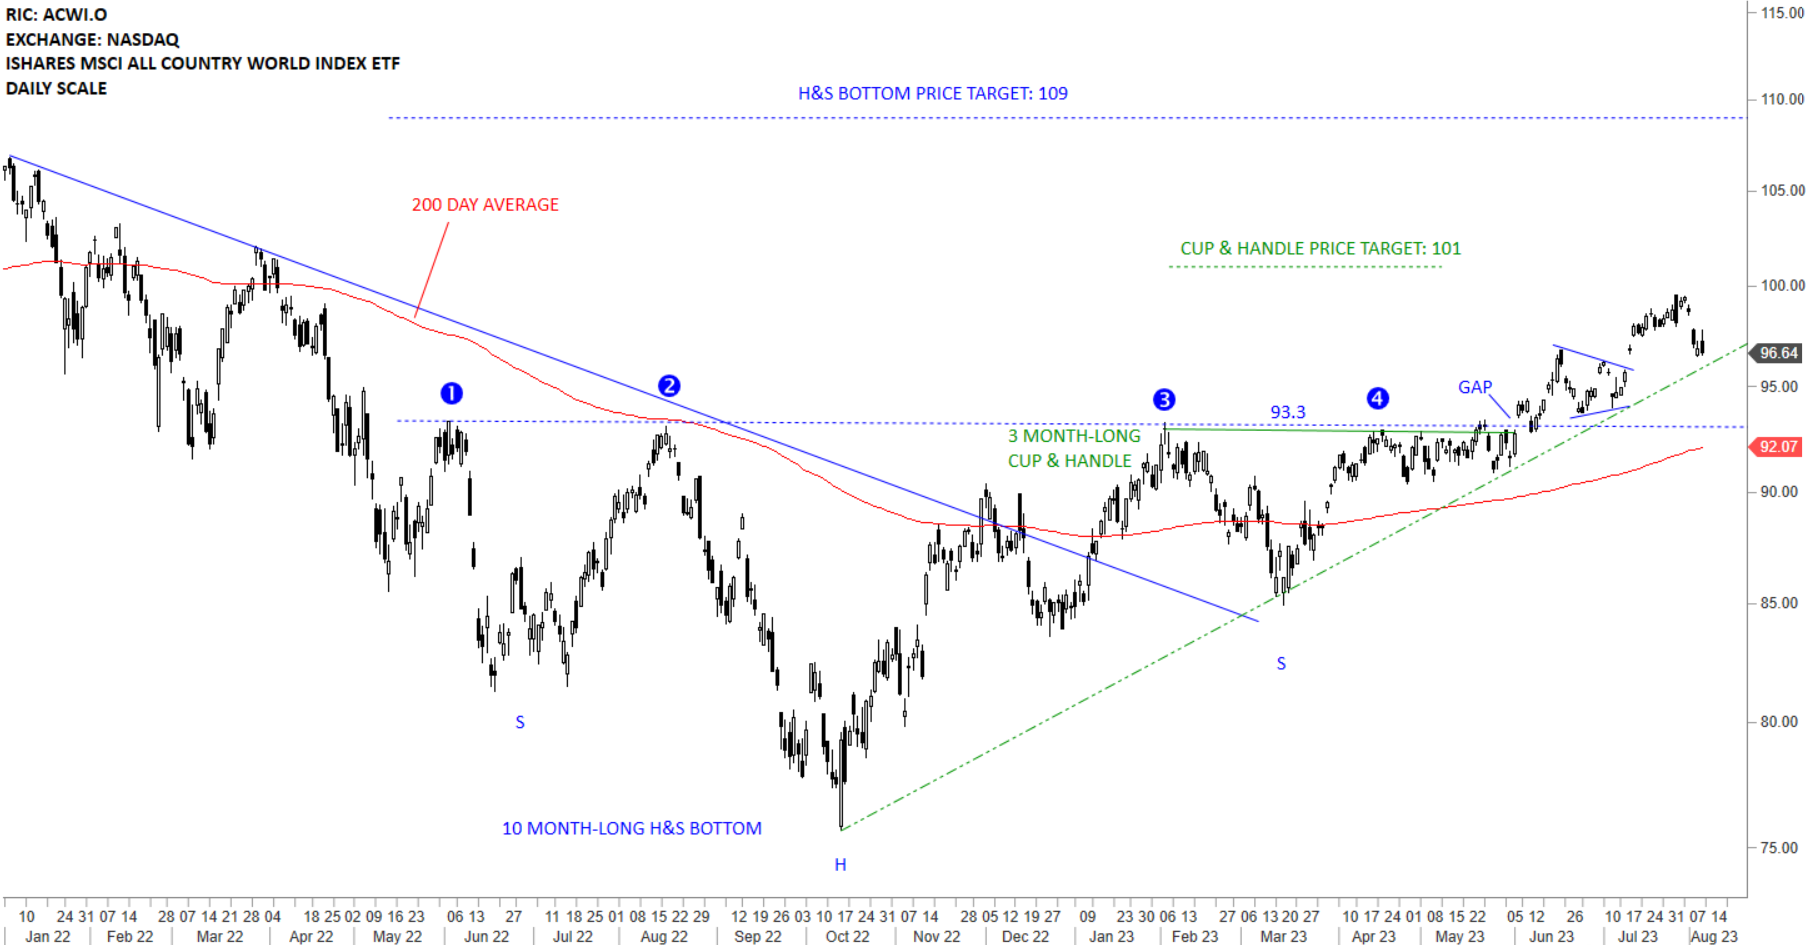
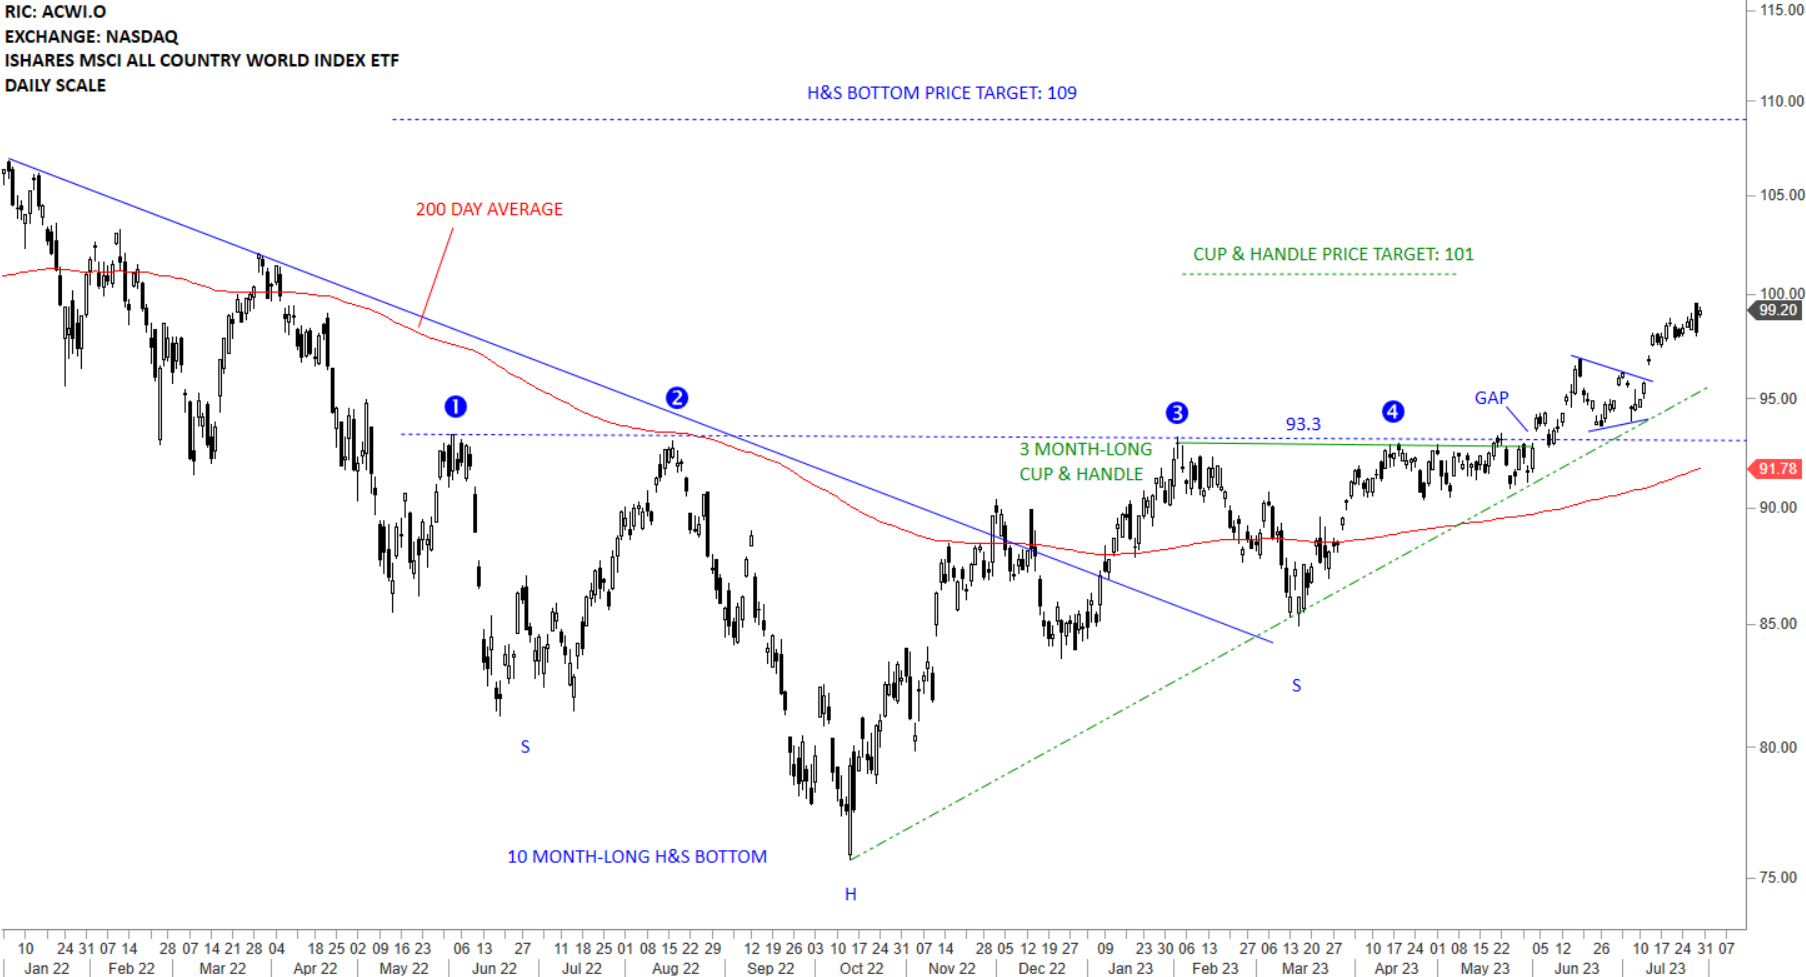
200 DAY MOVING AVERAGE & CHART PATTERNS

Chart patterns do not form frequently on price charts. If you find yourself looking for a chart pattern on a specific chart of your interest, pause for a second and remind yourself that the longer you search for a pattern the higher the chances that you will see some sort of a pattern that actually is not a valid pattern.

How do we overcome this “over-analysis”? We set certain criteria before we even start looking for chart patterns.

Read more

RECAP OF INTERACTIVE CONTENT

Dear Tech Charts Blog followers,

Over the past few weeks I started putting out those interactive charts and videos that met great interest from classical charting enthusiasts. I’ve been thinking of ways to improve your learning experience. I realized that many who are interested in charts and technical analysis want feedback on their input and also test their knowledge. Interactive content is the best way to do this. It is almost like one on one lecture/tutoring.

I will continue to add more interactive content and possibly make this an ongoing educational platform for our members.

Here is a recap of the last 3 public posts/videos I created for our followers.

SYMMETRICAL, ASCENDING & DESCENDING TRIANGLES

H&S CONTINUATION PATTERN

CANDLESTICK PATTERNS AT SUPPORT & RESISTANCE


Tech Charts Membership

By becoming a Premium Member, you’ll be able to improve your knowledge of the principles of classical charting.

With this knowledge, you can merge them with your investing system. In fact, some investors use my analyses to modify their existing style to invest more efficiently and successfully.

Get Access Now

As a Premium Member of Aksel Kibar’s Tech Charts,

You will receive:

  • Global Equities Report. Delivered weekly.
  • Classical charting principles. Learn patterns and setups.
  • Actionable information. Worldwide indices and stocks of interest.
  • Risk management advice. The important trading points of each chart.
  • Information on breakout opportunities. Identify the ones you want to take action on.
  • Video tutorials. How patterns form and why they succeed or fail.
  • Watch list alerts. As they become available so you can act quickly.
  • Breakout alerts. Usually once a week.
  • Access to everything (now and as it becomes available)
    o Reports
    o Videos and video series
  • Multi-part webinar course. You learn the 8 most common charting principles.
  • Webinars. Actionable and timely advice on breaking out chart patterns.

For your convenience your membership auto renews each year.

Get Access Now

Review of Chart Pattern Reliability Statistics and Opportunities in Global Markets – September 2022 Tech Charts Webinar

Review of Chart Pattern Reliability Statistics and Opportunities in Global Markets – September 2022 Tech Charts Webinar

We are continuing our Member webinar series with chart pattern reliability and how the latest market conditions have impacted success rates on different chart patterns. We plan to have an interactive session and an open discussion to answer members’ questions on different markets and specific charts of interest.

Webinar Outline

  • Review of chart pattern statistics and discussion on chart pattern reliability covering the third quarter of 2022
  • Review of global equity markets and latest opportunities
  • Review of cryptocurrencies and latest opportunities
  • Open discussion answering member’s questions on different markets and specific charts they want to discuss
  • Education/analysis of fine points on classical charting as we go through different charts/questions

Live questions from Members

  1. India has been in a sideways movement for a year. I know you’ve featured a bunch of names from here. Do you see this EM as an outlier of strength amongst most EMs? 48:45
  2. I have been looking at the crypto ticker XLM/USD and XLM/BTC. It seems to be setting up a strong bottom. 49:39
  3. I see you use MetaStock. Is there any specific reason? 51:08 (LINK for MetaStock)
  4. Do you only trade the chart patterns? Do you wait for the confirmation for the price close? What do you do when closing diminishes the Risk reward relationship? 52:14
  5. Would you be able to give me a stop loss (as you would use) for your India positions? 53:20
  6. Can you go over the breakout setup in NOC? 55:06 (LINK ATR TRAILING STOP-LOSS
  7. How important is EEM nowadays? Isn’t it mostly made up of China tech? Isn’t it better to look at individual EM ETFs rather than EEM? 57:05
  8. In your weekly report for some index or stocks, you are using DEMA200 or DSMA200. It’s a bit confusing which one to use. 57:43
  9. Yen had a crazy day today. 58:03
  10. Your thoughts on the continuing strength of the U S Dollar & its effect globally? 58:05
  11. Could you give us your view on EWZ (brazil) and also an update on NIKKEI? It looks like a bull trap confirmed above the rectangle breakout. 59:38
  12. Can you summarize any charts that look bullish? Everything seems bearish. 01:01:43
  13. Can you please chart BBBY on daily? Is that a falling wedge from 8/17 to the present day? 01:02:08
  14. How do you trade Turkey ETF? On a USD or at a TRY base? 01:03:51
  15. On the BBBY monthly, is that a double bottom? 01:05:15

Educational Videos mentioned in this webinar 

Recorded live 09.22.2022 

Read more

SYMMETRICAL, ASCENDING & DESCENDING TRIANGLES

There are three types of triangles covered under the classical charting principles. The symmetrical triangle, ascending triangle and descending triangle. Between those three I favor ascending and descending triangles for couple of reasons. One of them is, both ascending and descending triangles have horizontal boundaries. Breakouts through the horizontal boundaries are the chart pattern signal. The other reason is that, both ascending and descending triangles have directional bias due to their upward and downward sloping lower and upper boundaries. I find symmetrical triangles difficult to trade as price usually finds resistance at the minor highs following the breakout. Pause around minor resistance usually hampers the momentum and can result in more frequent failures.

Let’s analyze the 3 different types of triangles with below interactive charts.

Symmetrical triangle has both boundaries converging towards an apex. It is a neutral chart pattern and doesn’t have a directional bias.

I follow the below template to review weekly scale price charts. The template loads 5 years of data (+/- 250 candles) on the weekly scale price chart. I like to view price action without any indicators and also on white background.

This is how I would draw the boundaries of a symmetrical triangle. I pay attention to several tests of pattern boundary before a breakout takes place. Minimum 3 touches of a chart pattern boundary gives me the confidence that the chart pattern boundary is well-defined and a breakout can trigger a directional movement.

This was a symmetrical triangle reversal that was alerted to Tech Charts members as a symmetrical triangle bottom reversal. Note the 3 touches of the upper boundary and also the sharp pullback that followed the breakout. Minor high acted as resistance and resulted in several weeks of hesitation around the pattern boundary.

This was a symmetrical triangle that acted as a top reversal. You can see the several tests of the lower boundary before the breakdown took place. Note the re-test of the pattern boundary and where the rebound started from; the minor low.


Ascending triangle is a bullish chart pattern. Its upward sloping lower boundary gives the pattern the bullish bias. Buyers are more impatient at every correction, bidding the price at a higher level while sellers defend the same horizontal resistance. Over time the pattern shows the battle between buyers and sellers shifting in favor of buyers. The pattern is completed with a breakout through the horizontal boundary.

I follow the below template to review daily scale price charts. The template loads 1 year of data (+/- 250 candles) on the daily scale price chart. I like to view price action without any indicators and also on white background.

This is how I would draw the boundaries of the ascending triangle. Please note the several tests of the upper boundary before the breakout takes place.

As a bottom reversal, the formation of the ascending triangle can spread over several months. Qualities I look for don’t change. I continue to look for a breakout through the horizontal boundary and also the several tests of the horizontal boundary before the breakout.

Descending triangle is a bearish chart pattern. Its downward sloping upper boundary gives the pattern the bearish bias. Sellers are more impatient at every recovery, pushing the price to a lower level while buyers defend the same horizontal support. Over time the pattern shows the battle between buyers and sellers shifting in favor of sellers. The pattern is completed with a breakdown through the horizontal boundary.

This is how I would draw the descending triangle on the weekly scale price chart of YELP.K. Breakdown took place after the 3 test of the lower boundary.

Given its bearish nature, descending triangle can form as a top reversal and the completion of it would forecast lower prices. High conviction setups are as always those with several tests of the horizontal boundary before a breakdown signal.


Tech Charts Membership

By becoming a Premium Member, you’ll be able to improve your knowledge of the principles of classical charting.

With this knowledge, you can merge them with your investing system. In fact, some investors use my analyses to modify their existing style to invest more efficiently and successfully.

Get Access Now

As a Premium Member of Aksel Kibar’s Tech Charts,

You will receive:

  • Global Equities Report. Delivered weekly.
  • Classical charting principles. Learn patterns and setups.
  • Actionable information. Worldwide indices and stocks of interest.
  • Risk management advice. The important trading points of each chart.
  • Information on breakout opportunities. Identify the ones you want to take action on.
  • Video tutorials. How patterns form and why they succeed or fail.
  • Watch list alerts. As they become available so you can act quickly.
  • Breakout alerts. Usually once a week.
  • Access to everything (now and as it becomes available)
    o Reports
    o Videos and video series
  • Multi-part webinar course. You learn the 8 most common charting principles.
  • Webinars. Actionable and timely advice on breaking out chart patterns.

For your convenience your membership auto renews each year.

Get Access Now

GOLD ($/OUNCE)

Every week Tech Charts Global Equity Markets report features some of the well-defined, mature classical chart patterns under a lengthy watchlist and the chart pattern breakout signals that took place during that week. Global Equity Markets report covers single stocks from developed, emerging and frontier markets, ETF’s, select commodities, cryptocurrencies and global equity indices. Below chart is from the review section of the weekly report. It is featuring a possible double top reversal on the weekly & monthly scale price charts of GOLD.

I have been categorizing Double Top and Double Bottom as rectangle. This is to reduce the confusion on terminology. Today I look at the Double Top description of Richard W. Schabacker in his book Technical Analysis and Stock Market Profits.

Image

According to Schabacker a Double Top should have these qualities for correct labelling:

  • High volume around same level at both peaks
  • No less than 20% drop in price from peak to neckline
  • Peaks several weeks apart
  • Double top appearing after a lengthy uptrend

Let’s have a look at more detailed explanation from his book.


Image


According to him, more important than volume pattern, the depth of the pattern impacts the correct labelling of the chart pattern.


Image


Here is a chart he used to explain a typical double top chart pattern.

Image


Looking at the chart pattern development on GOLD, the labelling can fit the definition of a Double Top.

Image

Coverage on Gold from September 24, 2022 Global Equity Markets report:

Gold might be completing a rectangle/double top on the monthly scale price charts. Daily close below 1,630 levels will confirm the breakdown and suggest lower levels in the coming months. Low volatility condition on monthly scale price chart is similar to 2013 and 2019 consolidations. Each one of those was followed by strong directional movement. If the pattern completes on the downside with a long monthly candle, I will expect the directional move continue towards 1,400 levels. 1,680 levels becomes the new resistance. A sharp reversal above 1,680 levels can change the negative outlook to neutral.


Tech Charts Membership

By becoming a Premium Member, you’ll be able to improve your knowledge of the principles of classical charting.

With this knowledge, you can merge them with your investing system. In fact, some investors use my analyses to modify their existing style to invest more efficiently and successfully.

Get Access Now

As a Premium Member of Aksel Kibar’s Tech Charts,

You will receive:

  • Global Equities Report. Delivered weekly.
  • Classical charting principles. Learn patterns and setups.
  • Actionable information. Worldwide indices and stocks of interest.
  • Risk management advice. The important trading points of each chart.
  • Information on breakout opportunities. Identify the ones you want to take action on.
  • Video tutorials. How patterns form and why they succeed or fail.
  • Watch list alerts. As they become available so you can act quickly.
  • Breakout alerts. Usually once a week.
  • Access to everything (now and as it becomes available)
    o Reports
    o Videos and video series
  • Multi-part webinar course. You learn the 8 most common charting principles.
  • Webinars. Actionable and timely advice on breaking out chart patterns.

For your convenience your membership auto renews each year.

Get Access Now

GLOBAL EQUITY MARKETS – September 24, 2022

REVIEW


The benchmark for the Global equity markets performance, the iShares MSCI All Country World Index ETF (ACWI.O) remains below its 200-day average which is acting as resistance at 91.7 levels. This week’s price action took out the low at 81.4 levels with a gap opening. If the range between 81.4 and 92.7 levels act as bearish rectangle, price target for the downtrend will stand at 72 levels. 81.4 level becomes the new resistance. Recovery above 81.4 levels can result in a failed breakdown.

Read more

Live Webinar and Q&A with Aksel – Thursday, September 22, 8:30 am mountain

Dear Tech Charts Members,

We are continuing our Member webinar series with chart pattern reliability and how the latest market conditions have impacted success rates on different chart patterns. We plan to have an interactive session and an open discussion to answer members’ questions on different markets and specific charts of interest. Please send your charts and questions to aksel@techcharts.net, and I will add them to the webinar discussion points.

Scheduled for: Thursday, September 22, 8:30 am mountain (register below)

Read more

GLOBAL EQUITY MARKETS – September 17, 2022

REVIEW


The benchmark for the Global equity markets performance, the iShares MSCI All Country World Index ETF (ACWI.O) remains below its 200-day average which is acting as resistance at 92.3 levels. I’ve been discussing the possibility of a higher low and a H&S bottom reversal. With right shoulder becoming more and more extended towards the low at 81.4 levels, the probability of a H&S bottom has reduced.   We have a wide trading range between 81.4 and 92.3 levels. Chart pattern is possibly morphing. Short-term support is at 81.4 levels.


Read more

CRYPTOCURRENCIES – September 11, 2022

I’m seeing better defined setups in altcoins than BTC and ETH in the cryptocurrencies. Those altcoins can offer breakouts/breakdowns that can offer trend periods in the coming weeks. In this report we review those setups and the levels for breakouts.
Read more

GLOBAL EQUITY MARKETS – September 10, 2022

REVIEW


The benchmark for the Global equity markets performance, the iShares MSCI All Country World Index ETF (ACWI.O) remains below its 200-day average which is acting as resistance at 92.5 levels. I’ve been discussing the possibility of a higher low and a H&S bottom reversal. For that pattern to become better defined, the right shoulder low must be already in and price needs to rally towards the neckline around 92.7 levels. Failure to do so in the following days can resume the downtrend below the long-term average. We have a wide trading range between 81.4 and 92.5 levels.


Read more