GLOBAL EQUITY MARKETS – March 2, 2024
REVIEW
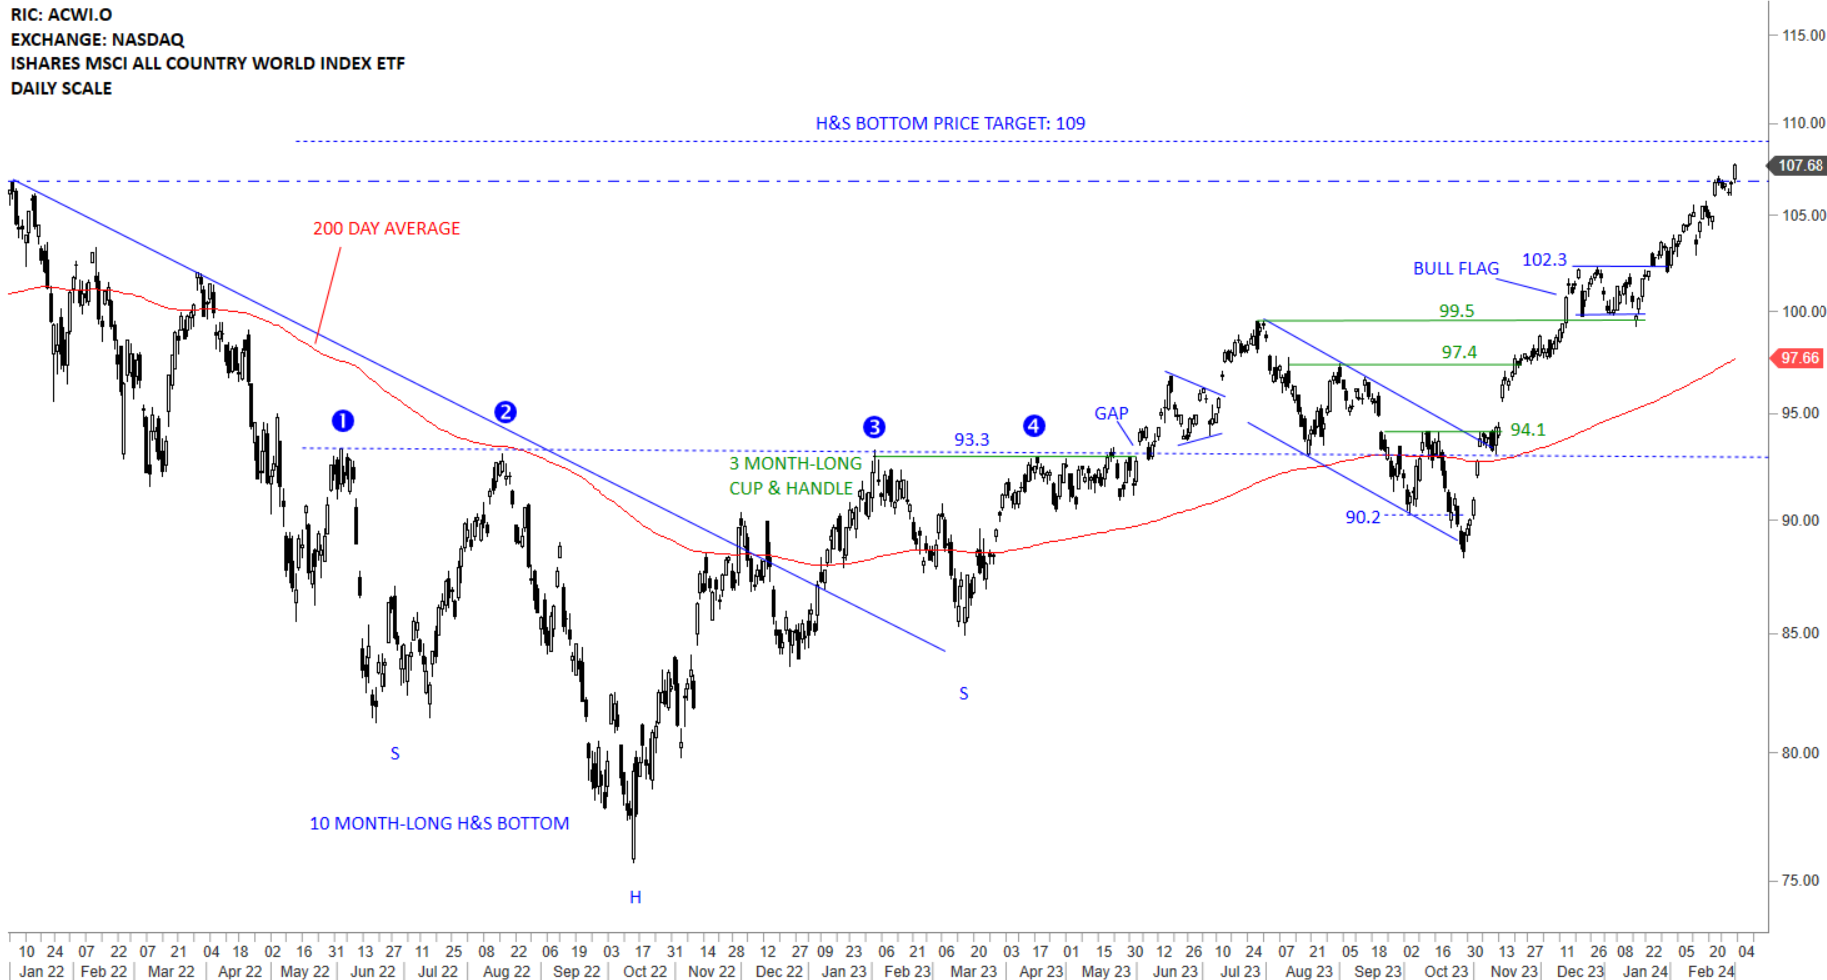
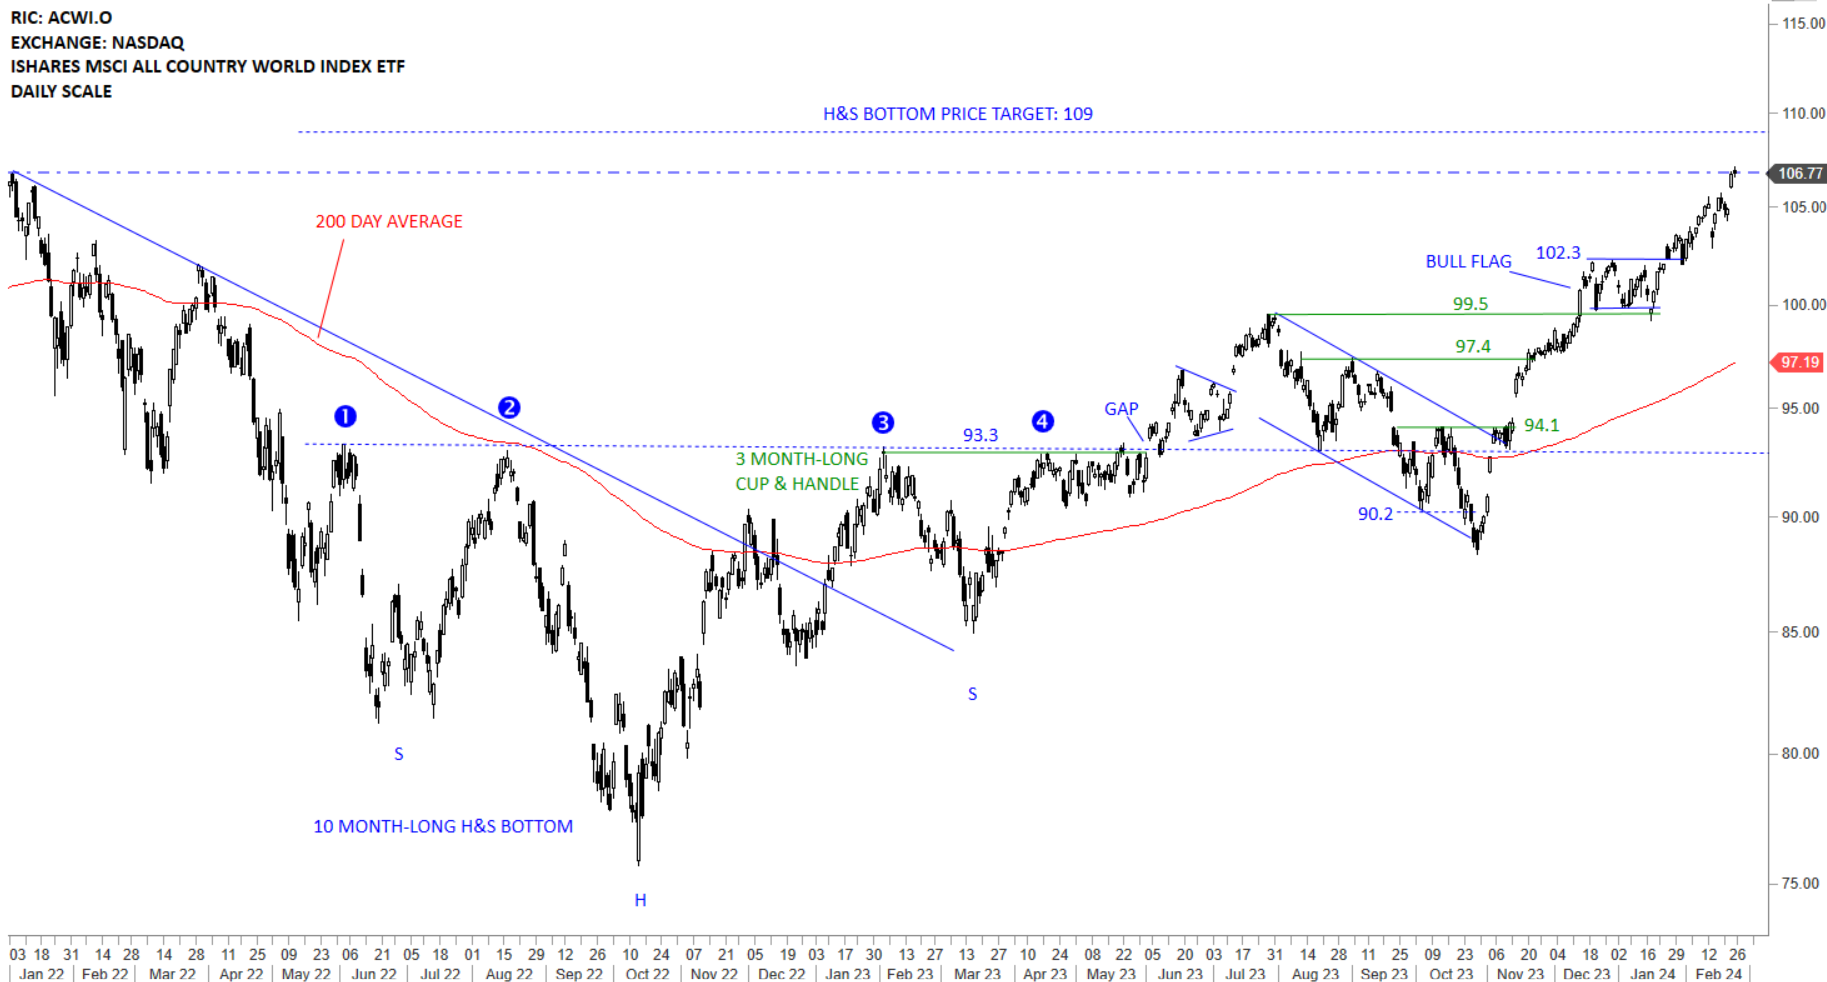
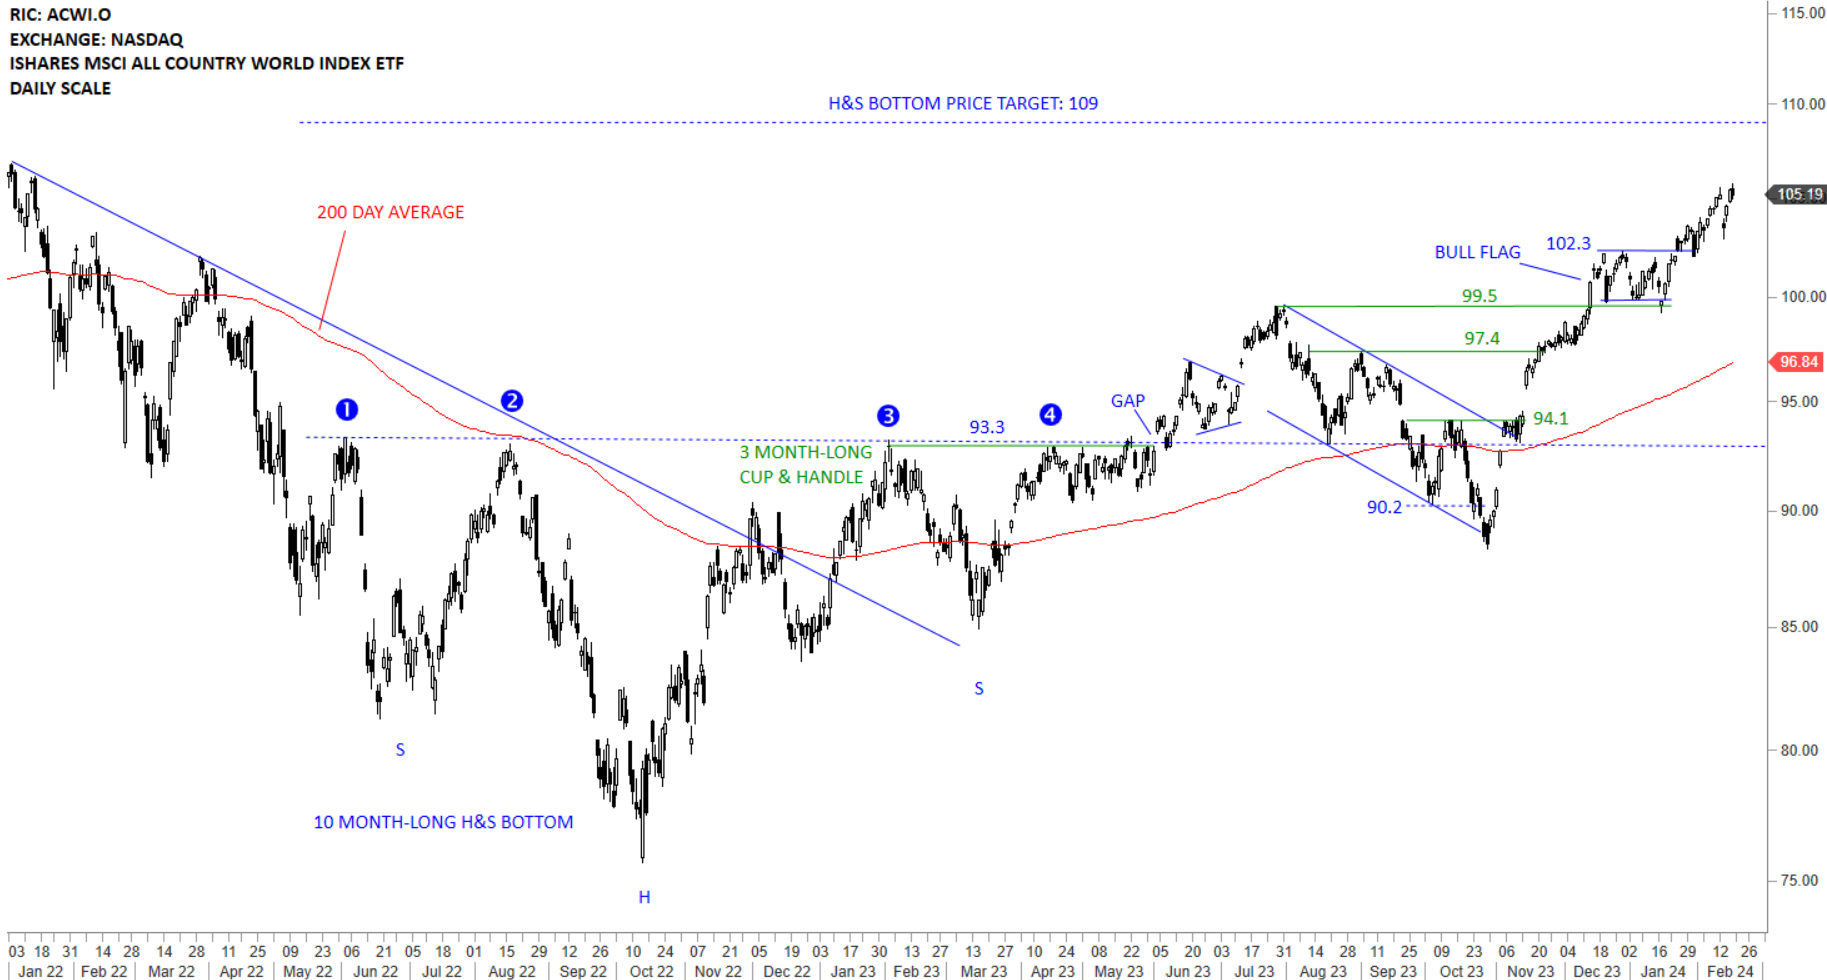
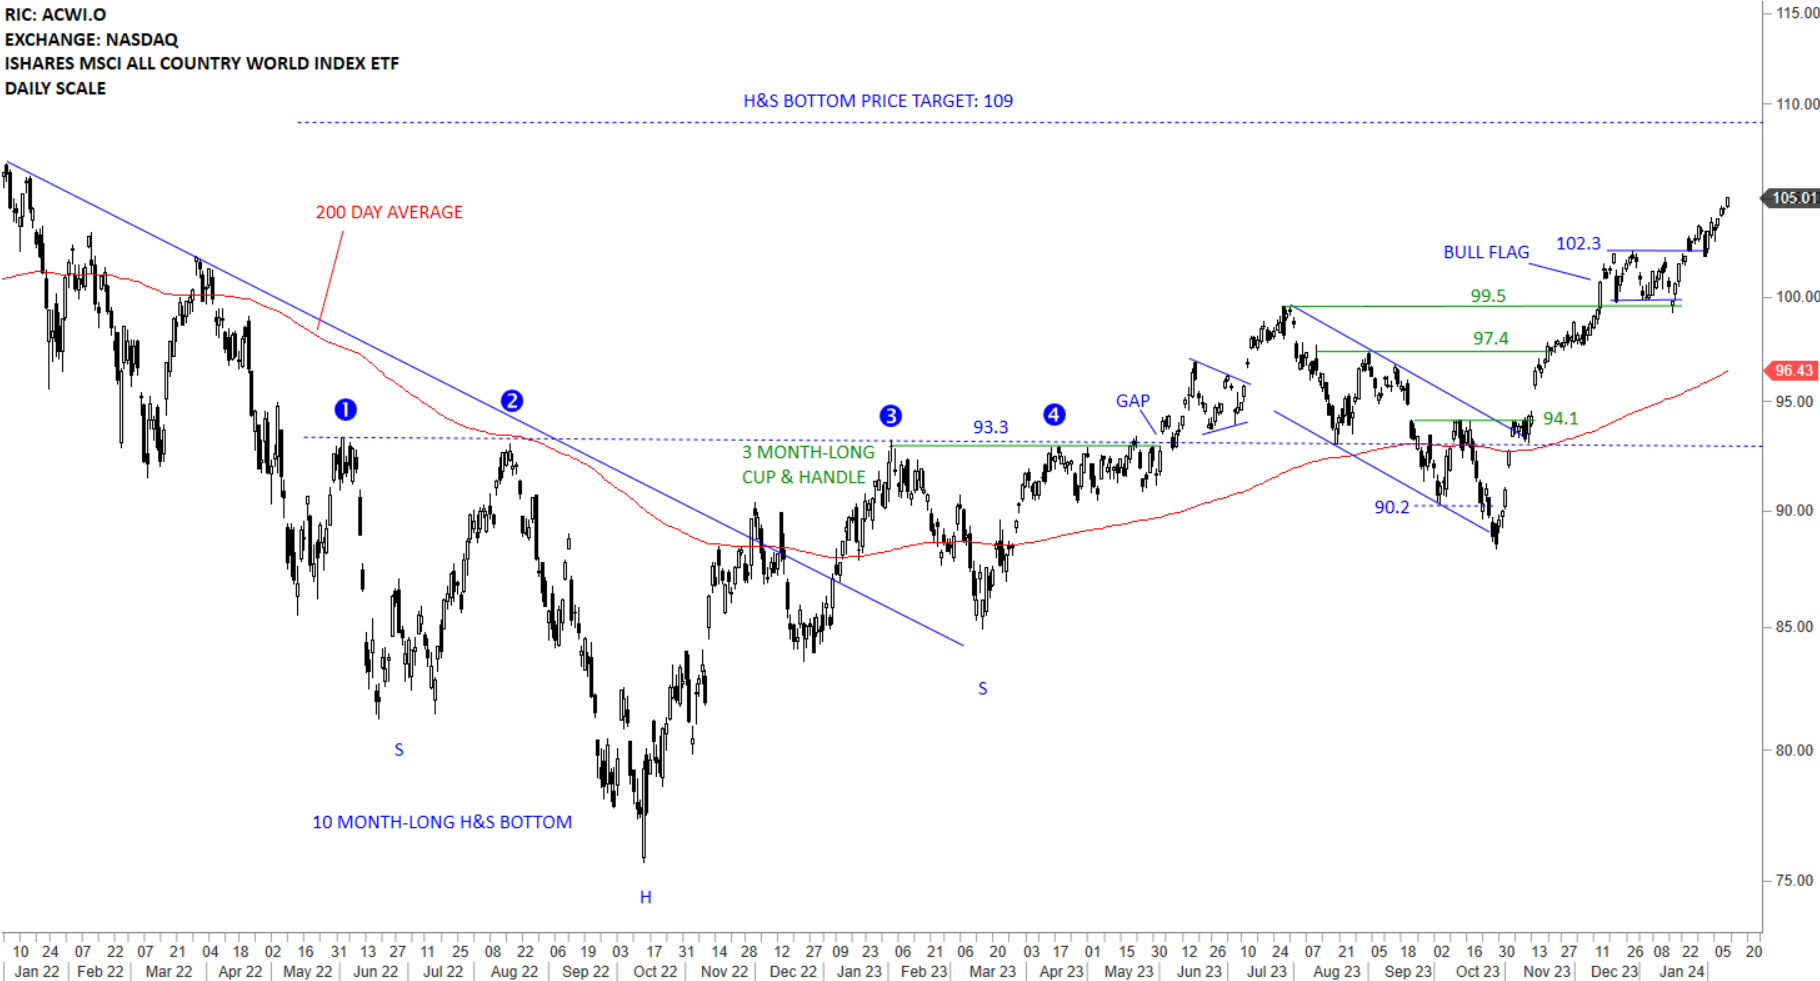
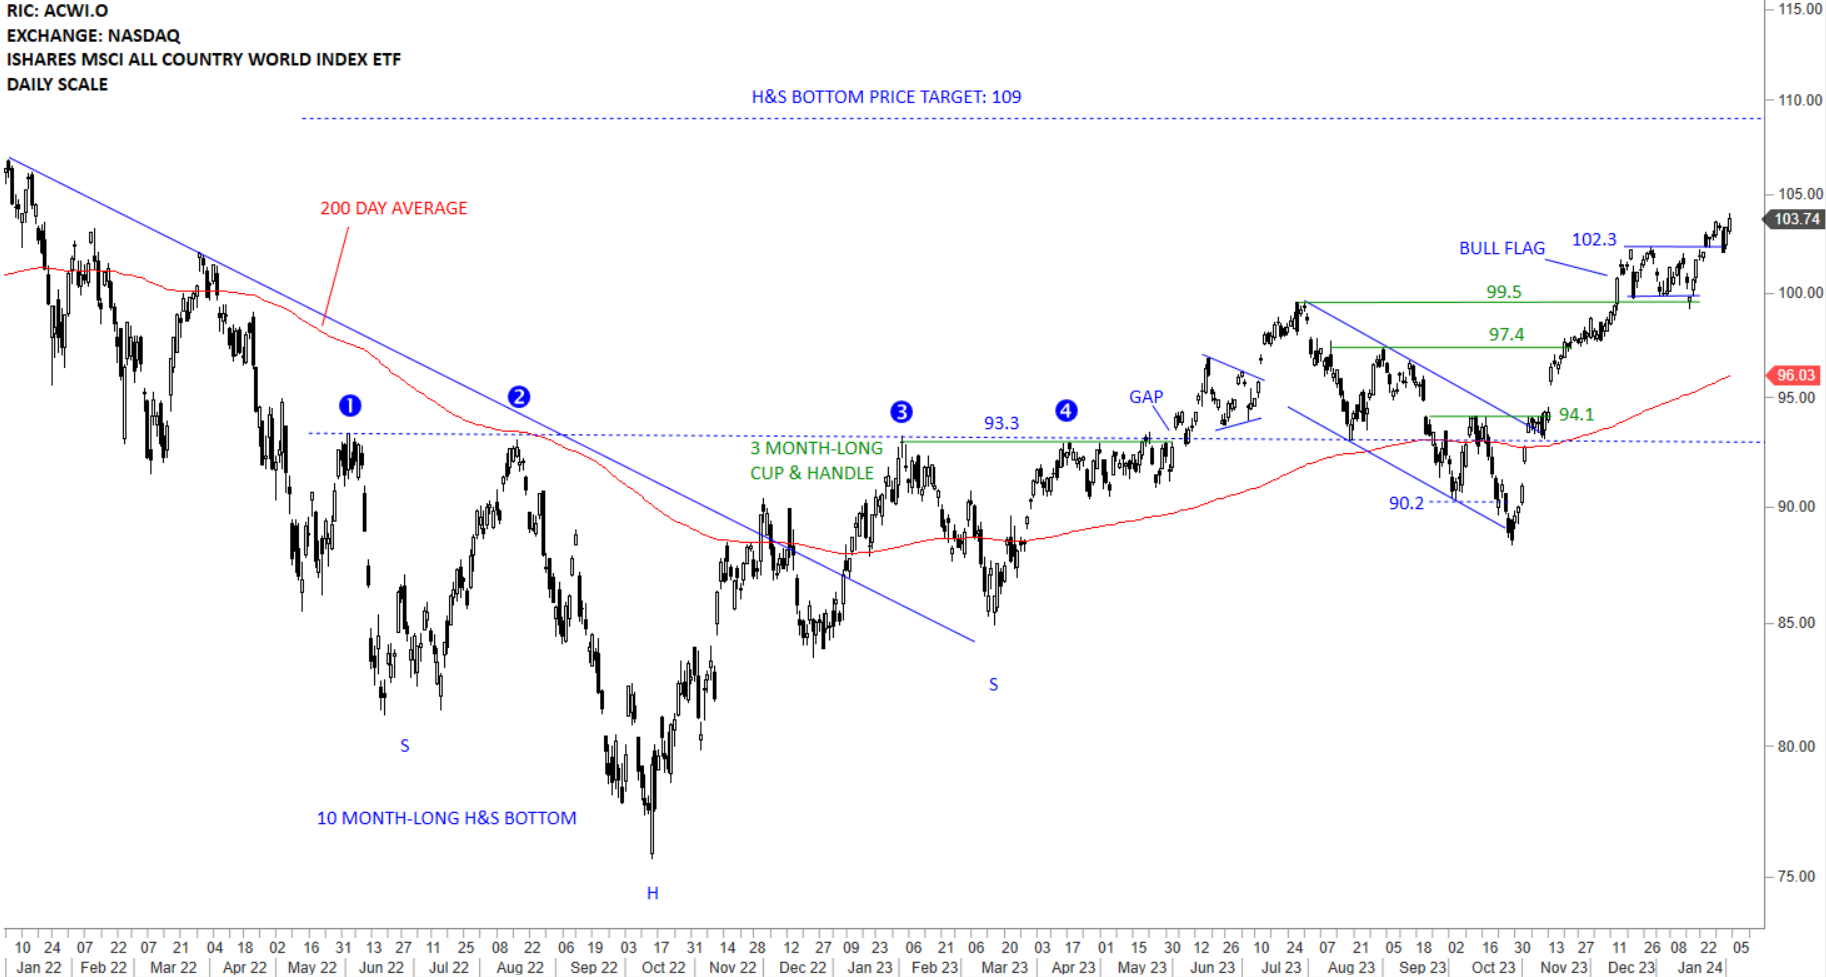
The benchmark for the Global equity markets performance, the iShares MSCI All Country World Index ETF (ACWI.O) is trending towards the long-term H&S bottom price target at 109 levels. The ETF earlier completed a bullish flag which has helped the uptrend resume higher. Global Equity benchmark is now getting closer to a resistance area. 106.8-109 area can act as resistance and pause the existing uptrend. There is no top reversal chart pattern at this stage.