GLOBAL EQUITY MARKETS – May 4, 2024
REVIEW
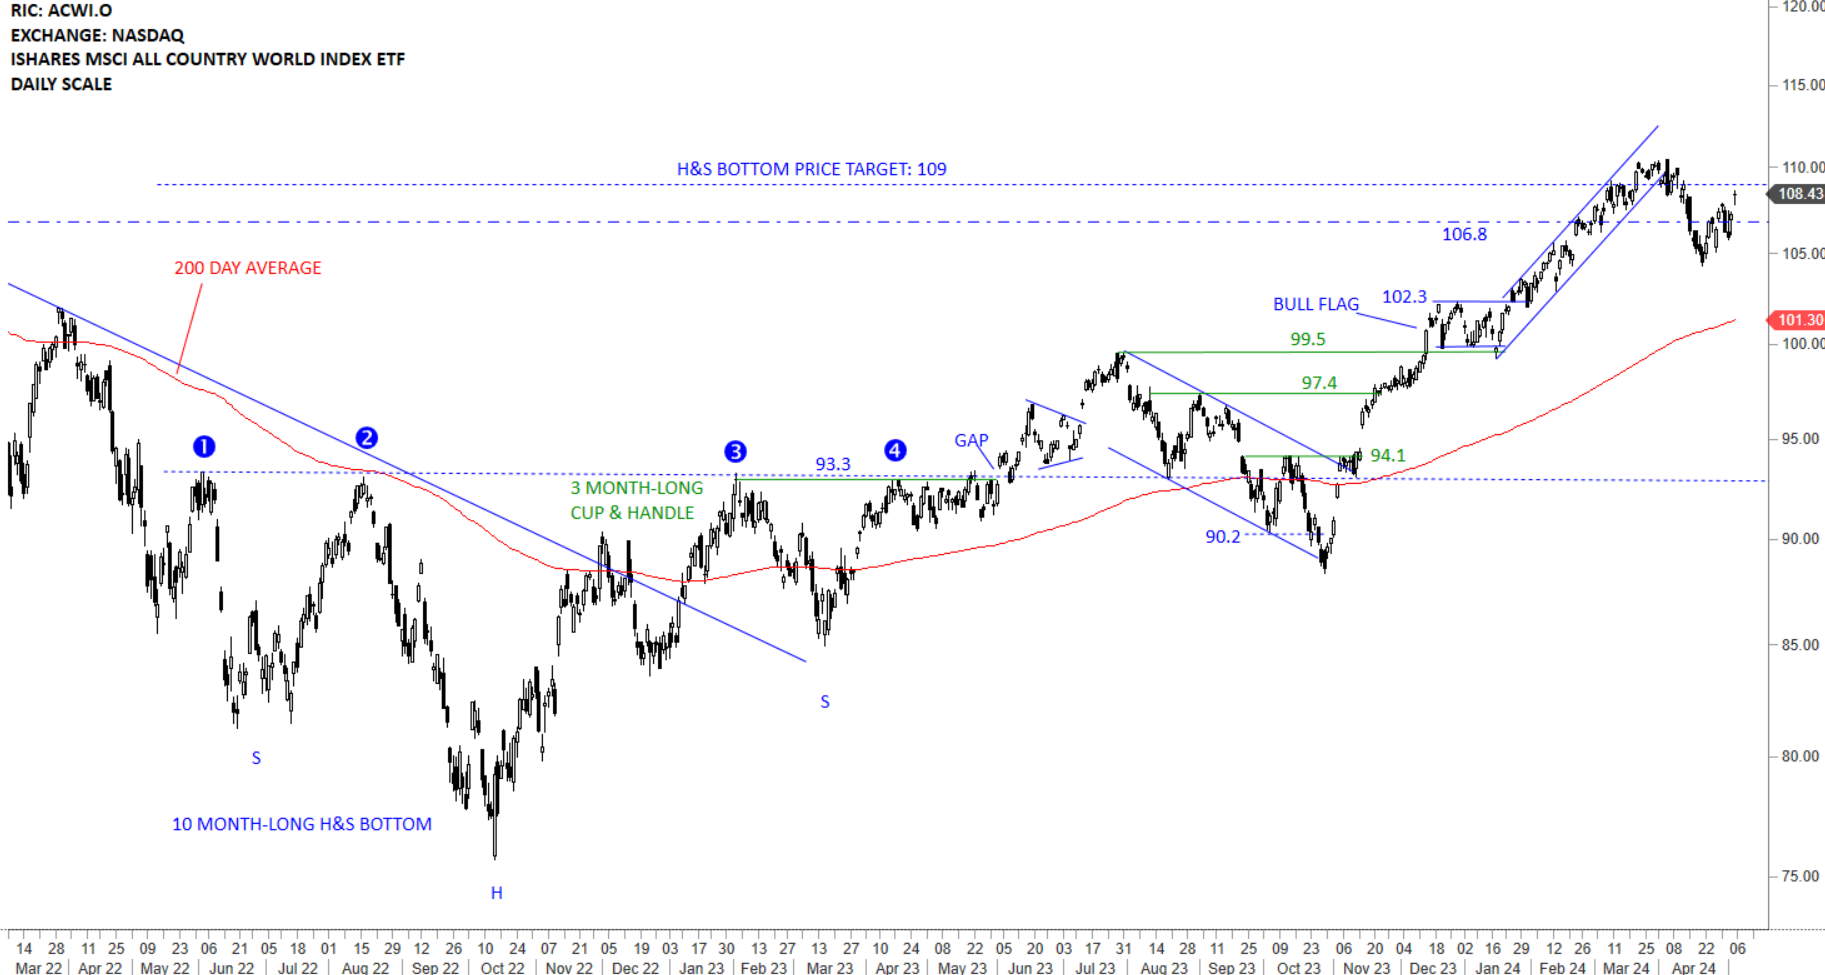
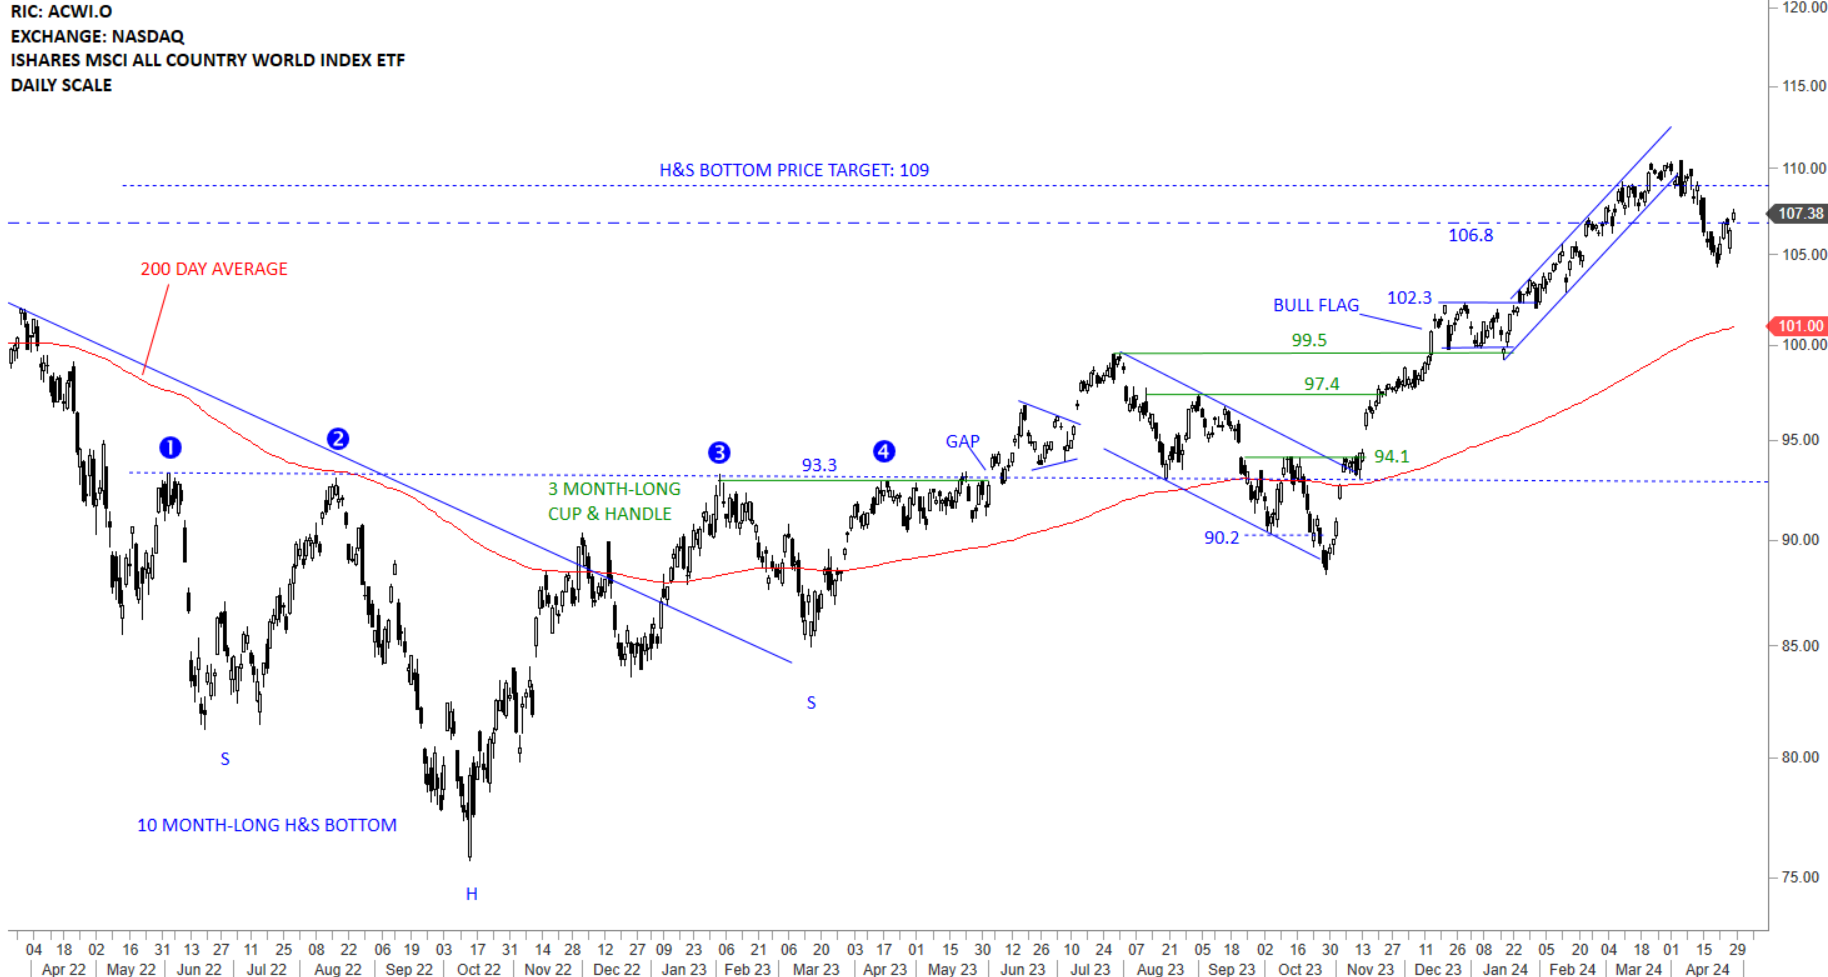
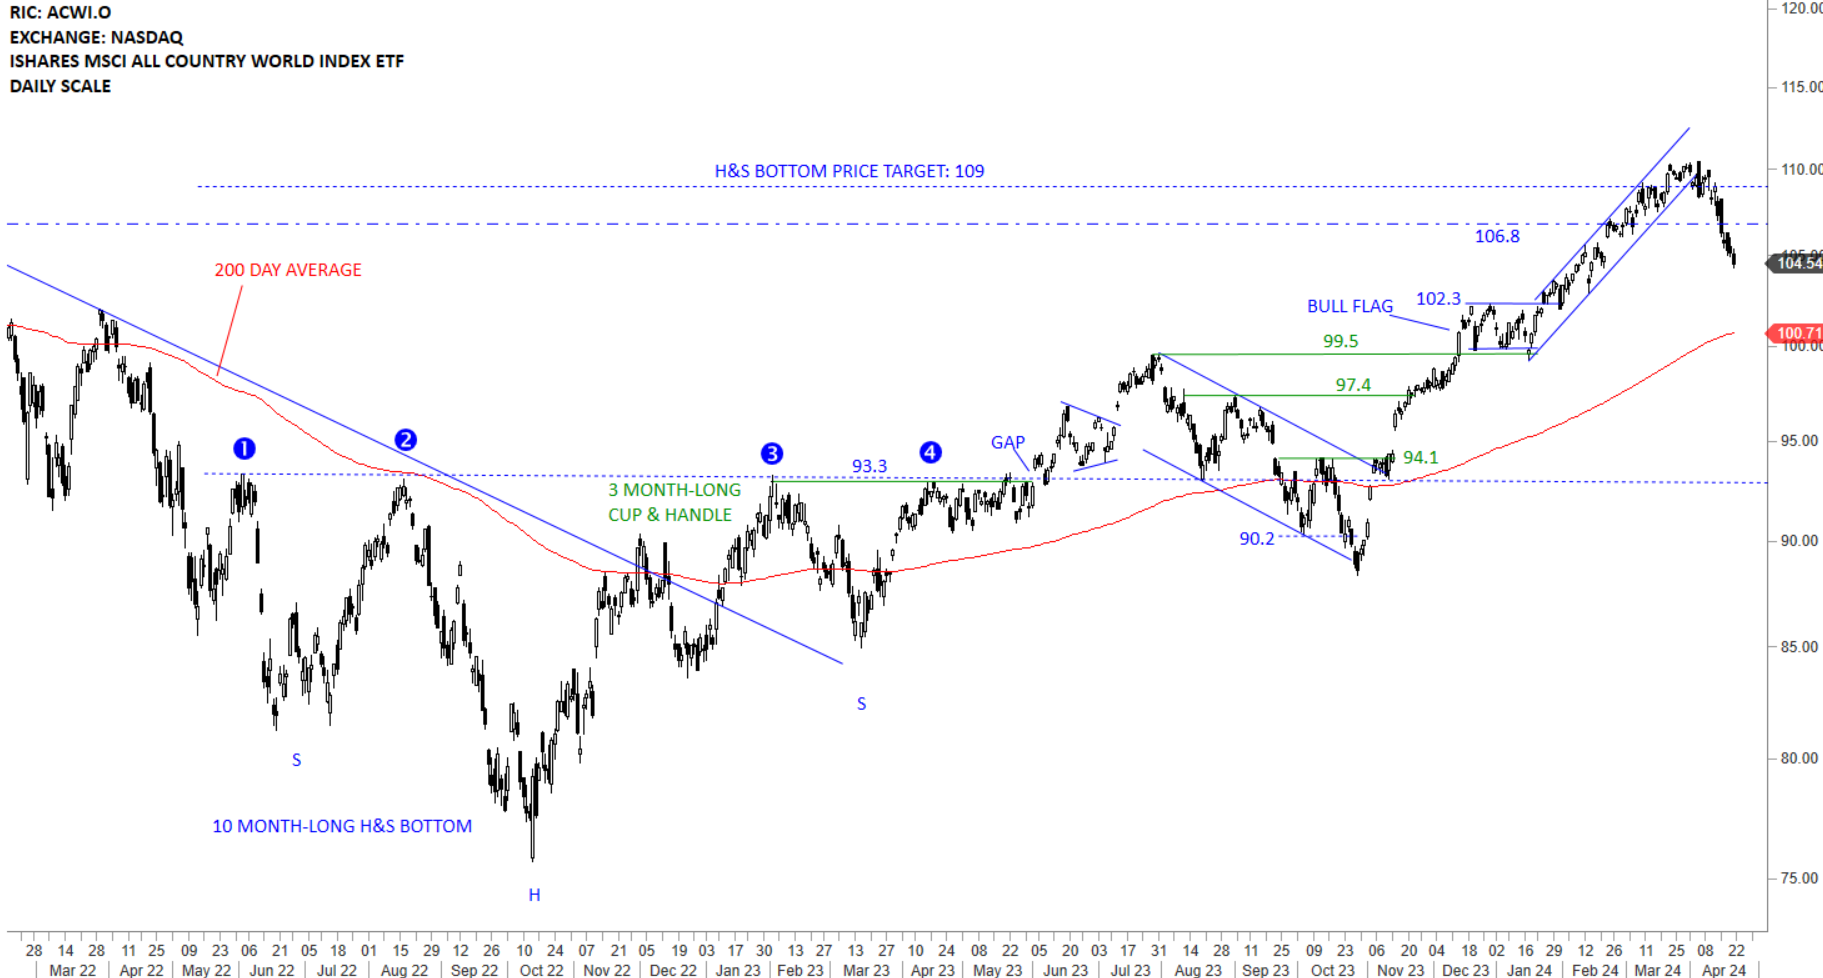
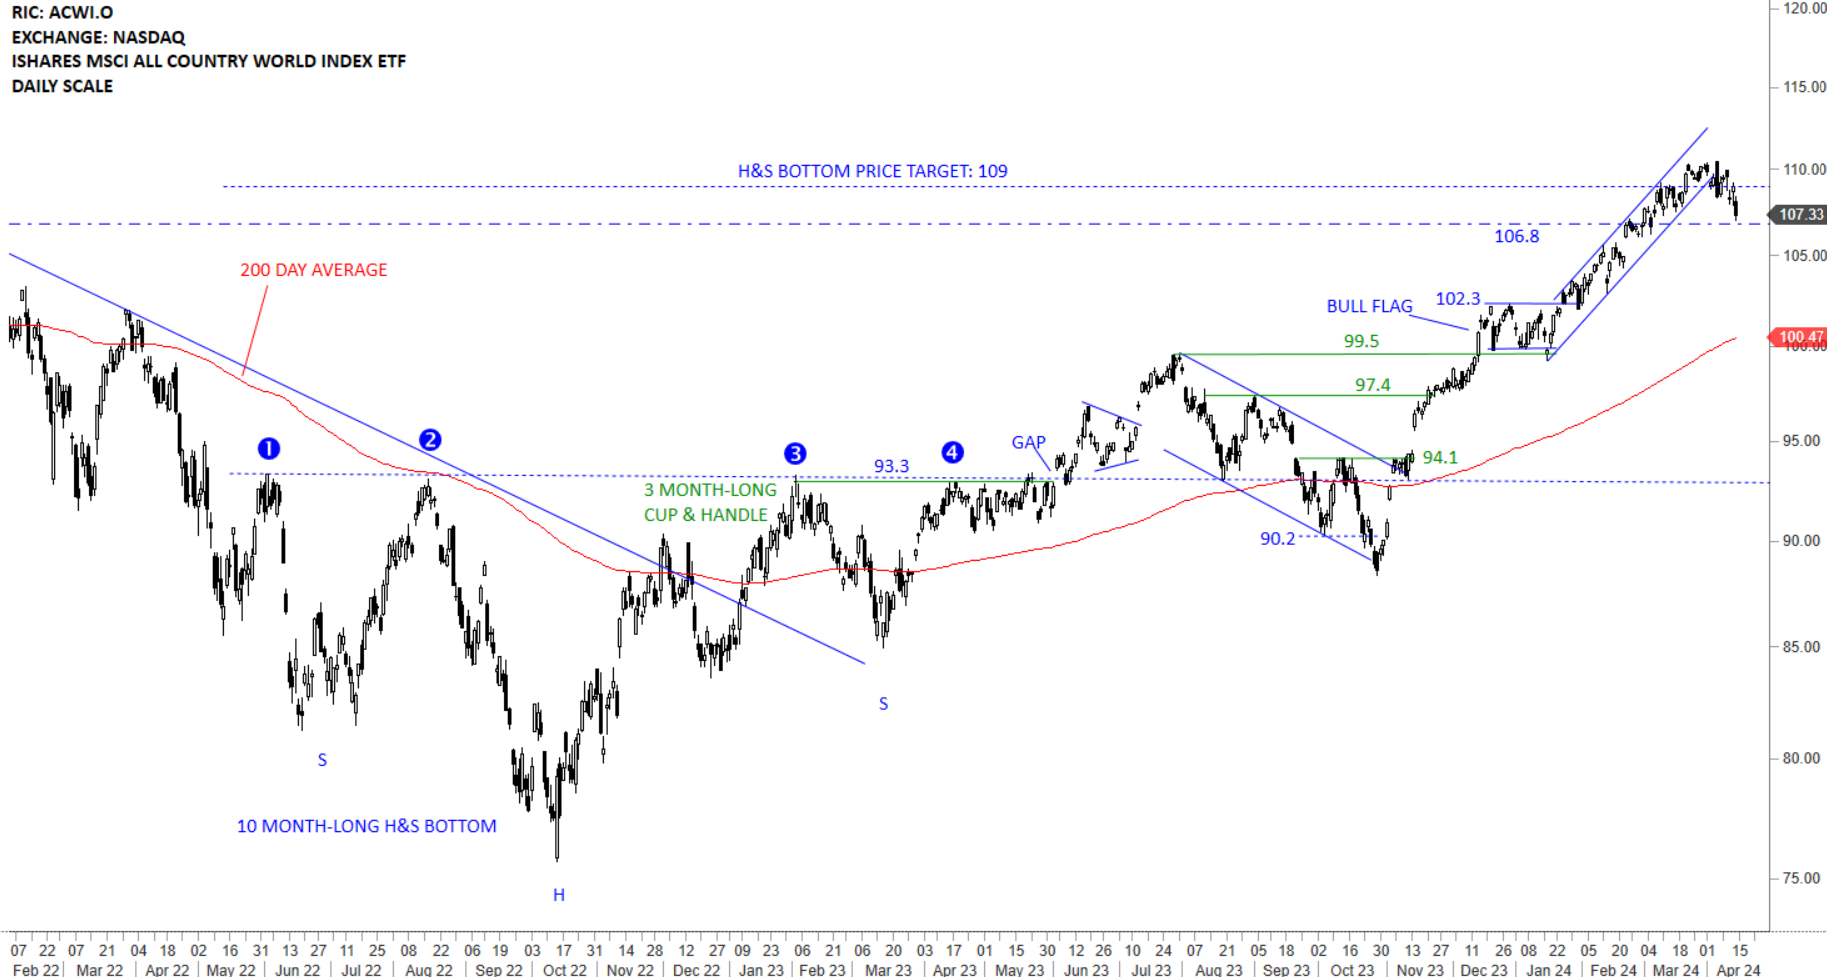
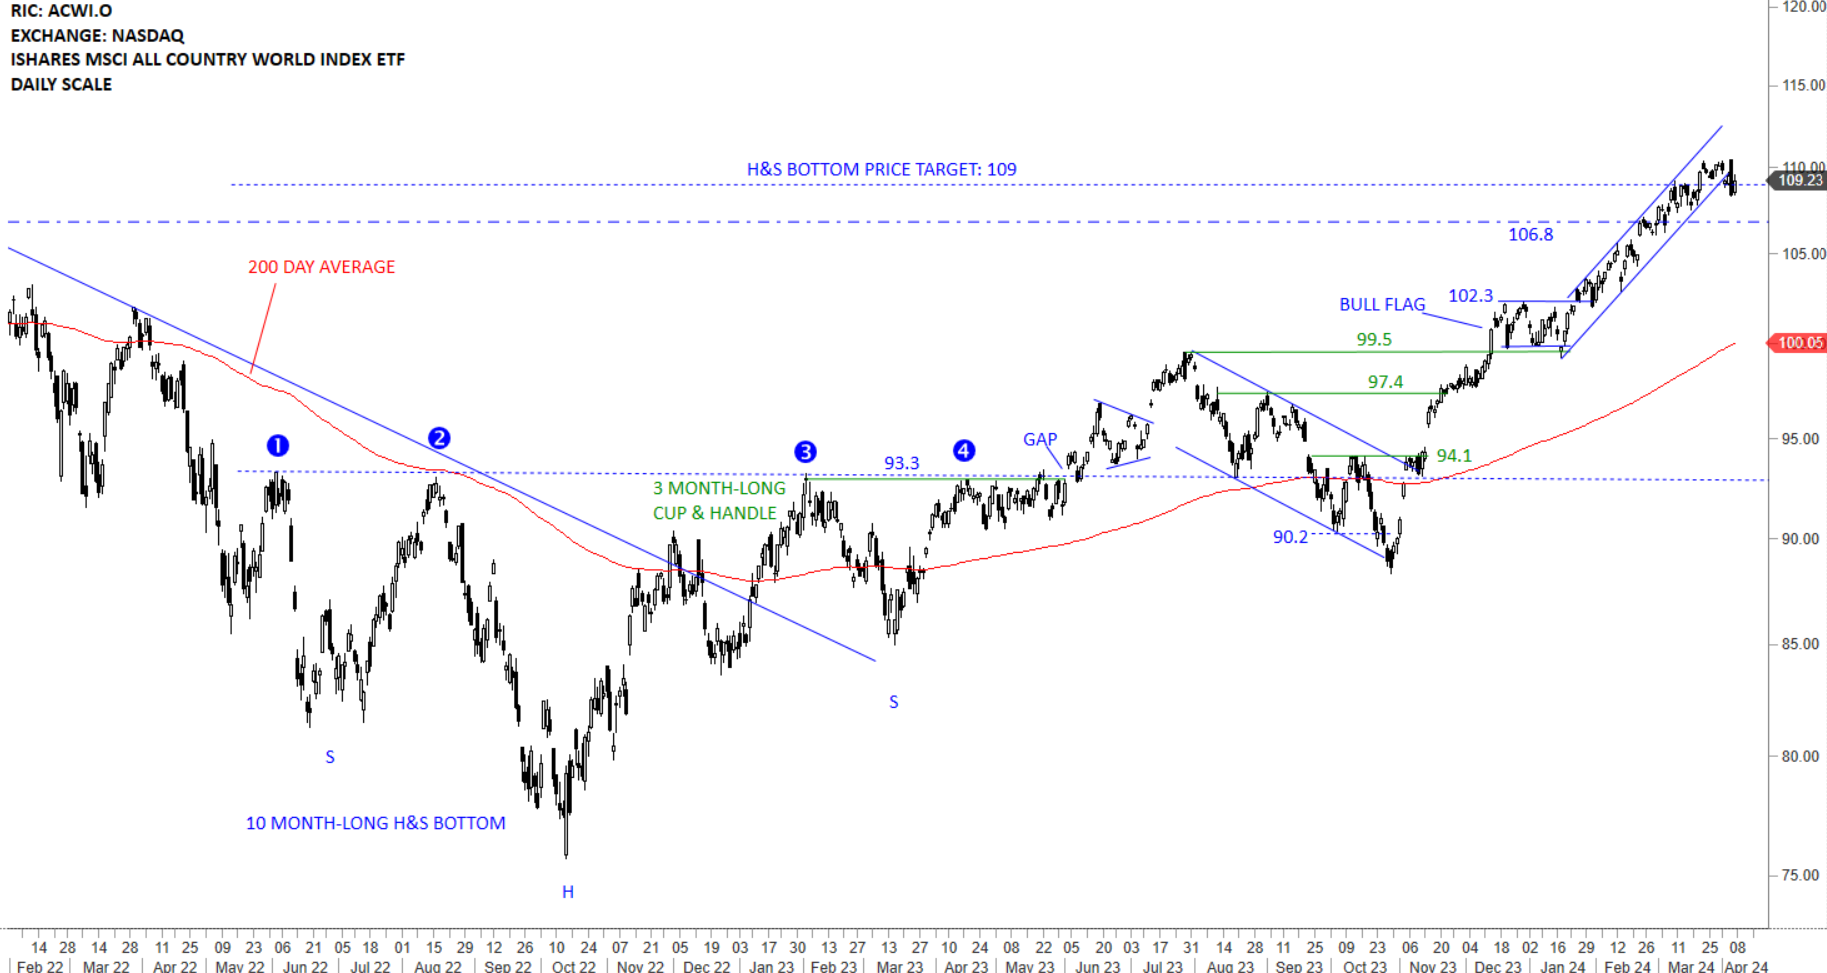
The benchmark for the Global equity markets performance, the iShares MSCI All Country World Index ETF (ACWI.O) reached its long-term H&S bottom price target at 109 levels. The ETF earlier completed a bullish flag which has helped the uptrend resume higher. The ETF breached the lower boundary of the short-term uptrend and this resulted in a pullback towards the support area between 106.8-102.3. Price is clearly above the long-term average and the uptrend is intact. Much deeper correction can target the 200-day average at 101.3 levels. Since October 2023, the index had a strong run and it is totally normal to see consolidation of earlier gains above the long-term average.