REVIEW
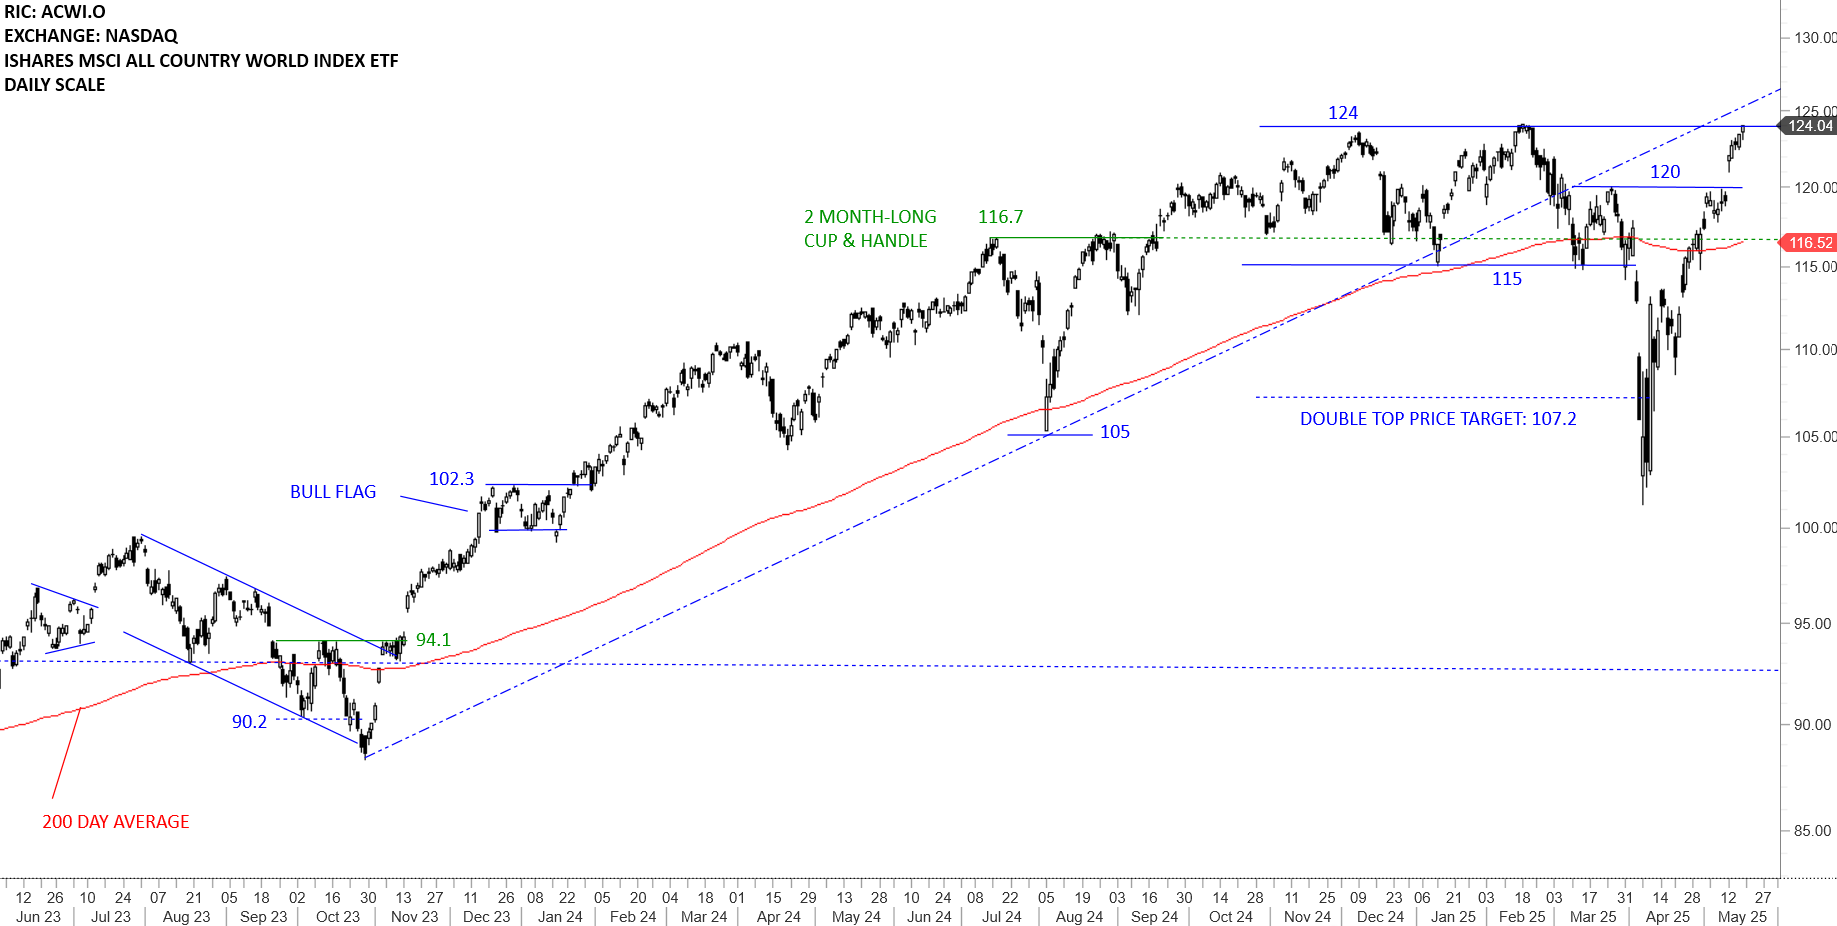
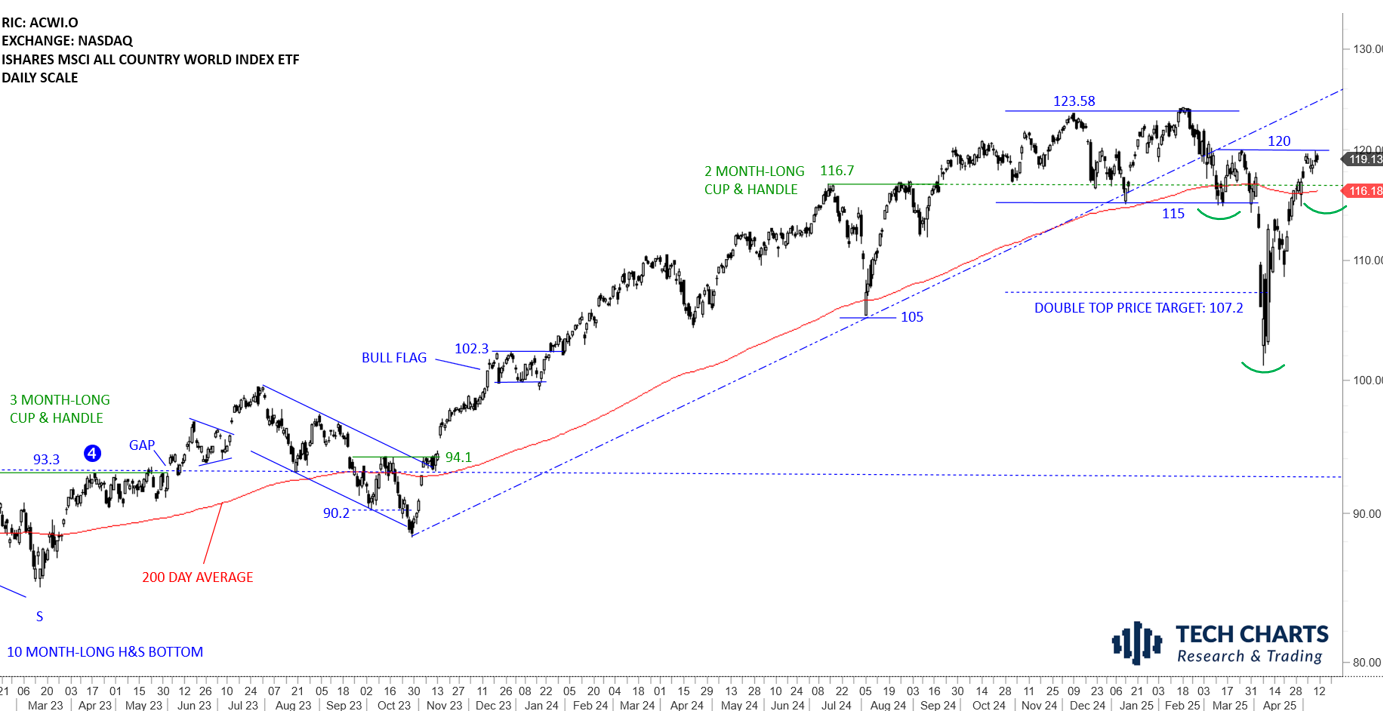
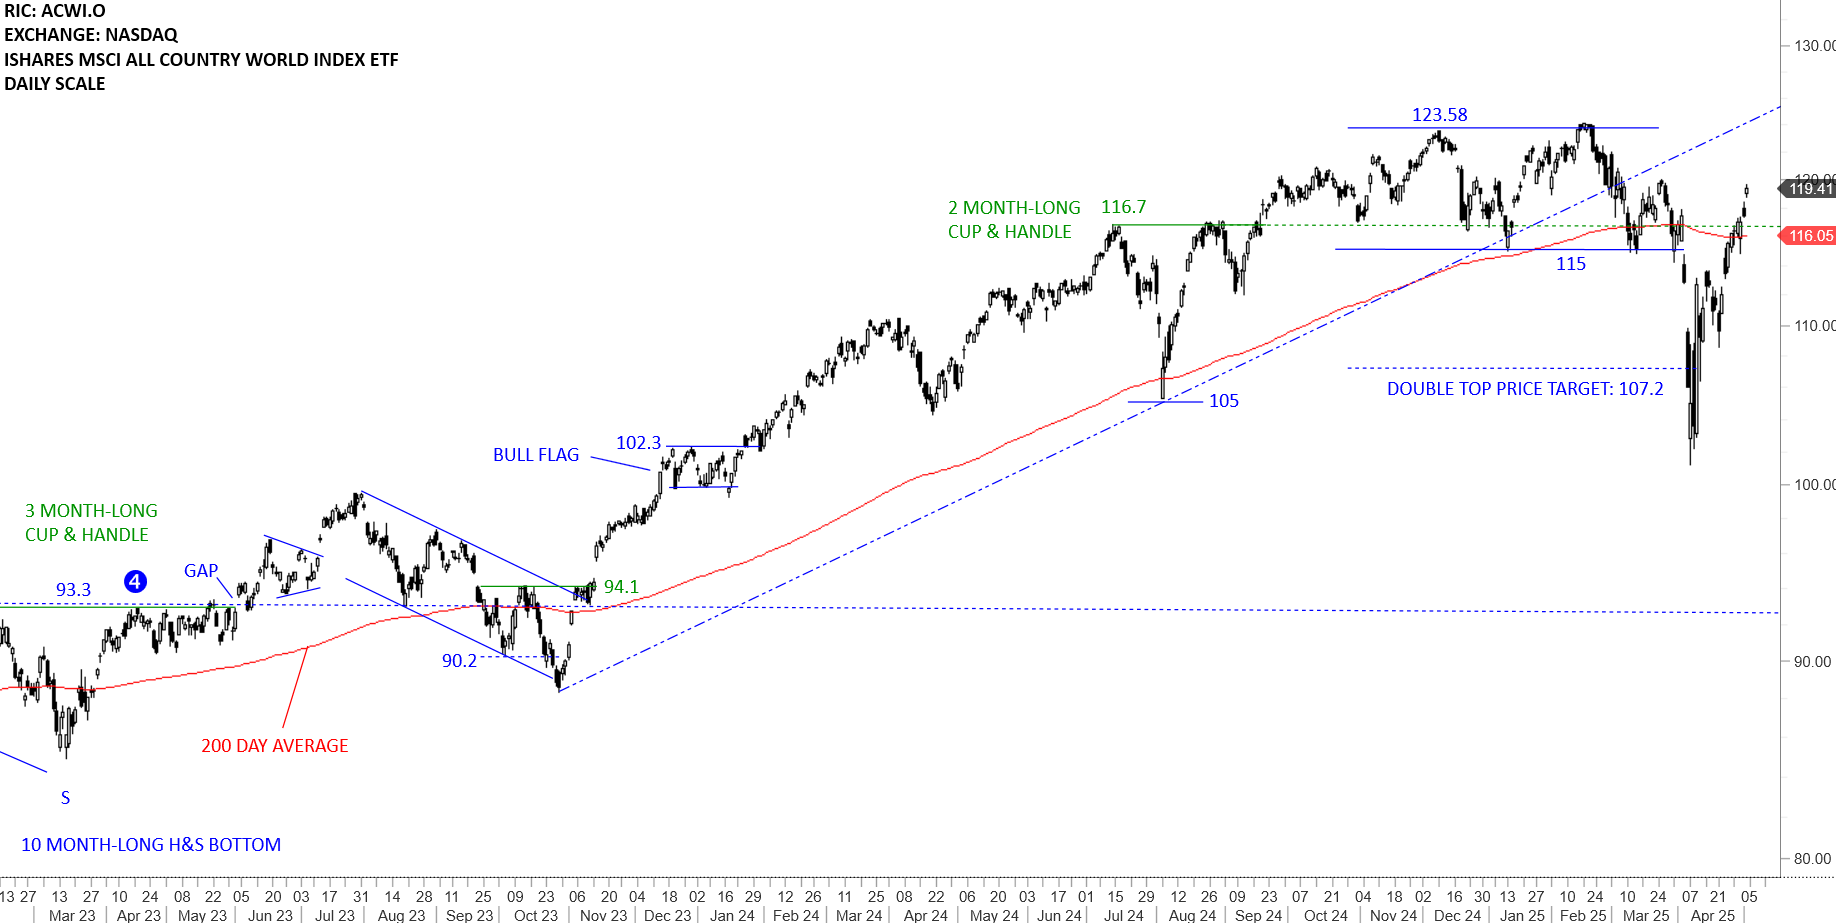
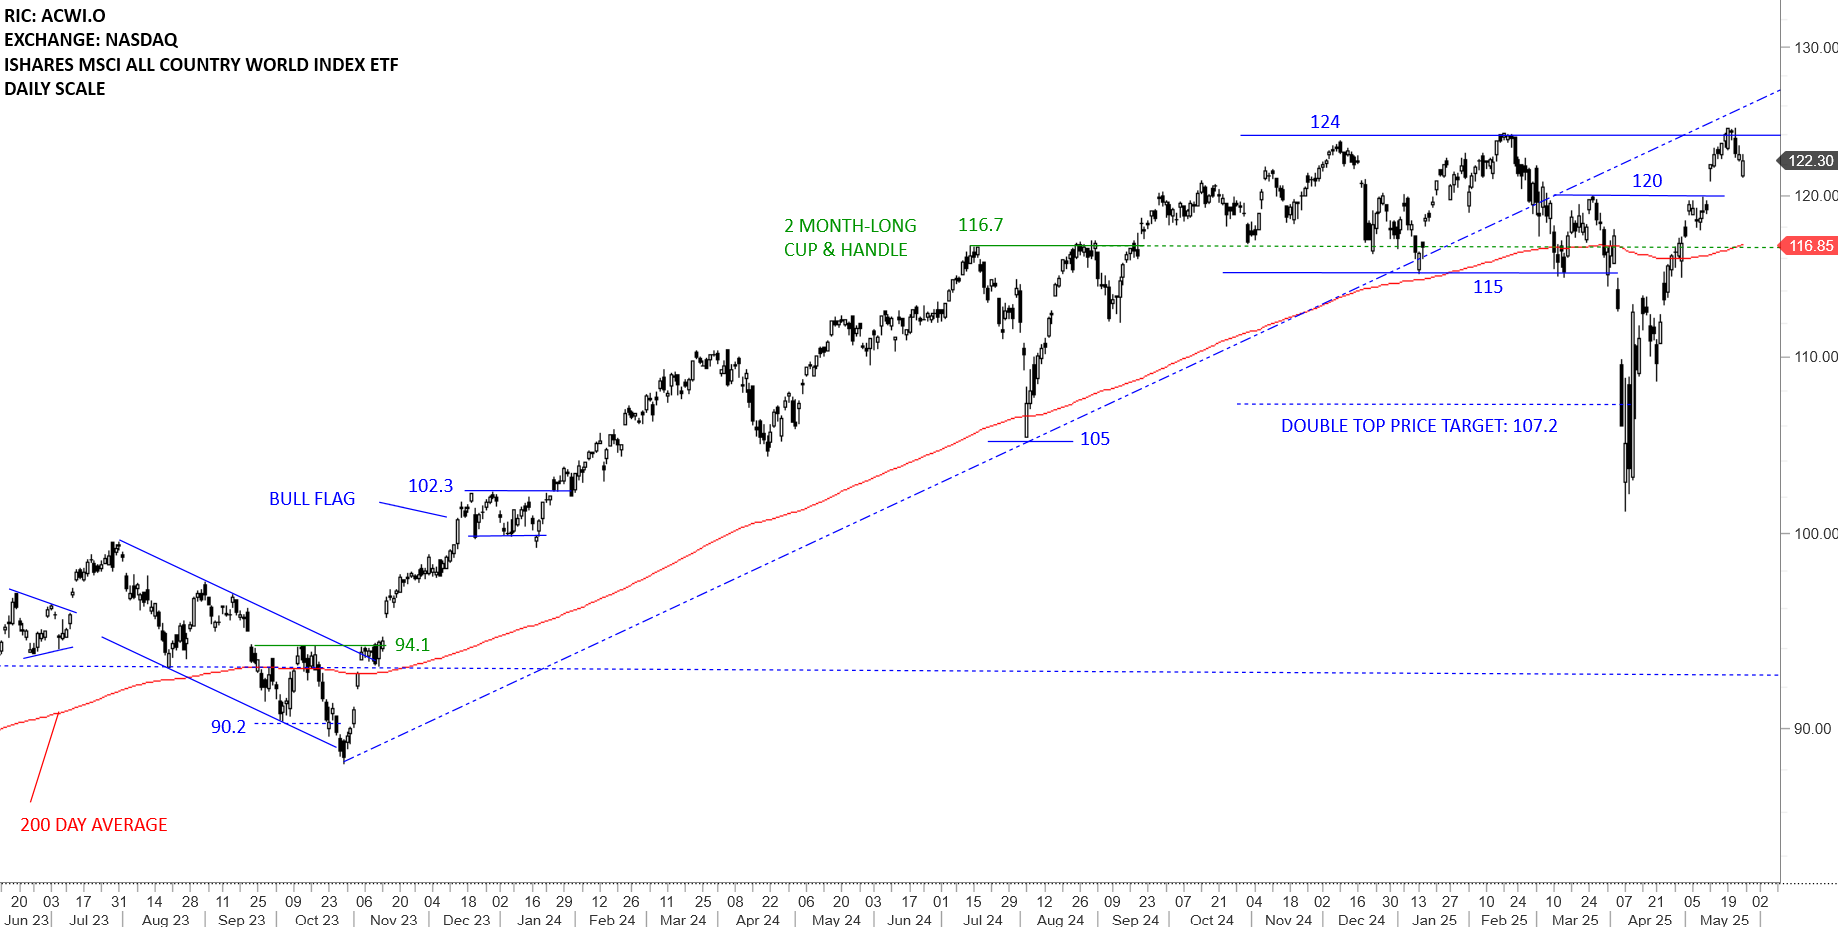
The benchmark for the Global equity markets performance, the iShares MSCI All Country World Index ETF (ACWI.O) did a round trip after the sharp sell-off and reached its all-time highs around 124 levels. The fact that the ETF cleared its 200-day average and moved significantly above it can be analyzed long-term positive as pullbacks and consolidations are likely to find support above the 200-day. I will monitor the ETF to see if it will stabilize above the long-term average in preparation of resuming higher. This can be the short breather after the ETF had a strong rebound. The breather if it forms a higher low above the long-term average in the form of a tight consolidation will increase the conviction on bullish setup, a possible H&S pattern with the neckline at 124 levels. 116.85-120 area will act as support during pullback. Outlook is positive for Global Equities.
Read more