GLOBAL EQUITY MARKETS – March 30, 2024

REVIEW


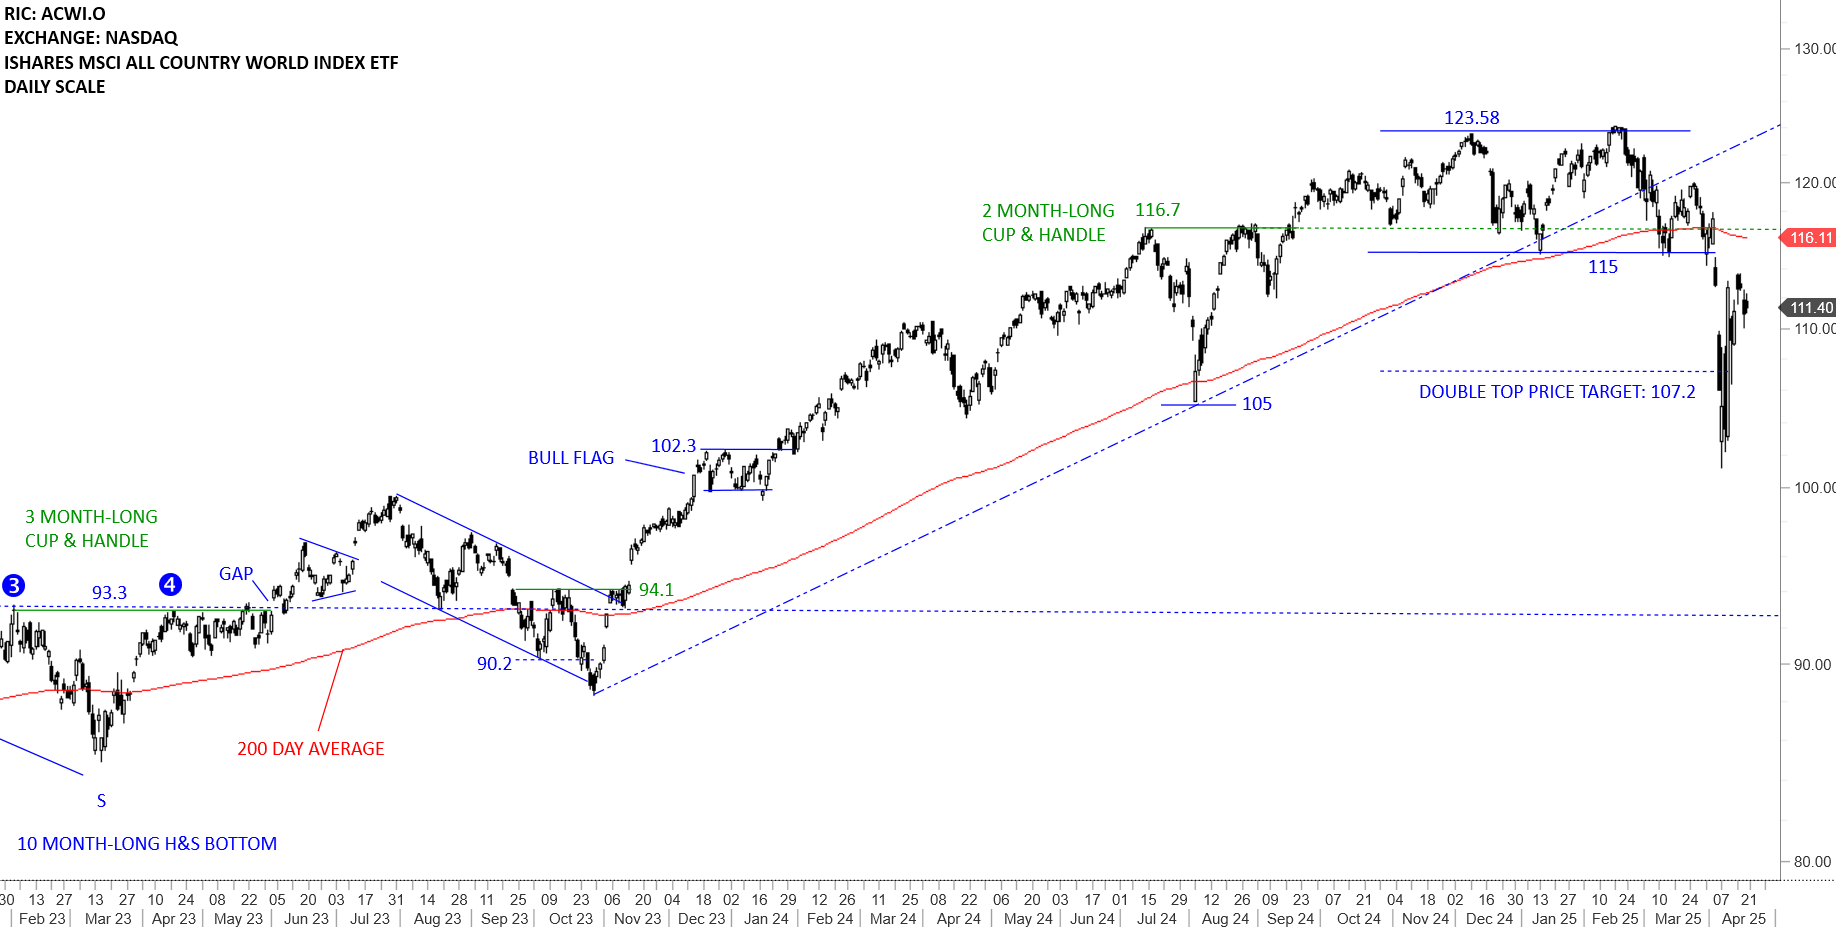
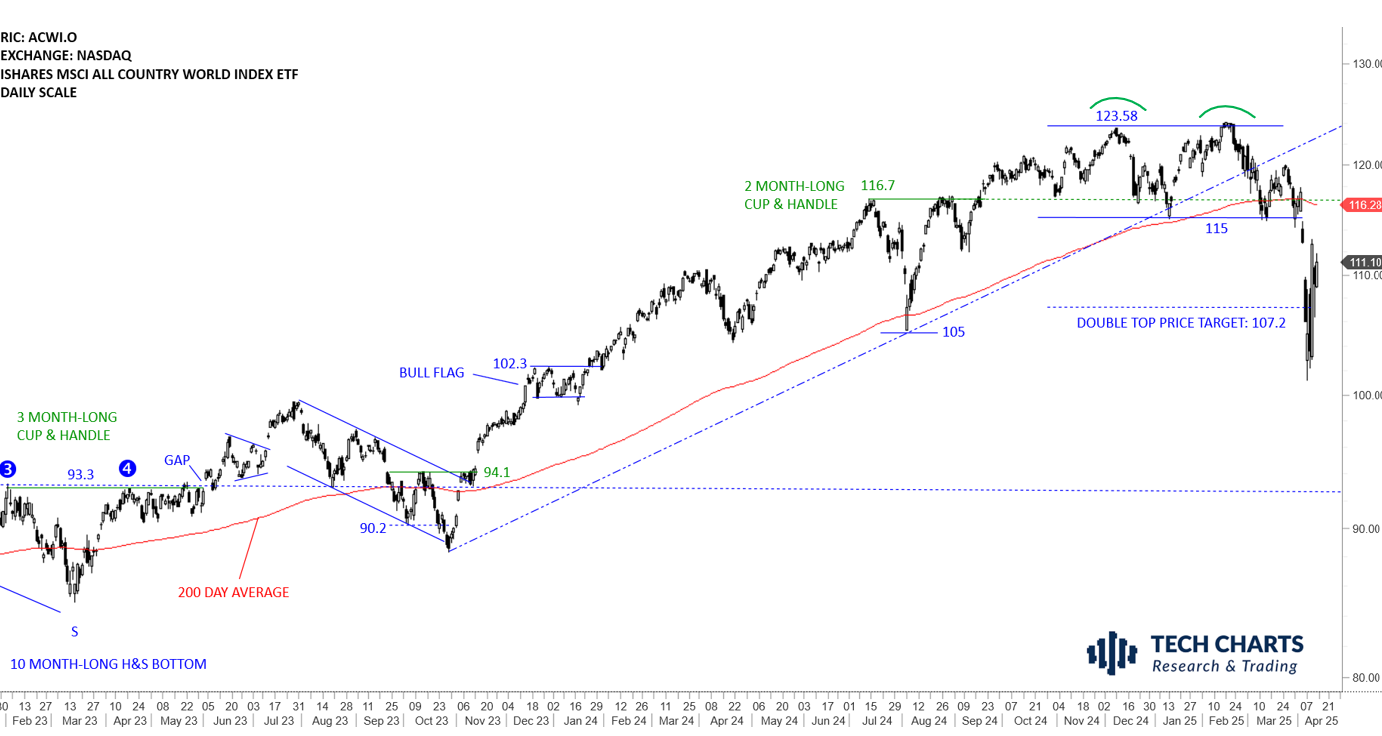
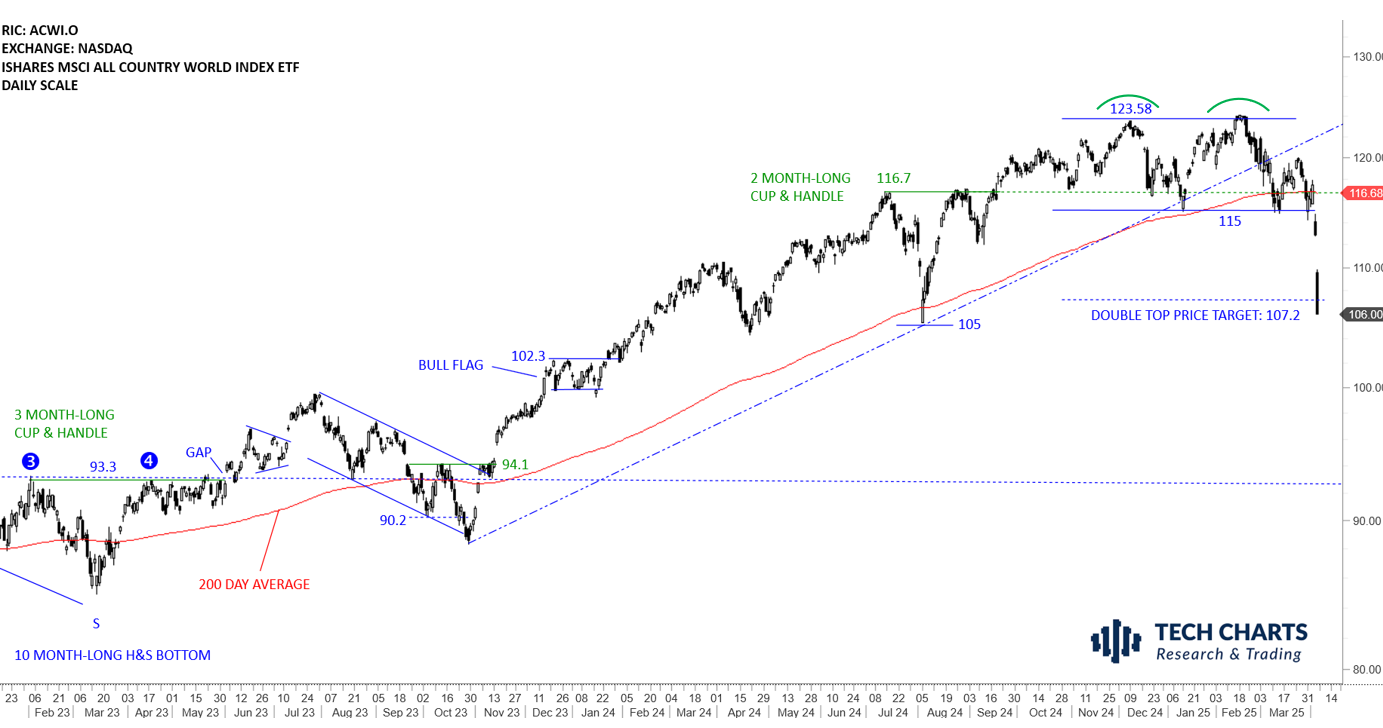
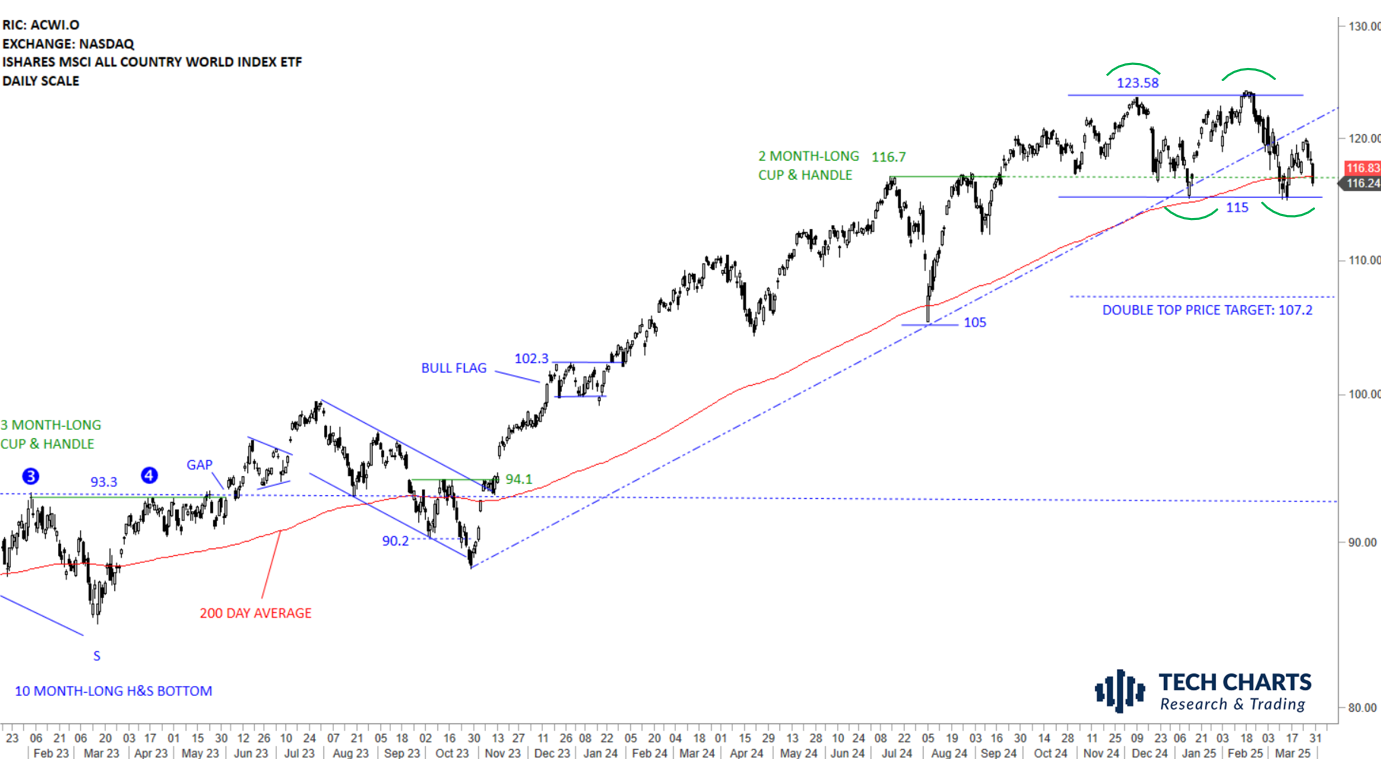
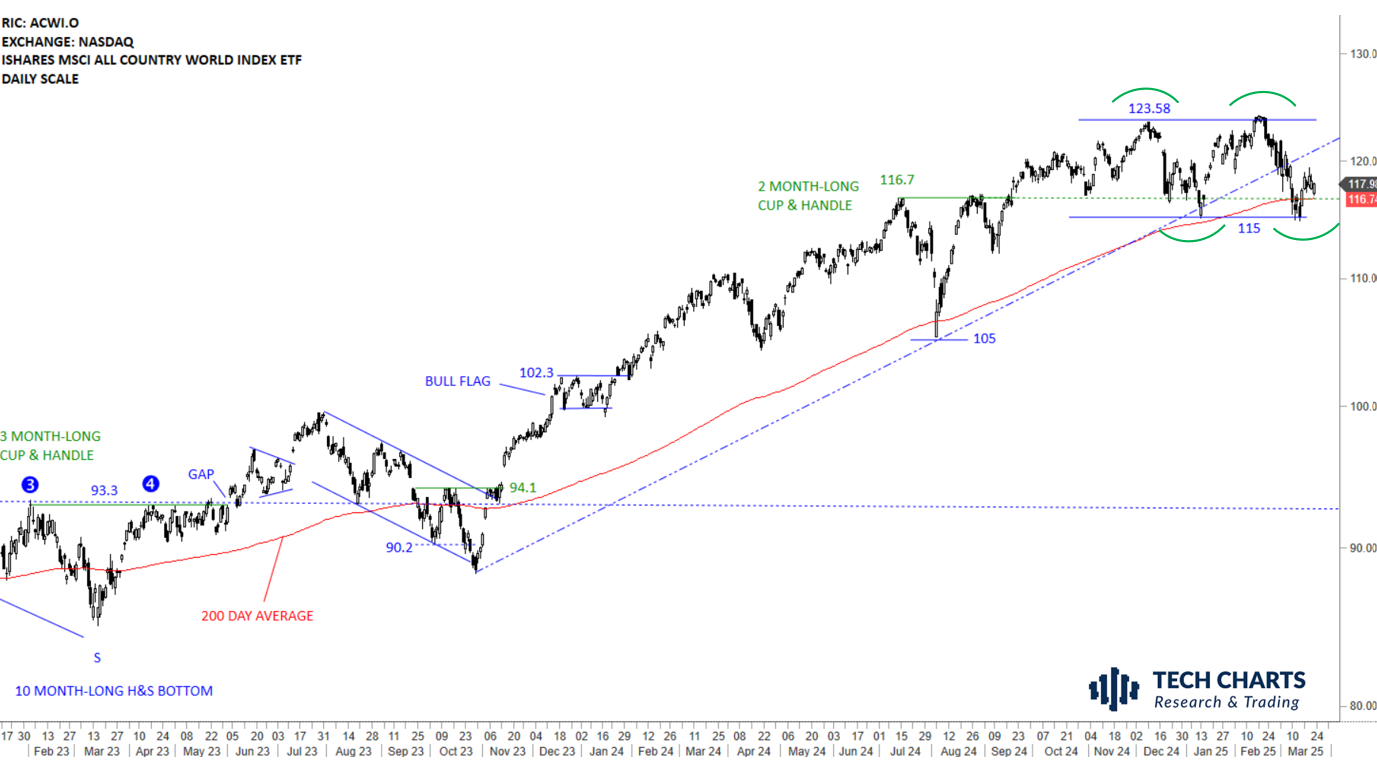
The benchmark for the Global equity markets performance, the iShares MSCI All Country World Index ETF (ACWI.O) reached its long-term H&S bottom price target at 109 levels. The ETF earlier completed a bullish flag which has helped the uptrend resume higher. The ETF formed a tight uptrend channel and the price remains inside the channel. There is no top reversal chart pattern at this stage. Uptrend is intact. During any sharp pullback 106.8-102.3 area can act as support.

Read More

Review of Chart Pattern Reliability Stats for 2023 and YTD 2024 – March 2024 Tech Charts Member Webinar

Review of Chart Pattern Reliability Stats for 2023 and YTD 2024 - March 2024 Tech Charts Member Webinar

Webinar Outline
  • Review of chart pattern statistics and discussion on chart pattern reliability covering the YTD numbers, 2023 and 7 year historical stats
  • Review of global equity markets and latest opportunities
  • Review of opportunities in the cryptocurrency markets
  • Q&A

Live Questions from Members

  1. H&S continuation, can you walk through an example? 56:00
  2. What is the assumed stop loss used in the calculated success rates? If the success rate is based on a 20% negative move before reaching it, it is less meaningful. 1:00:24
  3. You emphasize the importance of seeing multiple "reactions" to the pattern boundary. On your charts, some "reactions" are sharp v-reversals; others are just a few candles of "hesitation." How do you personally define a valid "reaction" to a boundary? 1:02:21
  4. When do you move your stop to break even? 1:04:20
  5. Do you have stats for different markets? Is the success rate roughly the same if one doesn't trade all signals worldwide? 1:06:14
  6. What is your view on the current US$ Index (DXY)? 1:07:56
  7. What are your thoughts on Copper (symbol HGcv1 on Metastock)? 1:08:42
  8. In CVNA does price action have to correct itself after a gap up? 1:09:49
  9. What is your typical yearly ROI with your trading strategy? 1:11:04
  10. How do you manage your finances as a full-time trader? 11:11:43 (Helpful article on Factor's website, Peter L. Brandt - So you want to become a full-time trader )
  11. The markets are at all-time highs. How do you guide trades at this point? 1:12:00
  12. In a Type 4 breakout, what is the median, max and min loss you go for or have achieved? 1:12:43
Recorded live 03.21.2024 Read More

GLOBAL EQUITY MARKETS – March 23, 2024

REVIEW


The benchmark for the Global equity markets performance, the iShares MSCI All Country World Index ETF (ACWI.O) reached its long-term H&S bottom price target at 109 levels. The ETF earlier completed a bullish flag which has helped the uptrend resume higher. Global Equity benchmark formed a short-term consolidation between 106.8-109 area which was broken on the upside during the week. There is no top reversal chart pattern at this stage. Uptrend is intact. During any sharp pullback 106.8-102.3 area can act as support.

Read More

Live Webinar and Q&A with Aksel – Thursday, March 21, 2024, 8:30 am mountain

Dear Tech Charts Members, We are continuing our Member webinar series with chart pattern reliability statistics Year to Date, for the year 2023 and past 7 years combined. We plan to have an interactive session and an open discussion to answer members' questions on different markets and specific charts of interest. Please send your charts and questions to aksel@techcharts.net, and I will add them to the webinar discussion points. Scheduled for: Thursday, March 21, 8:30 am mountain (register below) Read More

CRYPTOCURRENCIES – March 17, 2024

BTCUSD is testing the resistance area between 65K - 68K. Breakout above the upper boundary of a rising trend channel started a runaway price movement towards the resistance area. This week's price action is not a confirmed breakout to all-time high levels. ETHUSD cleared the upper boundary of the possible rising wedge, held the support level and now accelerating the uptrend with long back to back white candles towards the next resistance at 4,400 levels. Read More

GLOBAL EQUITY MARKETS – March 16, 2024

REVIEW


The benchmark for the Global equity markets performance, the iShares MSCI All Country World Index ETF (ACWI.O) reached its long-term H&S bottom price target at 109 levels. The ETF earlier completed a bullish flag which has helped the uptrend resume higher. Global Equity benchmark is now testing a resistance area. 106.8-109 area is acting as resistance and so far paused the existing uptrend. There is no top reversal chart pattern at this stage. During any sharp pullback 106.8-102.3 area can act as support. Short consolidation above 106.8 should be considered bullish and suggest continuation of the existing uptrend.

Read More

GLOBAL EQUITY MARKETS – March 9, 2024

REVIEW


The benchmark for the Global equity markets performance, the iShares MSCI All Country World Index ETF (ACWI.O) reached its long-term H&S bottom price target at 109 levels. The ETF earlier completed a bullish flag which has helped the uptrend resume higher. Global Equity benchmark is now testing a resistance area. 106.8-109 area can act as resistance and pause the existing uptrend. There is no top reversal chart pattern at this stage. During any sharp pullback 106.8-102.3 area can act as support.

Read More

INTERIM UPDATE – March 7, 2024

I start my research on Mondays and finalize by end of day Thursday. Friday is dedicated to putting all ideas to the report format. During the week I come across good setups and those are featured in the weekly report. However, there are those that pop up during the week and is worth bringing to your attention before the week finalizes. Below are the latest additions to Tech Charts watchlist. These charts will also be included in the weekly update.

Read More

CRYPTOCURRENCIES – March 3, 2024

BTCUSD cleared the upper boundary of trend channel and once again tested the 65K resistance. Breakout above the upper boundary of a rising trend channel started a runaway price movement towards 65K. ETHUSD cleared the upper boundary of the possible rising wedge, held the support level and now accelerating the uptrend with long back to back white candles. Read More

GLOBAL EQUITY MARKETS – March 2, 2024

REVIEW


The benchmark for the Global equity markets performance, the iShares MSCI All Country World Index ETF (ACWI.O) is trending towards the long-term H&S bottom price target at 109 levels. The ETF earlier completed a bullish flag which has helped the uptrend resume higher. Global Equity benchmark is now getting closer to a resistance area. 106.8-109 area can act as resistance and pause the existing uptrend. There is no top reversal chart pattern at this stage.

Read More