GLOBAL EQUITY MARKETS – August 19, 2017
REVIEW
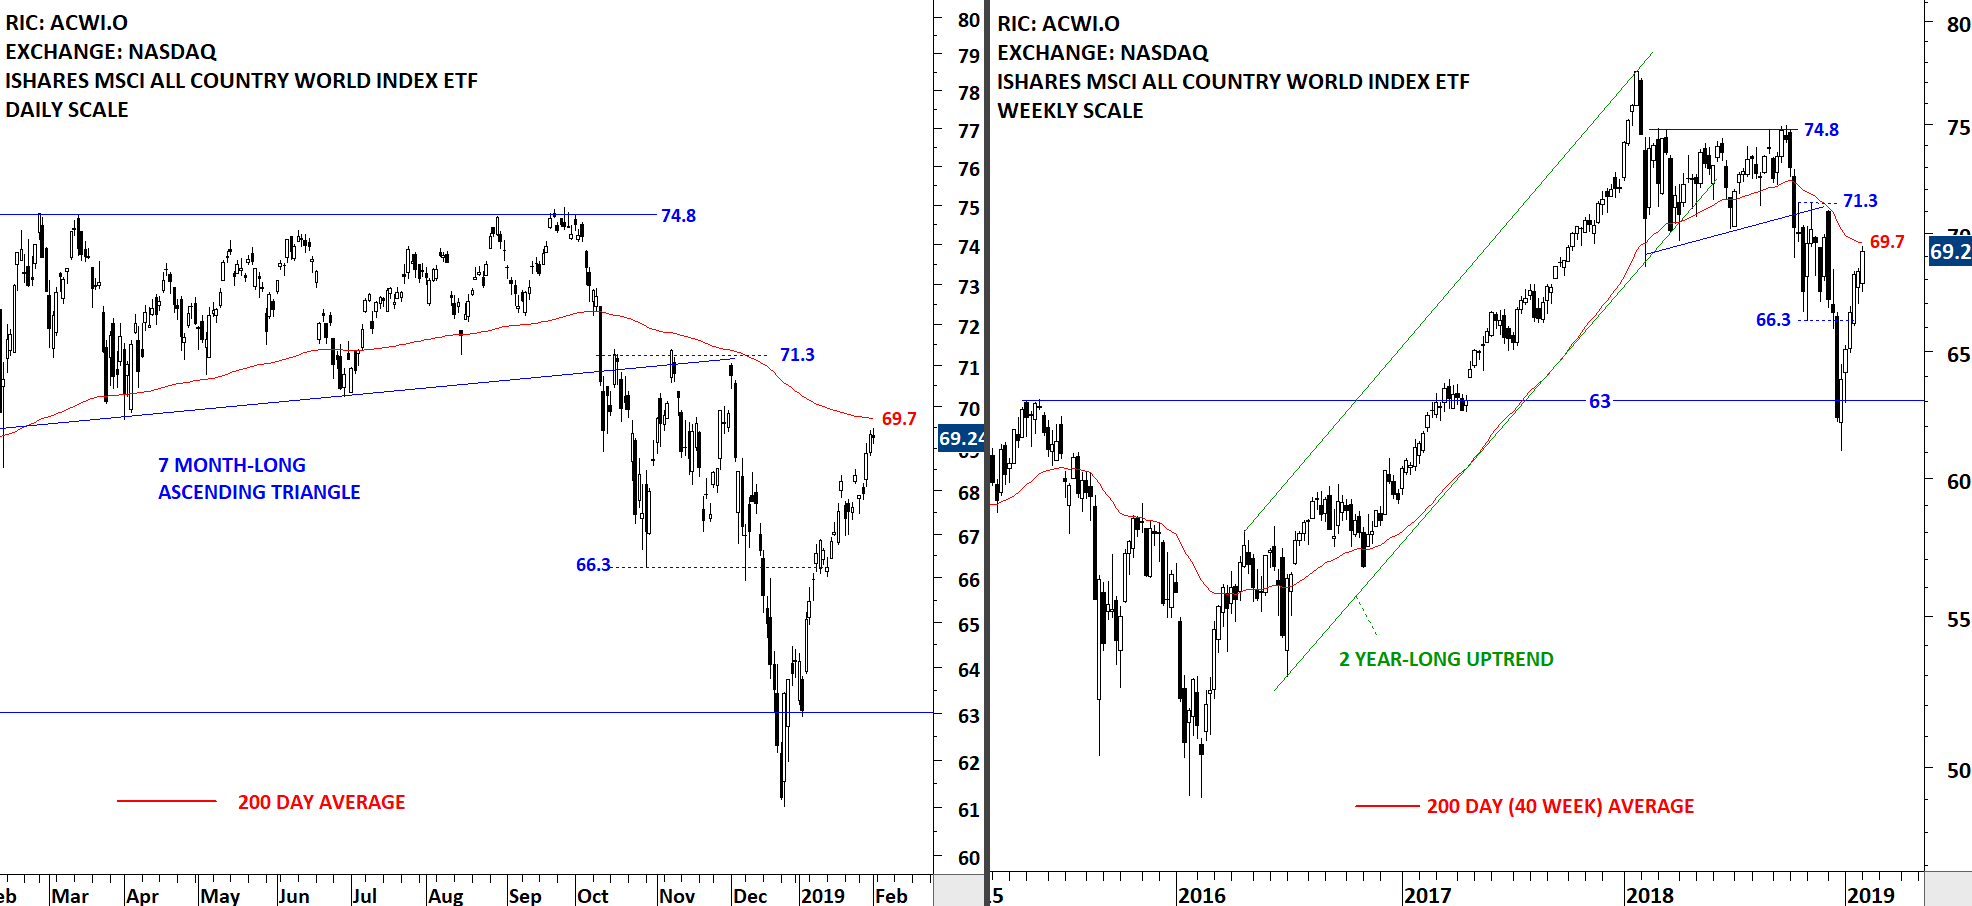
The iShare MSCI ACWI ETF is testing a 17 month-long upward trend line. The more a trend line or a support/resistance area is tested the more important it becomes. The long-term trend line has been tested several times. In the beginning of the week, the global equity benchmark ACWI rebounded from the lower boundary of its 7 month-long trend channel but finished at the same level on Friday. A breakdown below 66.3 levels can push the price towards the long-term trend line support at 65.8. Steep trend lines like the one we are seeing on the ACWI, can't extend for a long time. The trend needs adjustment, in other words find another low. (I added an S&P 500 chart below to better explain this point). The real test will be at 65.8 levels. Breakdown below that support can result in a correction towards 63 levels. Next week, I will be monitoring 66.3 and 65.8 levels closely. Important support area is between 65.8 and 66.3. I will issue interim updates if there is a change in the technical outlook.
Read More