GLOBAL EQUITY MARKETS – August 2, 2025
REVIEW
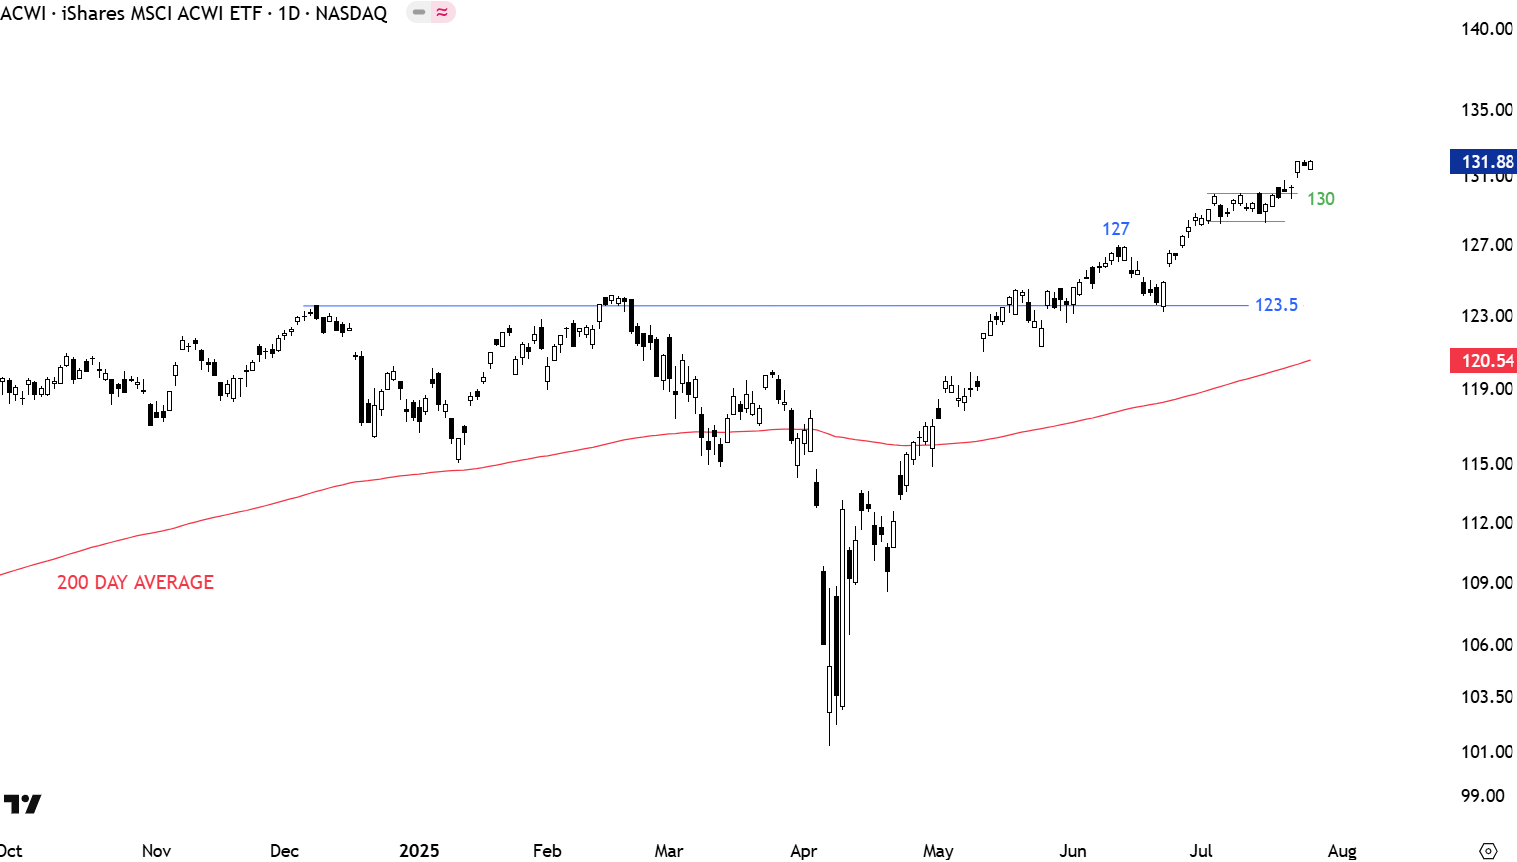
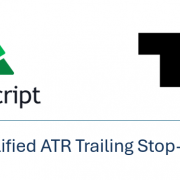
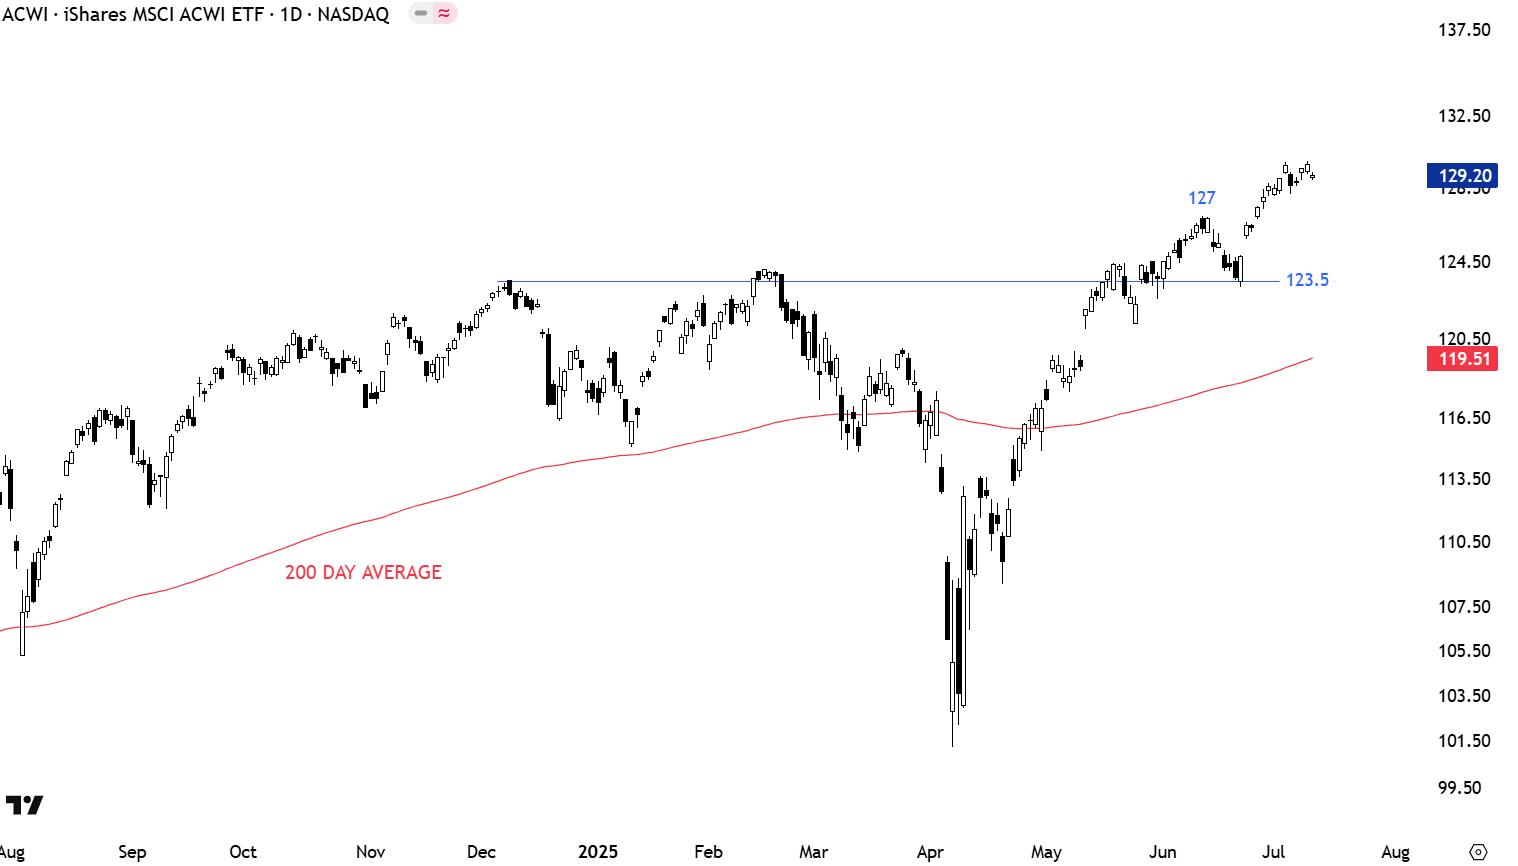
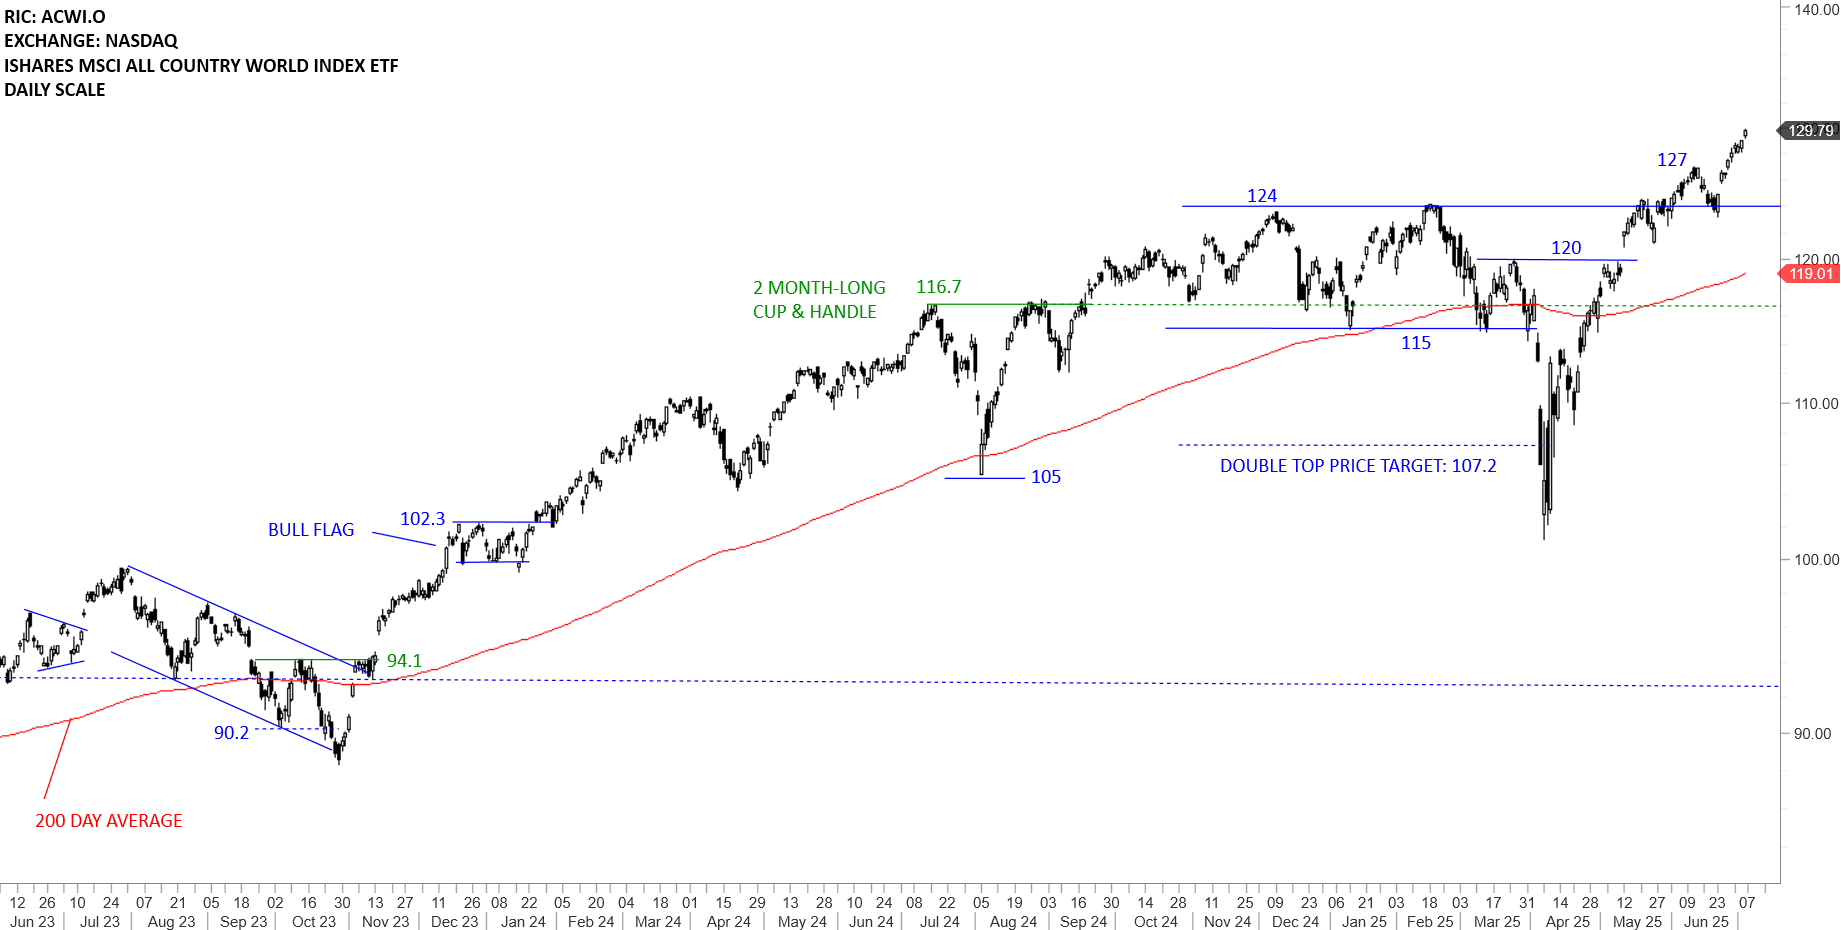
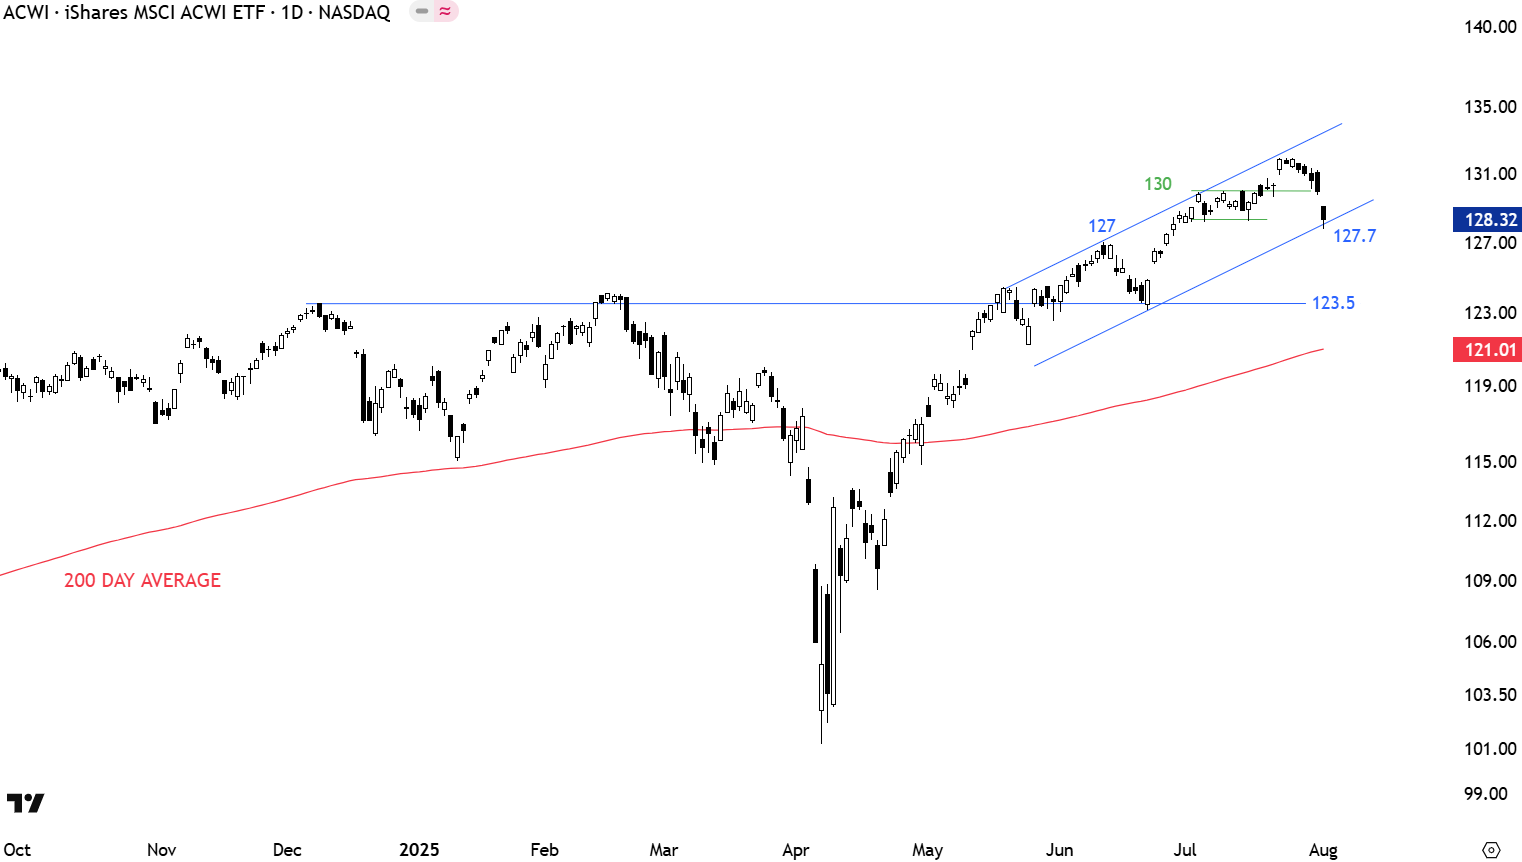
The benchmark for the Global equity markets performance, the iShares MSCI All Country World Index ETF (ACWI.O) did a round trip after the sharp sell-off and reached its all-time highs around 123.5 levels. The fact that the ETF cleared its 200-day average and moved significantly above it can be analyzed long-term positive as pullbacks and consolidations are likely to find support above the 200-day. After clearing the horizontal resistance at 123.5 and the minor high at 127 levels, 123.5-127 area will act as support during any pullback. A possible trend channel might be forming with price testing its lower boundary with Friday's sell-off. Breakdown below the lower boundary of the trend channel can result in a correction towards the horizontal support at 123.5 levels.
 Read More