Re-entry, Volatility & ATR based stop-loss – September 2020 Tech Charts Webinar
Re-entry, Volatility & ATR based stop-loss - September 2020 Tech Charts Webinar
We are continuing our Member webinar series with several important and frequently asked topics. In the following webinar, we will follow a different approach. Given that the topics are different concepts in technical analysis/classical charting and trading, each section will have a +/- 10 min presentation followed by Q&A on that section.
Webinar Outline
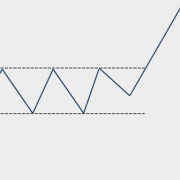
- RE-ENTRY strategy after an out of line movement or hard re-test. We will try to understand how to navigate volatile price action around pattern boundaries. Followed by Q&A
- Differences between Stop-loss and Chart pattern negation levels.
- Volatility (Average True Range and Bollinger Bands).
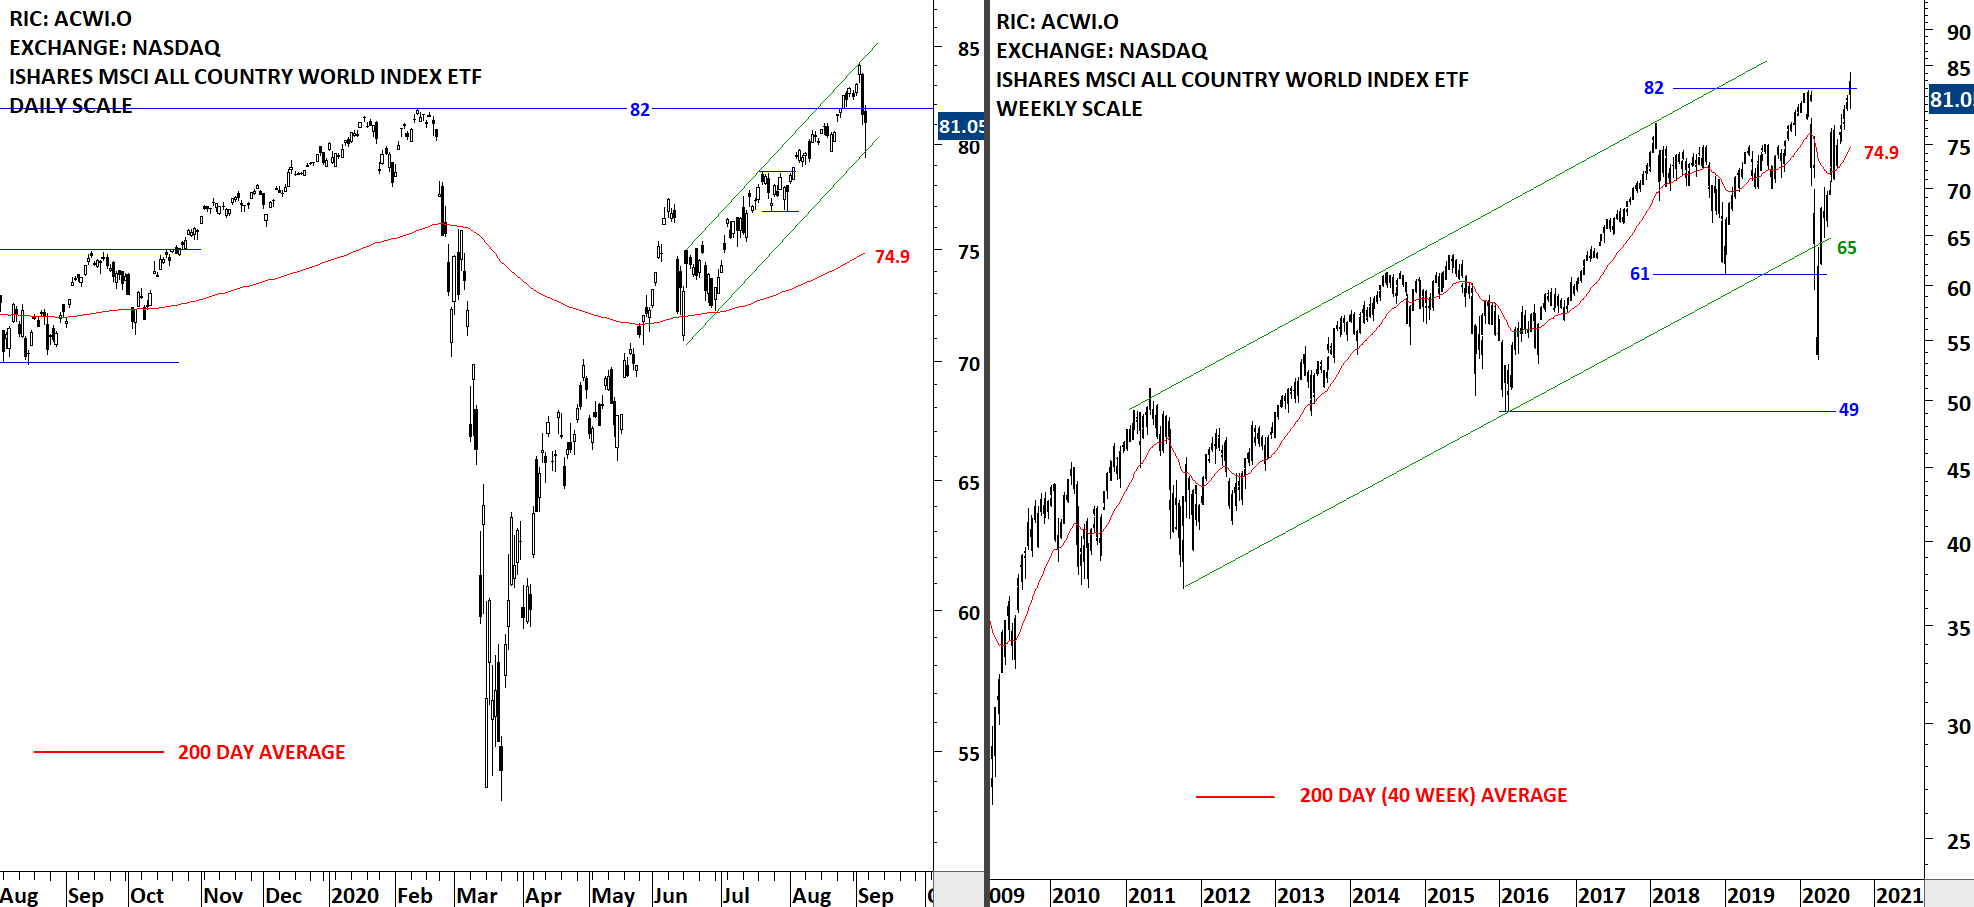
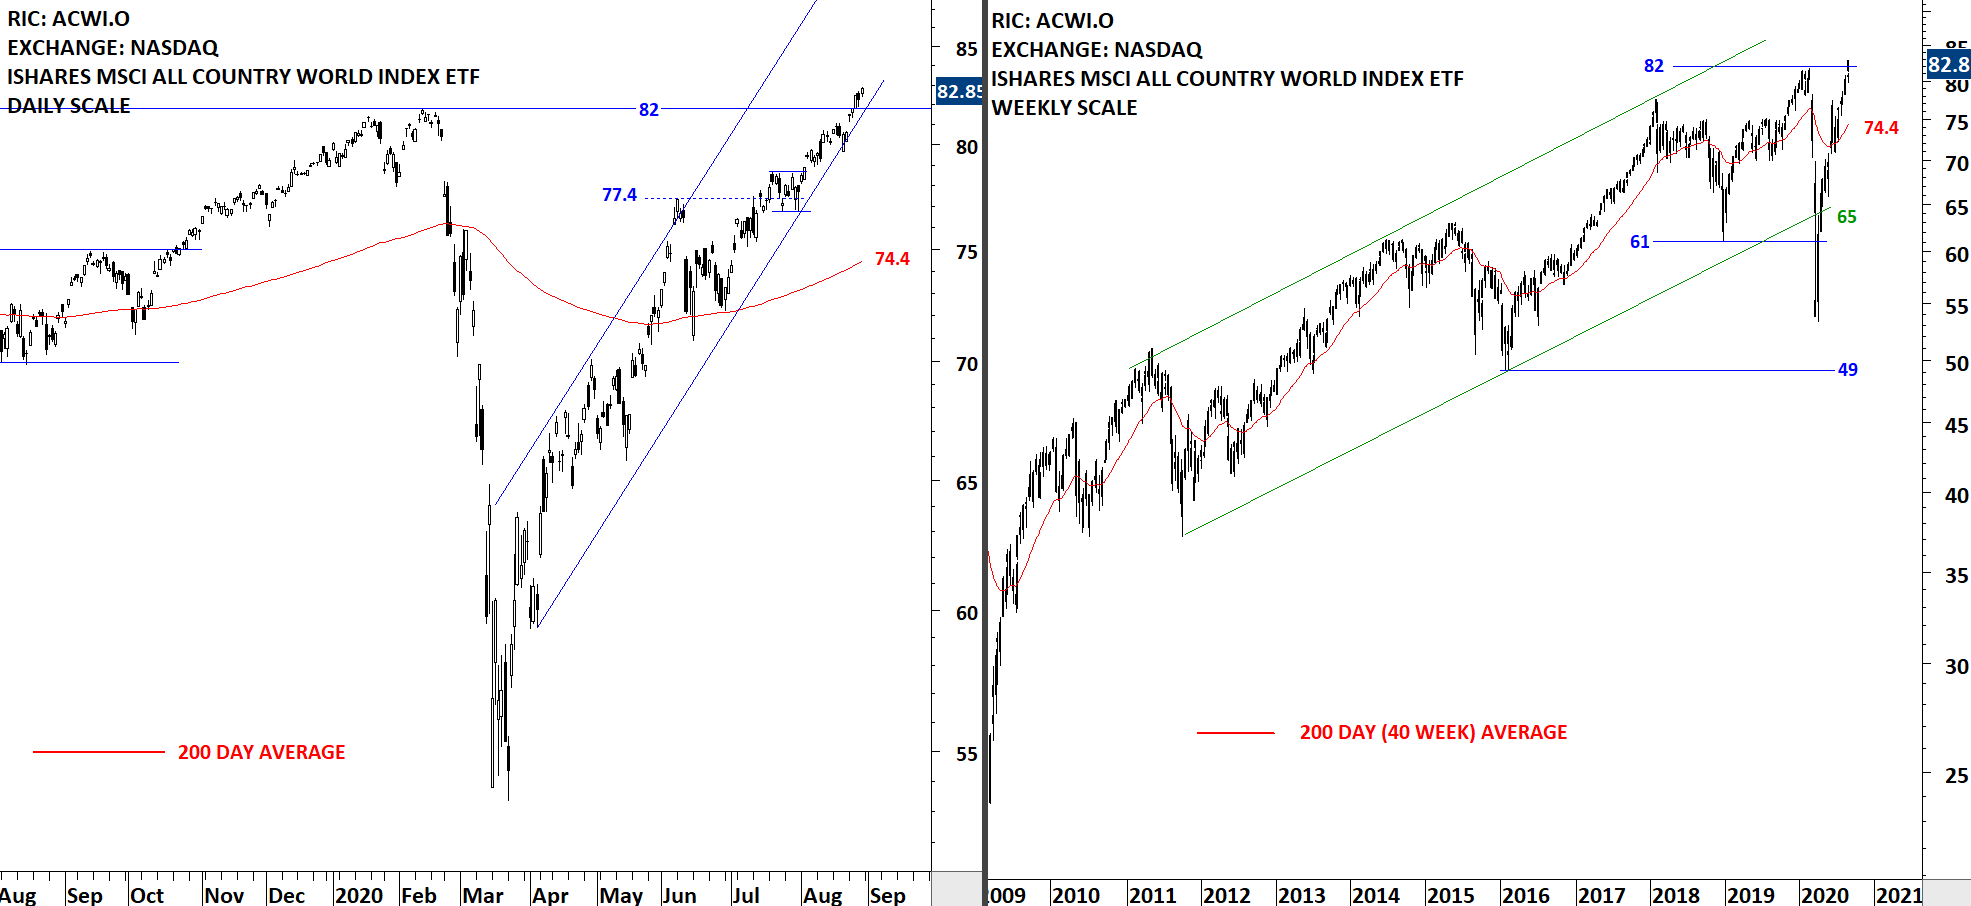
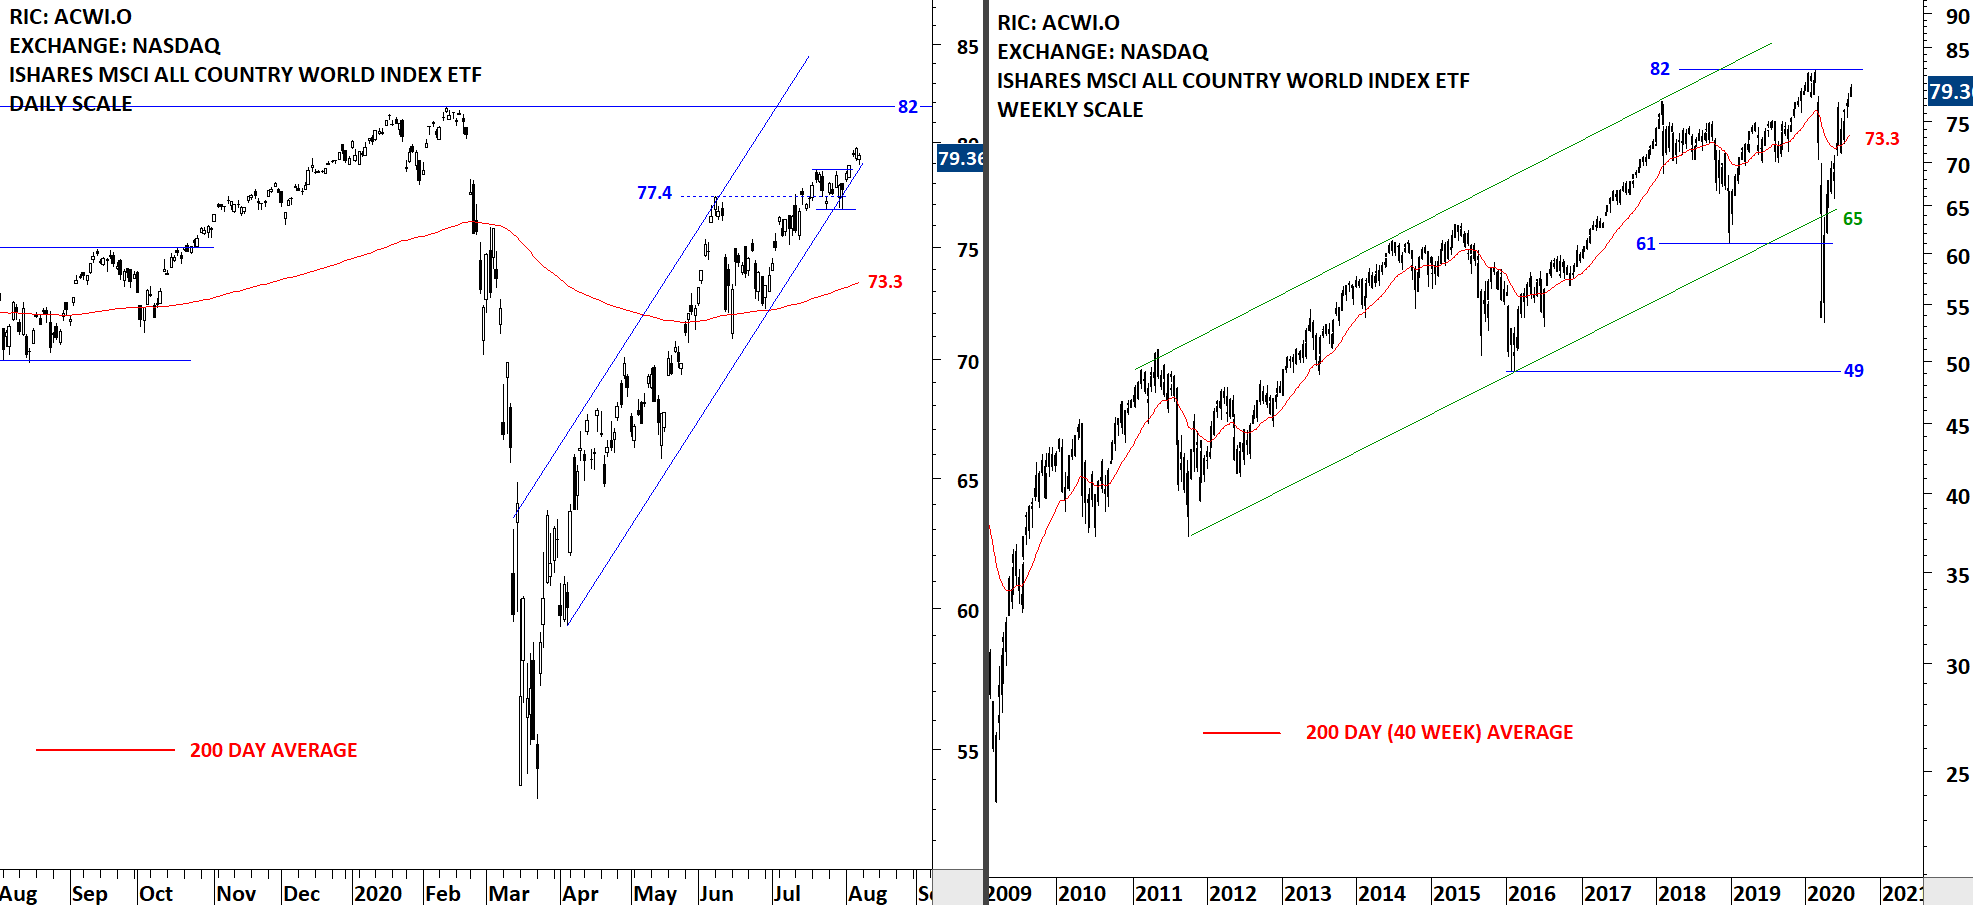
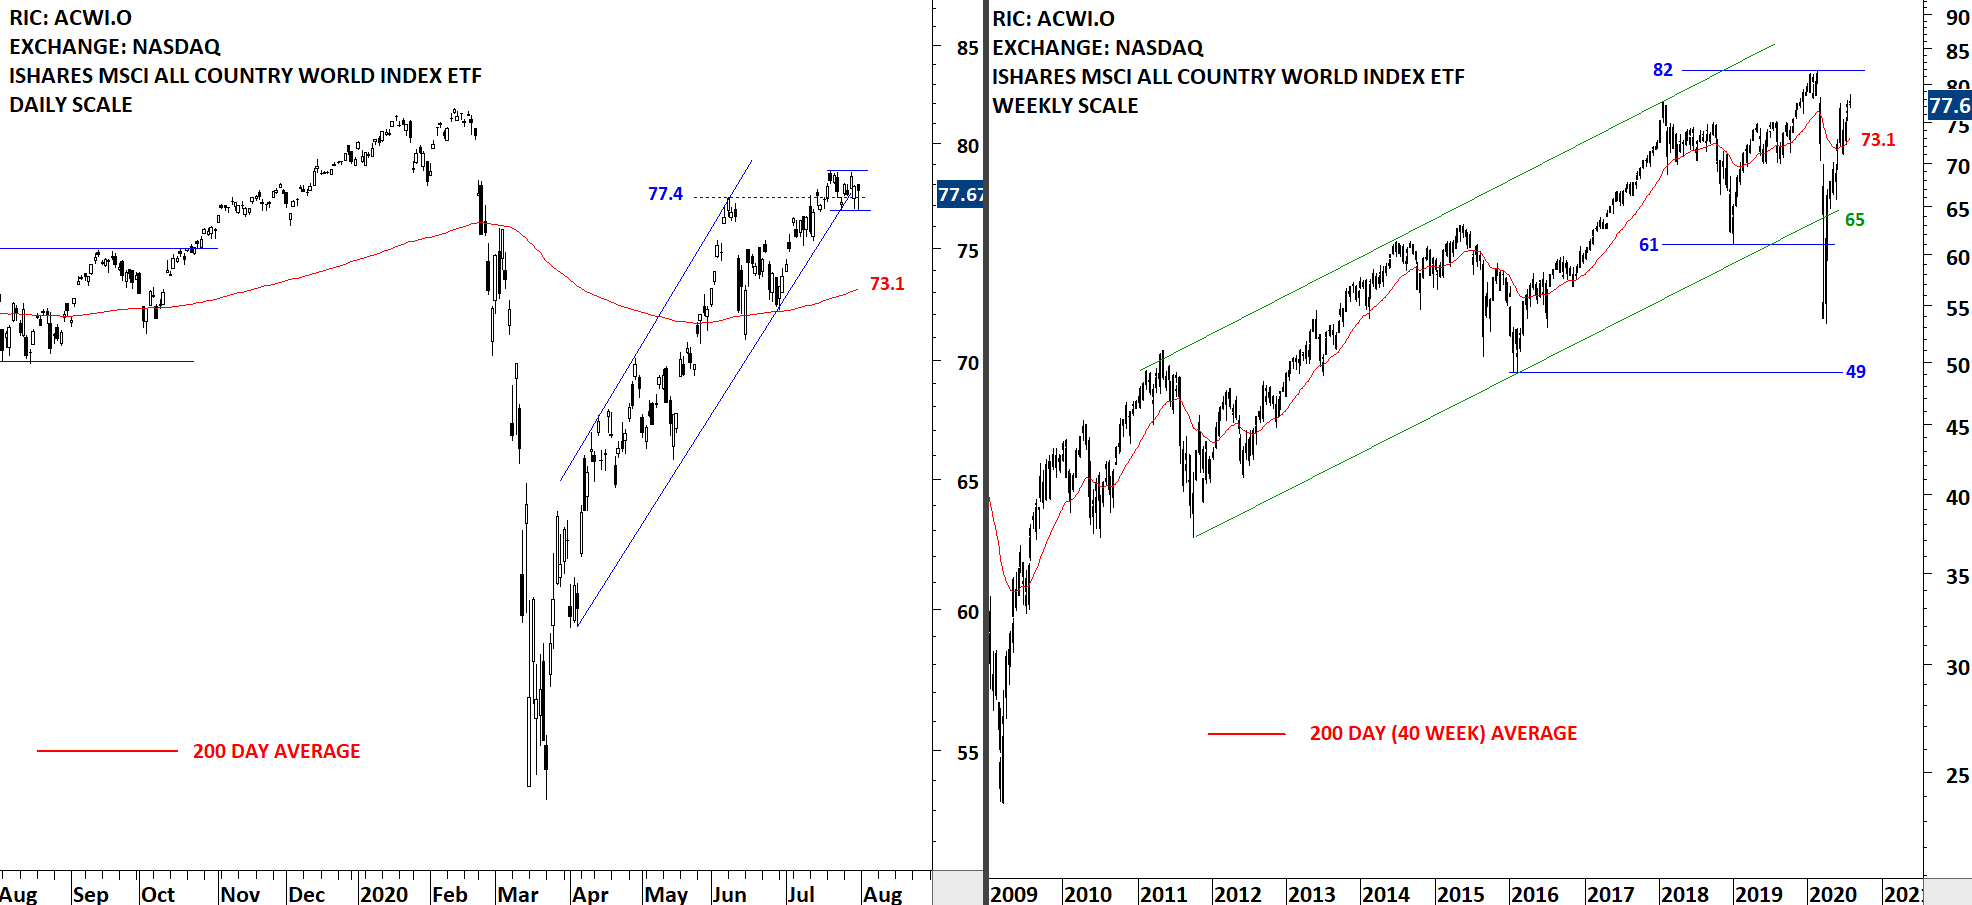
- 200-day average, how to utilize it as a trend-following tool.
- ATR based trailing stop-loss and its application on chart pattern breakouts.
- Follow-up Q&A
- Are there any situations in which you'd enter a trade immediately upon breakout, rather than waiting for the daily close? How about the opposite -- are there situations where you might wait a little longer after a breakout to buy? 25:09
- Do head and shoulders with sloping necklines as reliable as the ones with flat necklines? 27:25
- Would you ignore breakout from chart patterns happening far away from 200dma? 36:47
- Except 200 dma, ATR trailing stop loss, which other indicators you use (if you use) for confirmation of a breakout? 37:35
- Is the 200 dma simple or exponential? What are the pros & cons of one compared to the other? 38:54
- Why the 200EMA and not the 200SMA? 39:20
- Would you track the crossing over of the 50 DMA and 200 DMA? 39:51
- EMA on Weekly or Monthly also? 40:05
- ATR Trailing Stop-Loss – H&S Top
- Breakout with a pullback – Application of ATR trailing stop-loss
- Moving Averages
- You use volatility bandwidth instead of bands? 56:05
- What is the ATR minimum target you will use for bullish or bearish breakouts? 56:31
- What period of EMA would be reasonable to apply on the ATR to identify the volatility. I'm asking this because the volatility usually doesn't change by large amounts in forex. 57:08
- Similarly, what is the BB width do you use for bullish or bearish breakouts? 57:48 (Recommended Reading List)
- Can you apply these same practices to predicting breakdowns for shorting? 58:18
- Do you use these patterns mainly for stocks/equities or futures/options as well? If yes, then how do you manage the risk for F&O? 58:35
- Has Brent crude oil broken downwards from a wedge pattern today? 59:14
- Please post charts of the companies listed in the US when you post it when listed in Asia or any other country. For example, when you post a chart for Dr.Reddy's Lab, India listed is also listed in the US under ticker RDY along with the chart for Dr. Reddy's, etc. 59:26
- Do you use price charts with adjusted dividend data or without adjusted dividend data. What is the reason preferring one over another? 1:01:26
- Why don't you use volumes in your charts? Can you please explain the reasons? 1:03:14
- While trading in forex, the 3% breakout rule doesn't seem to apply. Are you aware of any specific measure which could be followed in forex like in terms of pips or percentage? 1:05:24
- Just like me, your methods of based heavily on the classical methods on TA. Do you use any automation to scan for classical pattern s on Metastock? I don't think that such automation to scan classical pattern is possible -- and on the other h and, manual flipping of charts is extremely time-consuming. 1:06:10
- Do you use that ATR Trailing in MetaStock with a special indicator? 1:07:50 (ATR trailing stop-loss plug in for MetaStock)
- How did you determine the best stoploss ATR? 1:08:46
- When is the best time to enter a trade? Just a few minutes before the closing or the day after at opening? 1:09:25
- Do you check the relation between volume and the price when deciding to enter or exit the position? 1:10:41
- Why do you like Metastock rather than other websites? Any strong reasons? 1:11:16