REVIEW
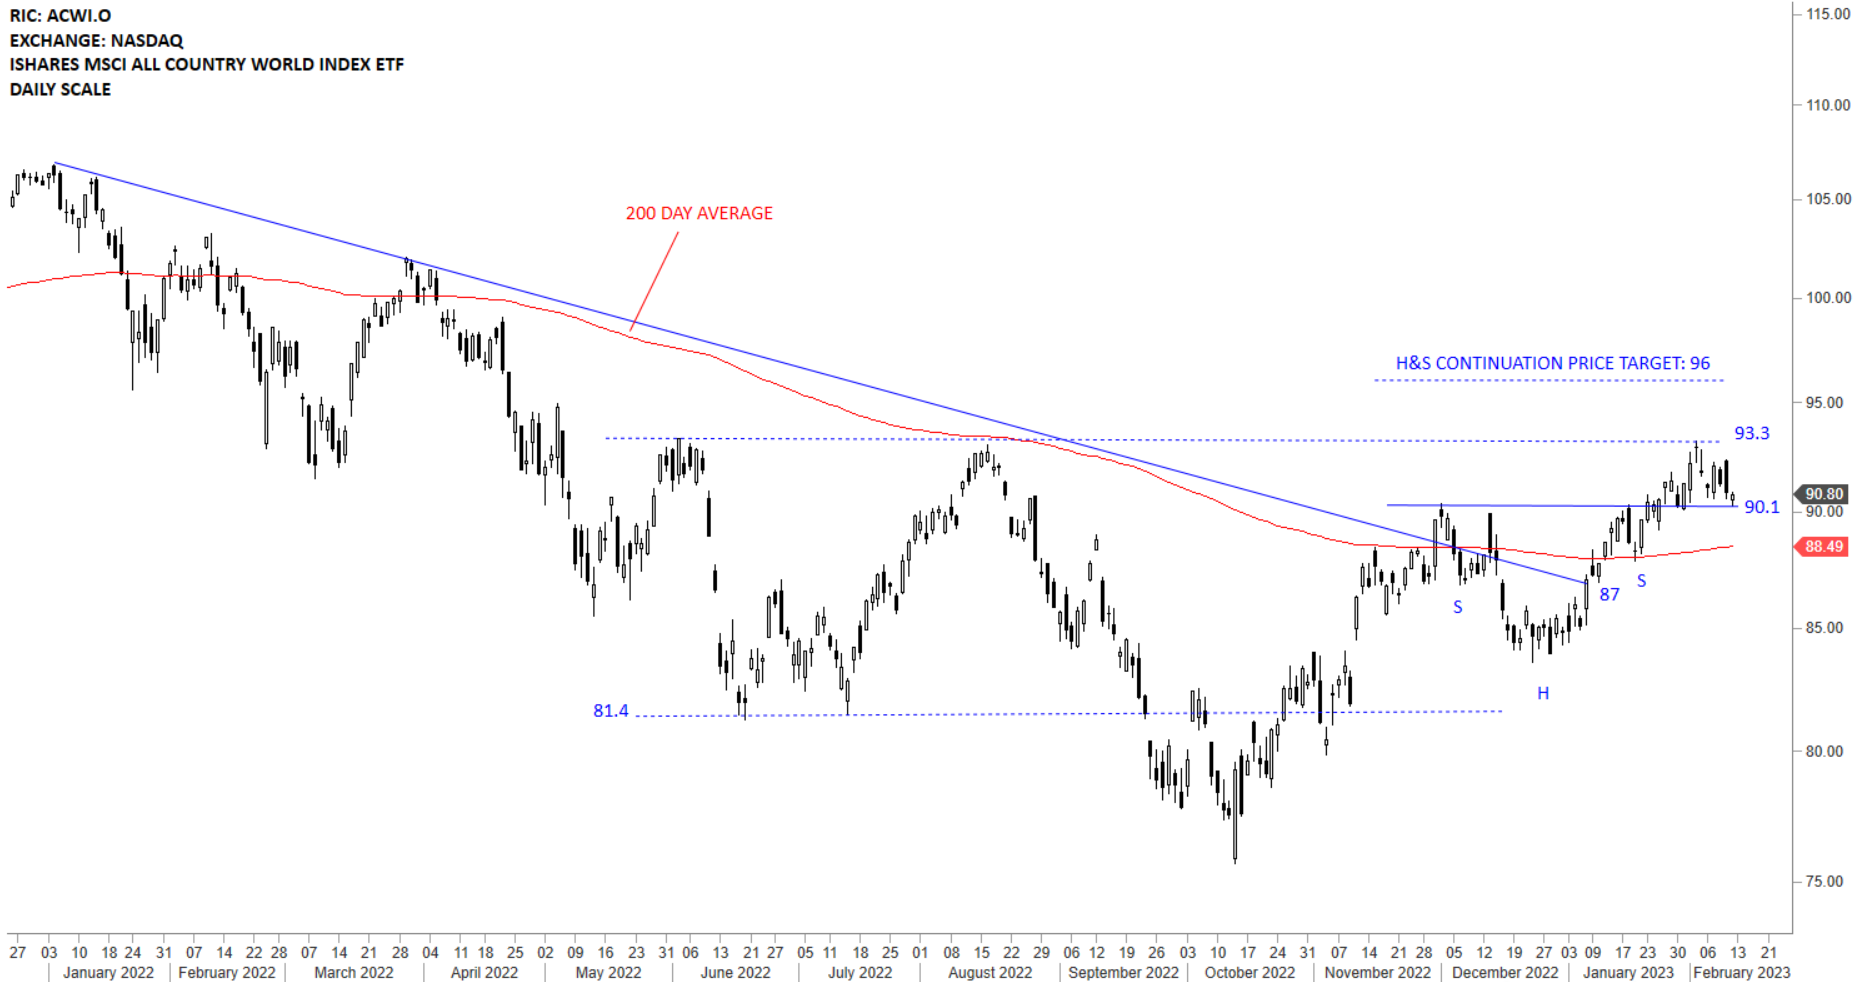
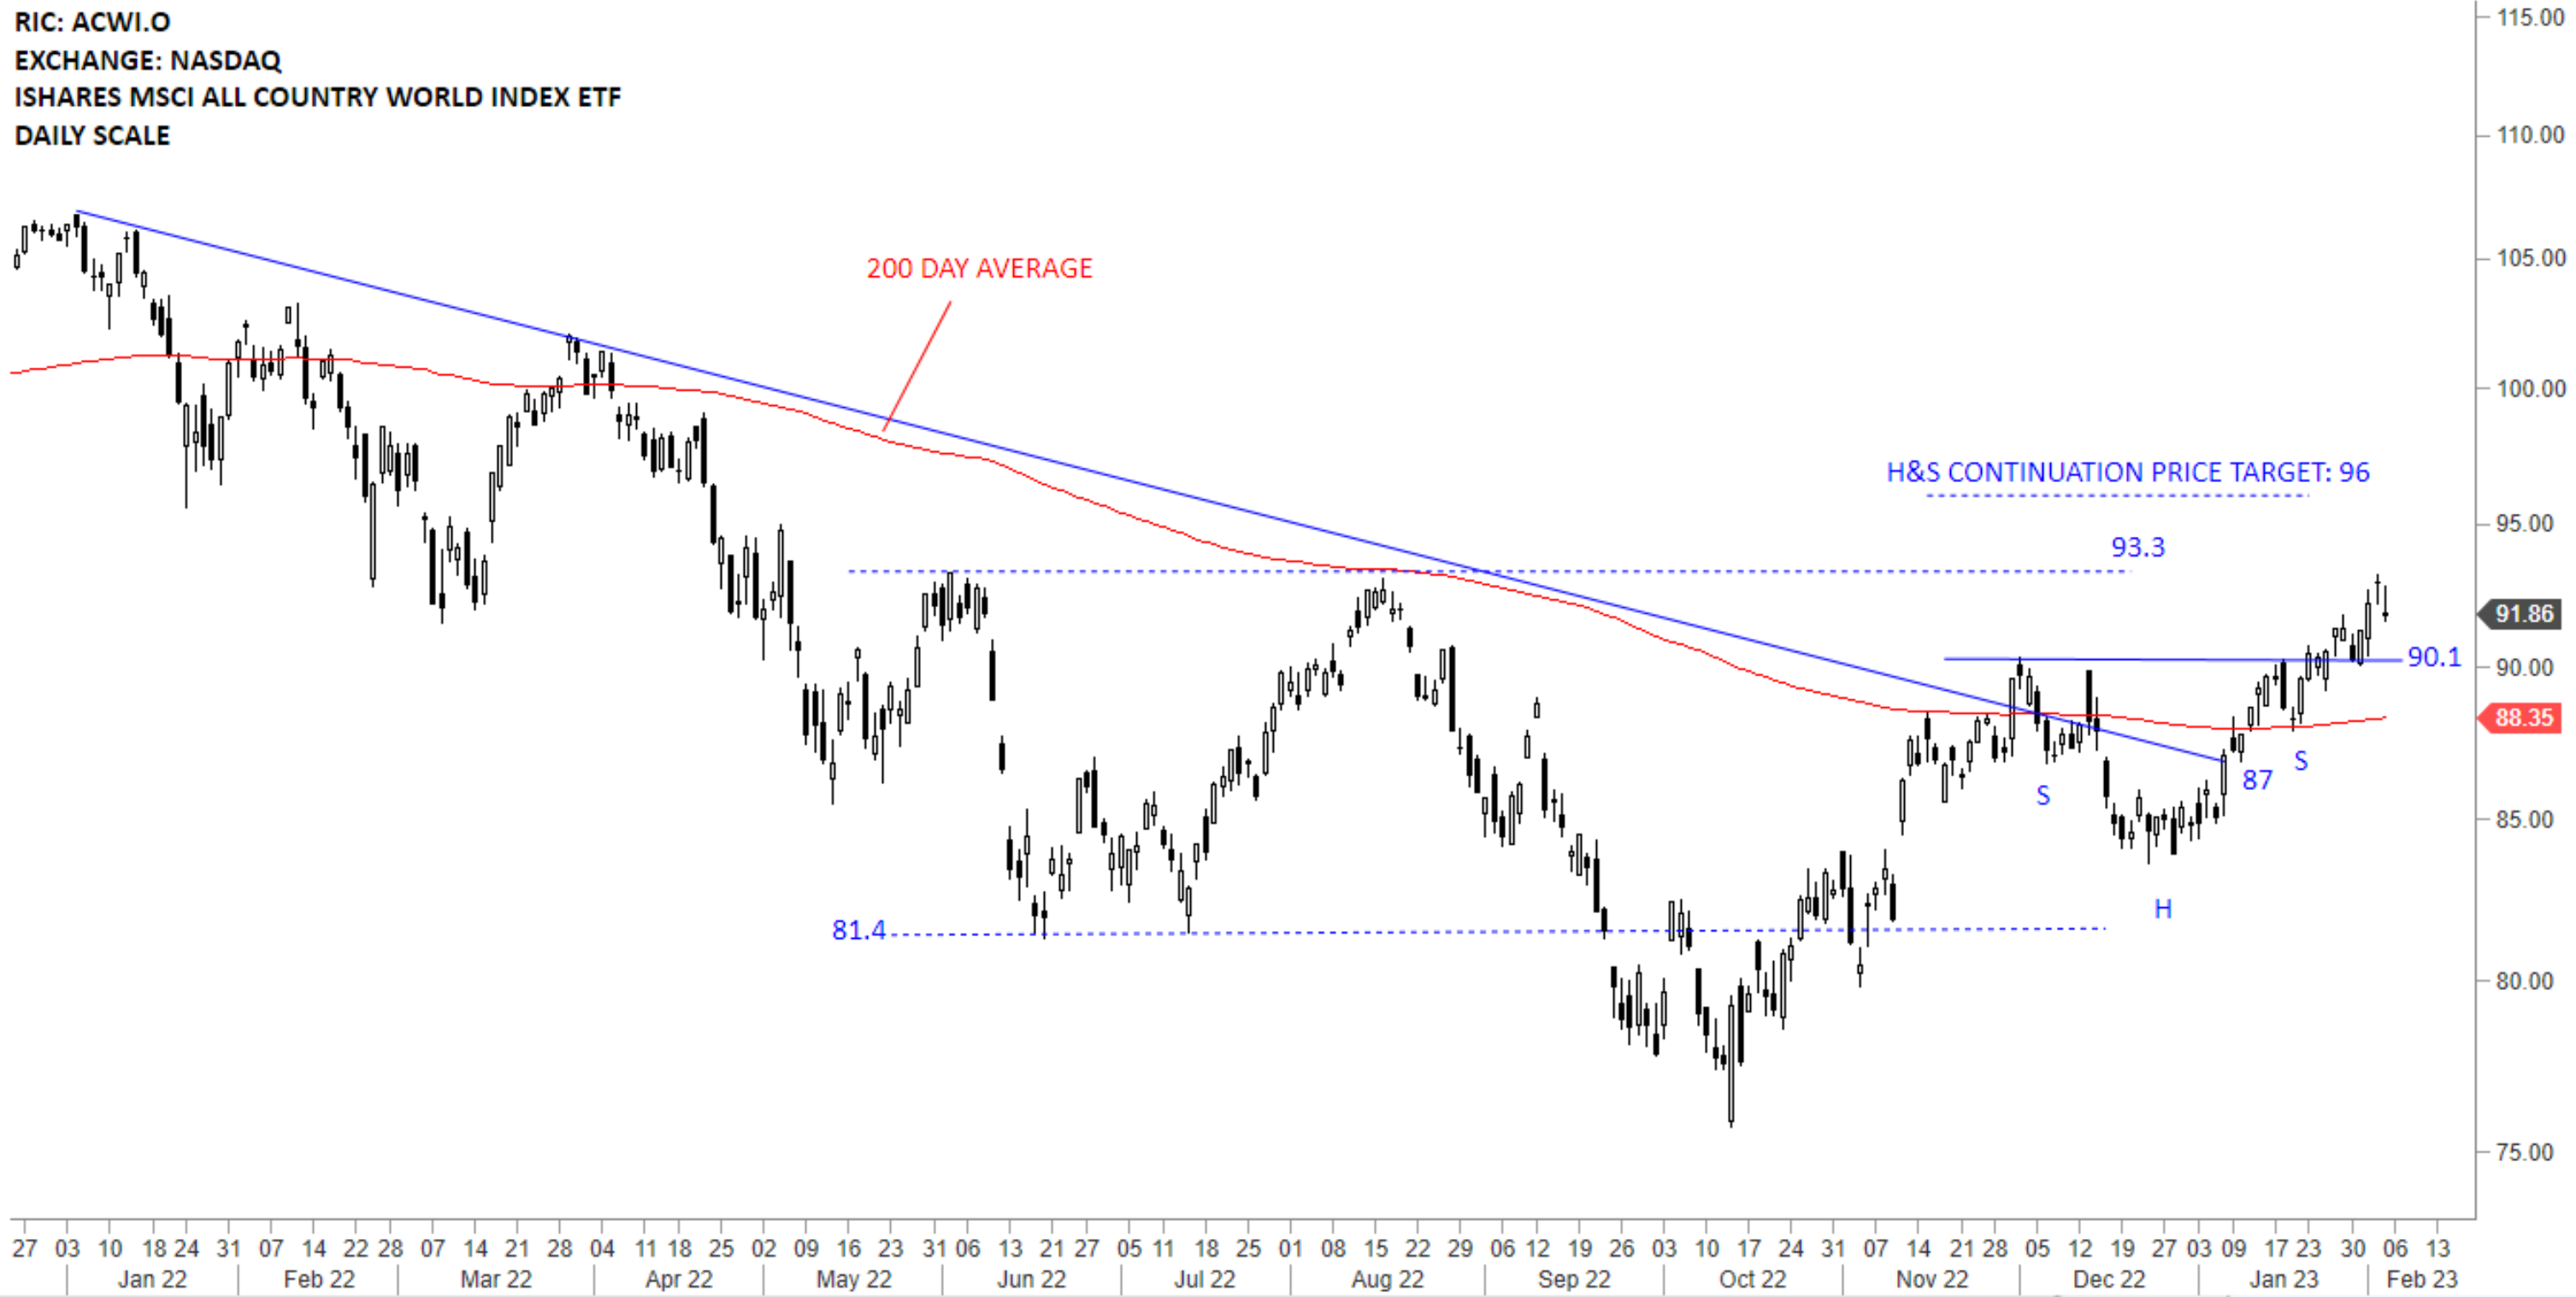
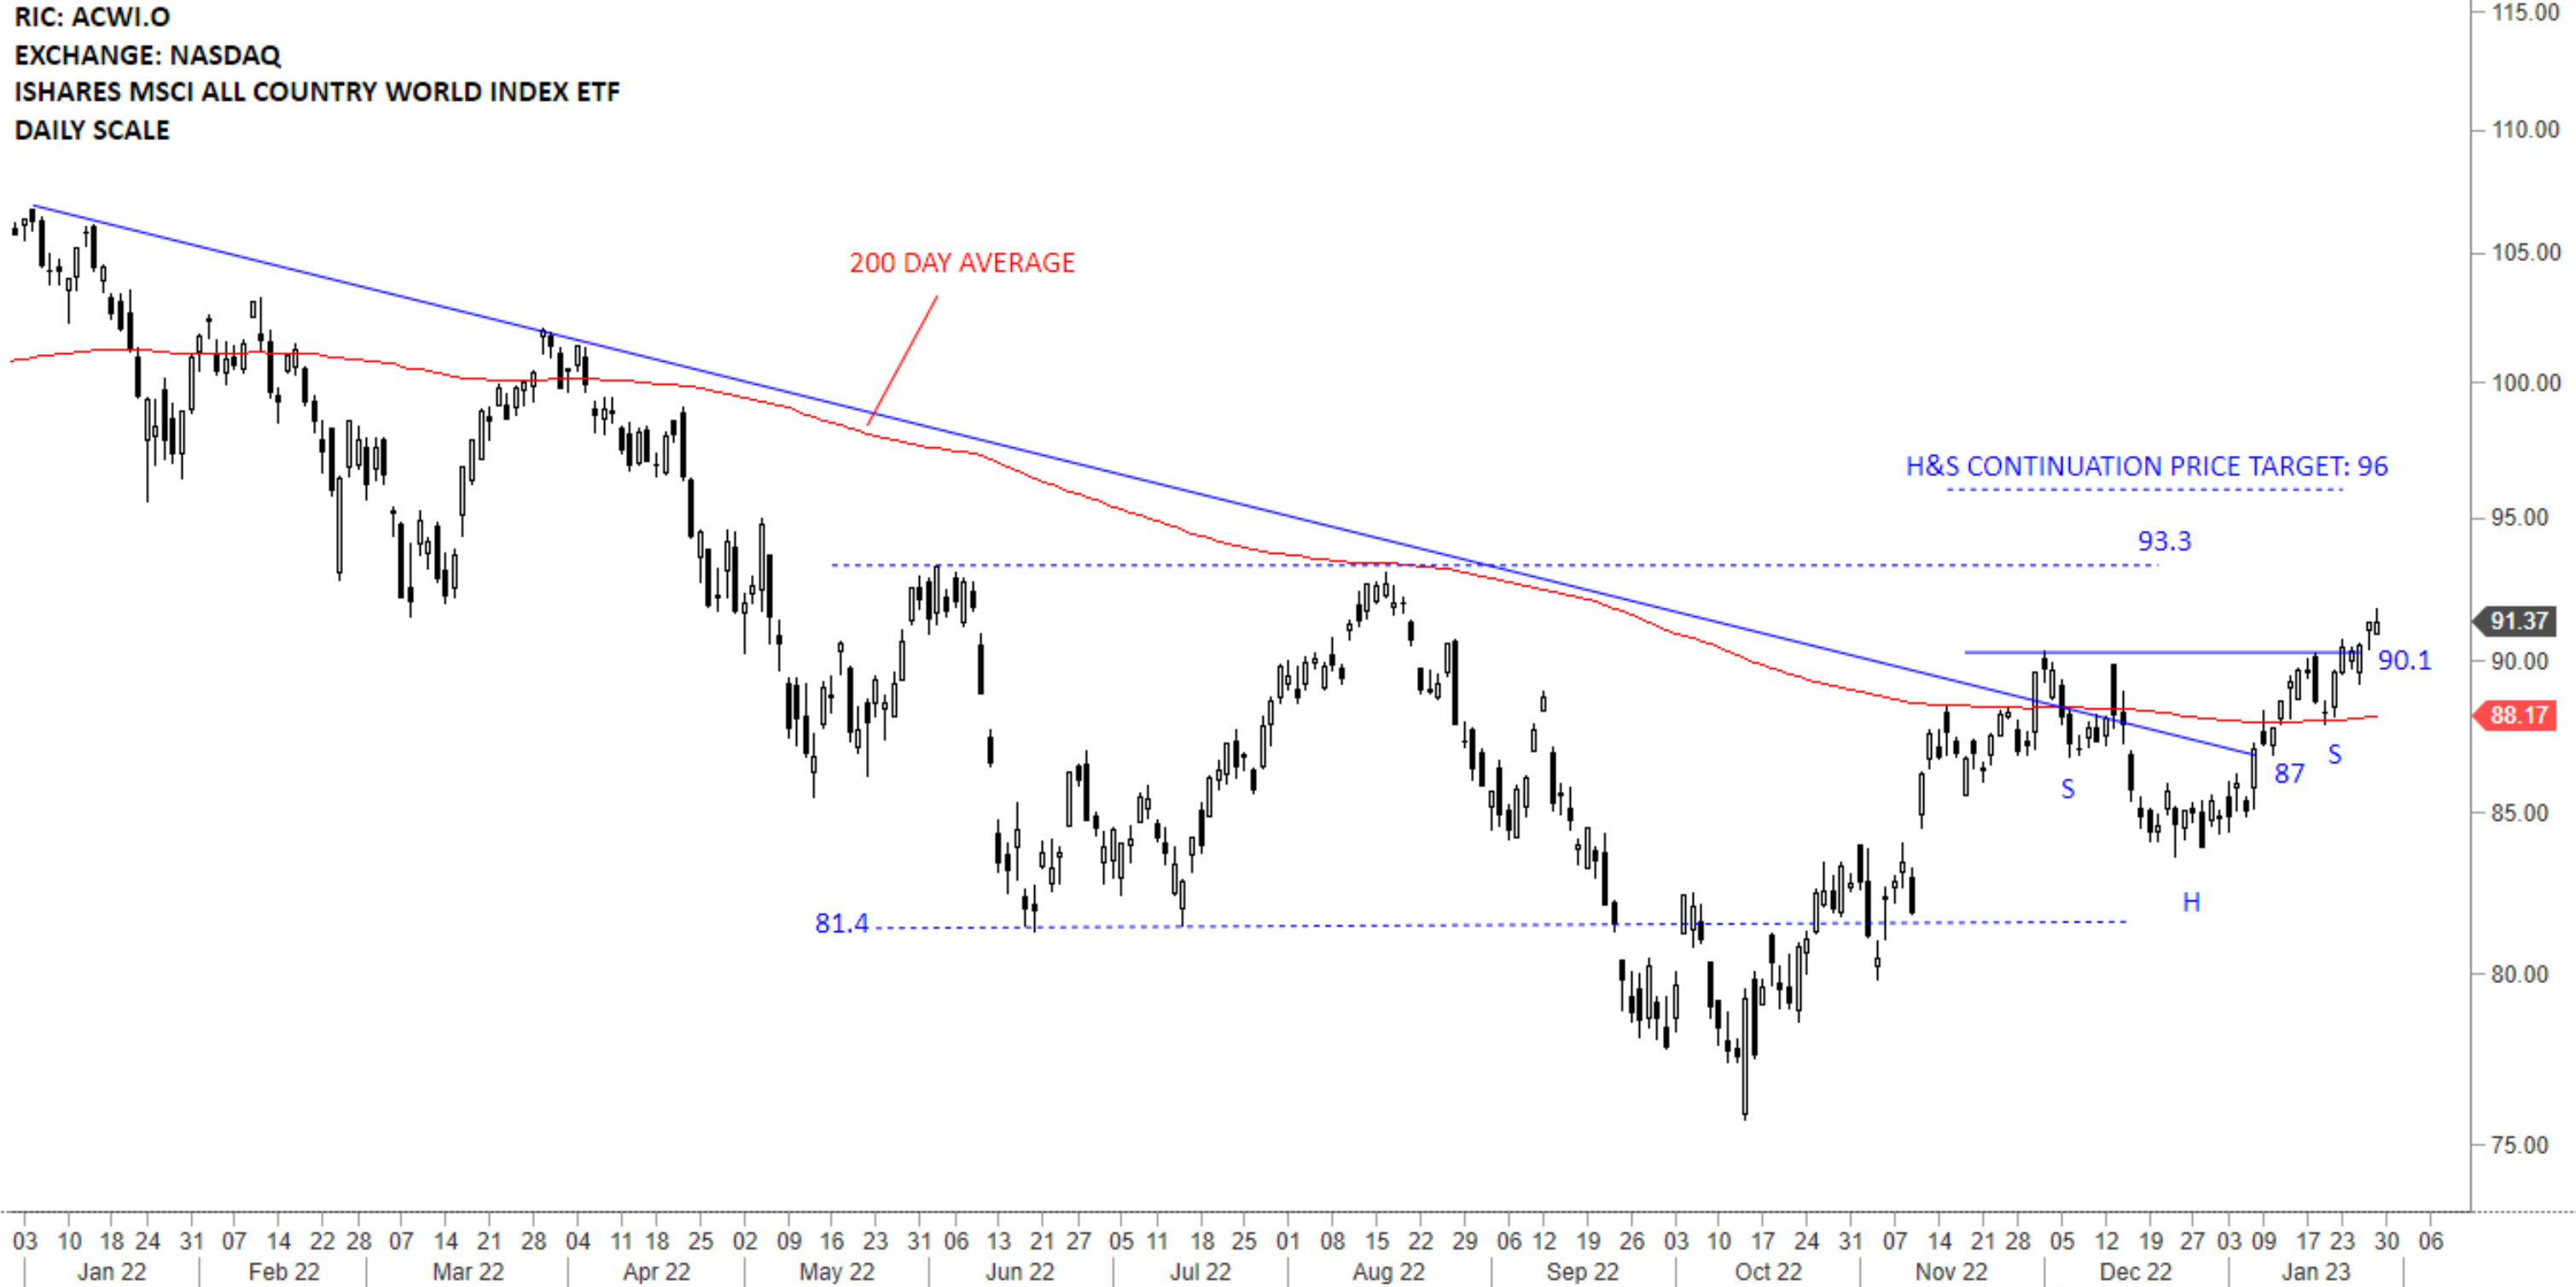
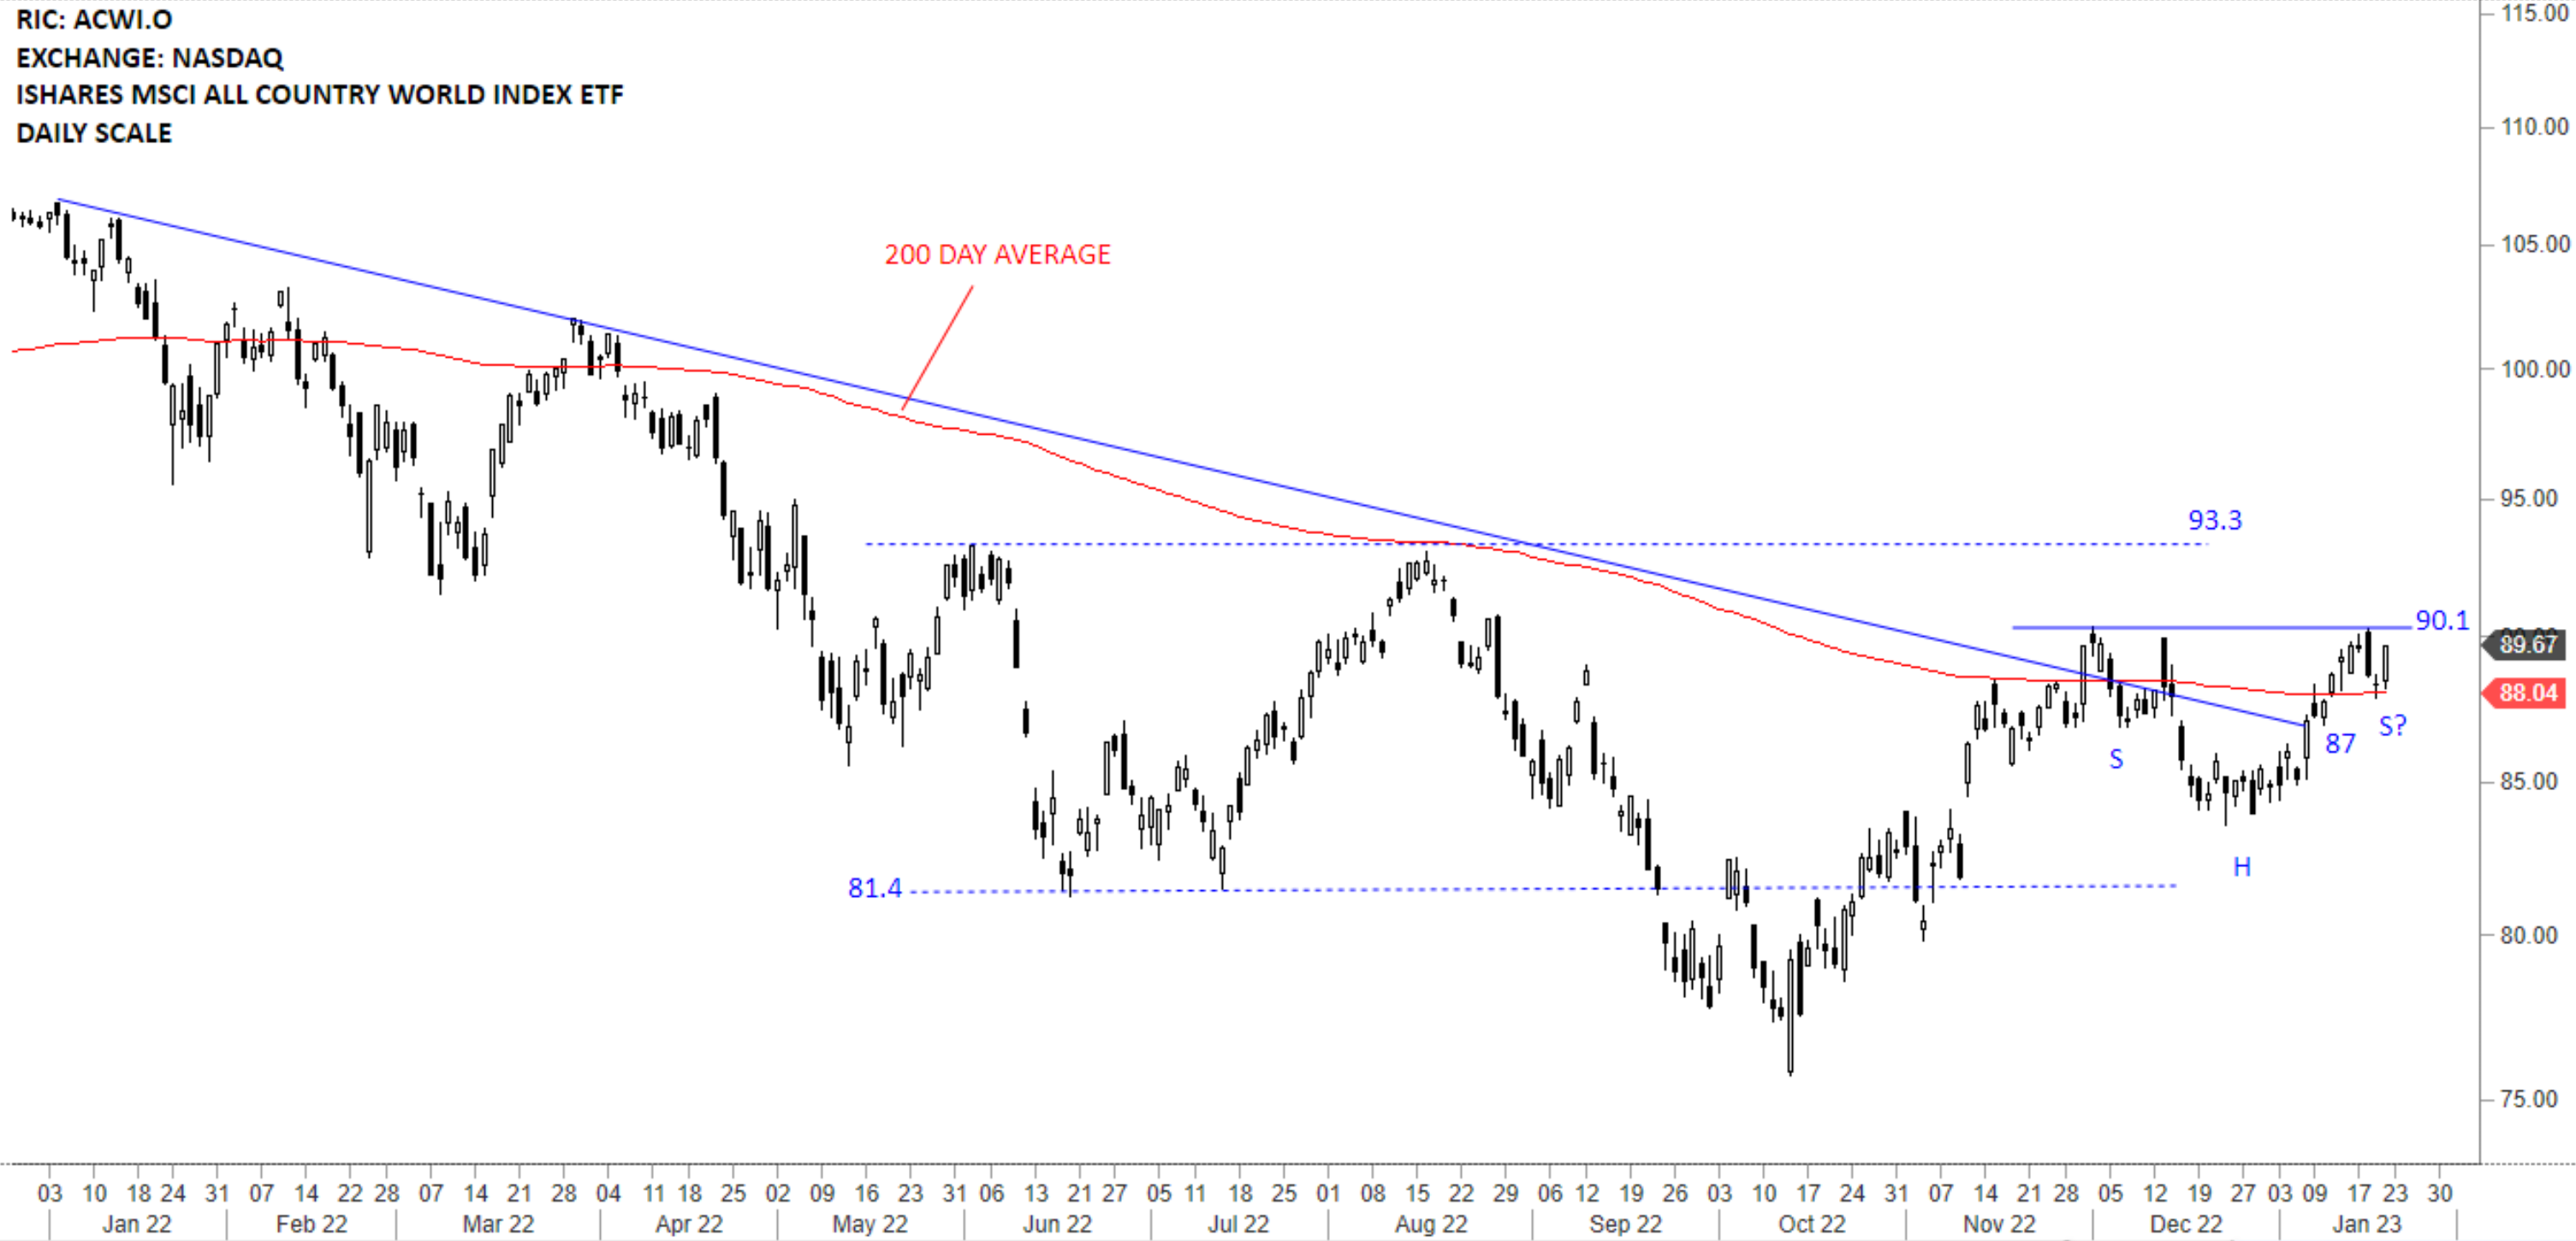
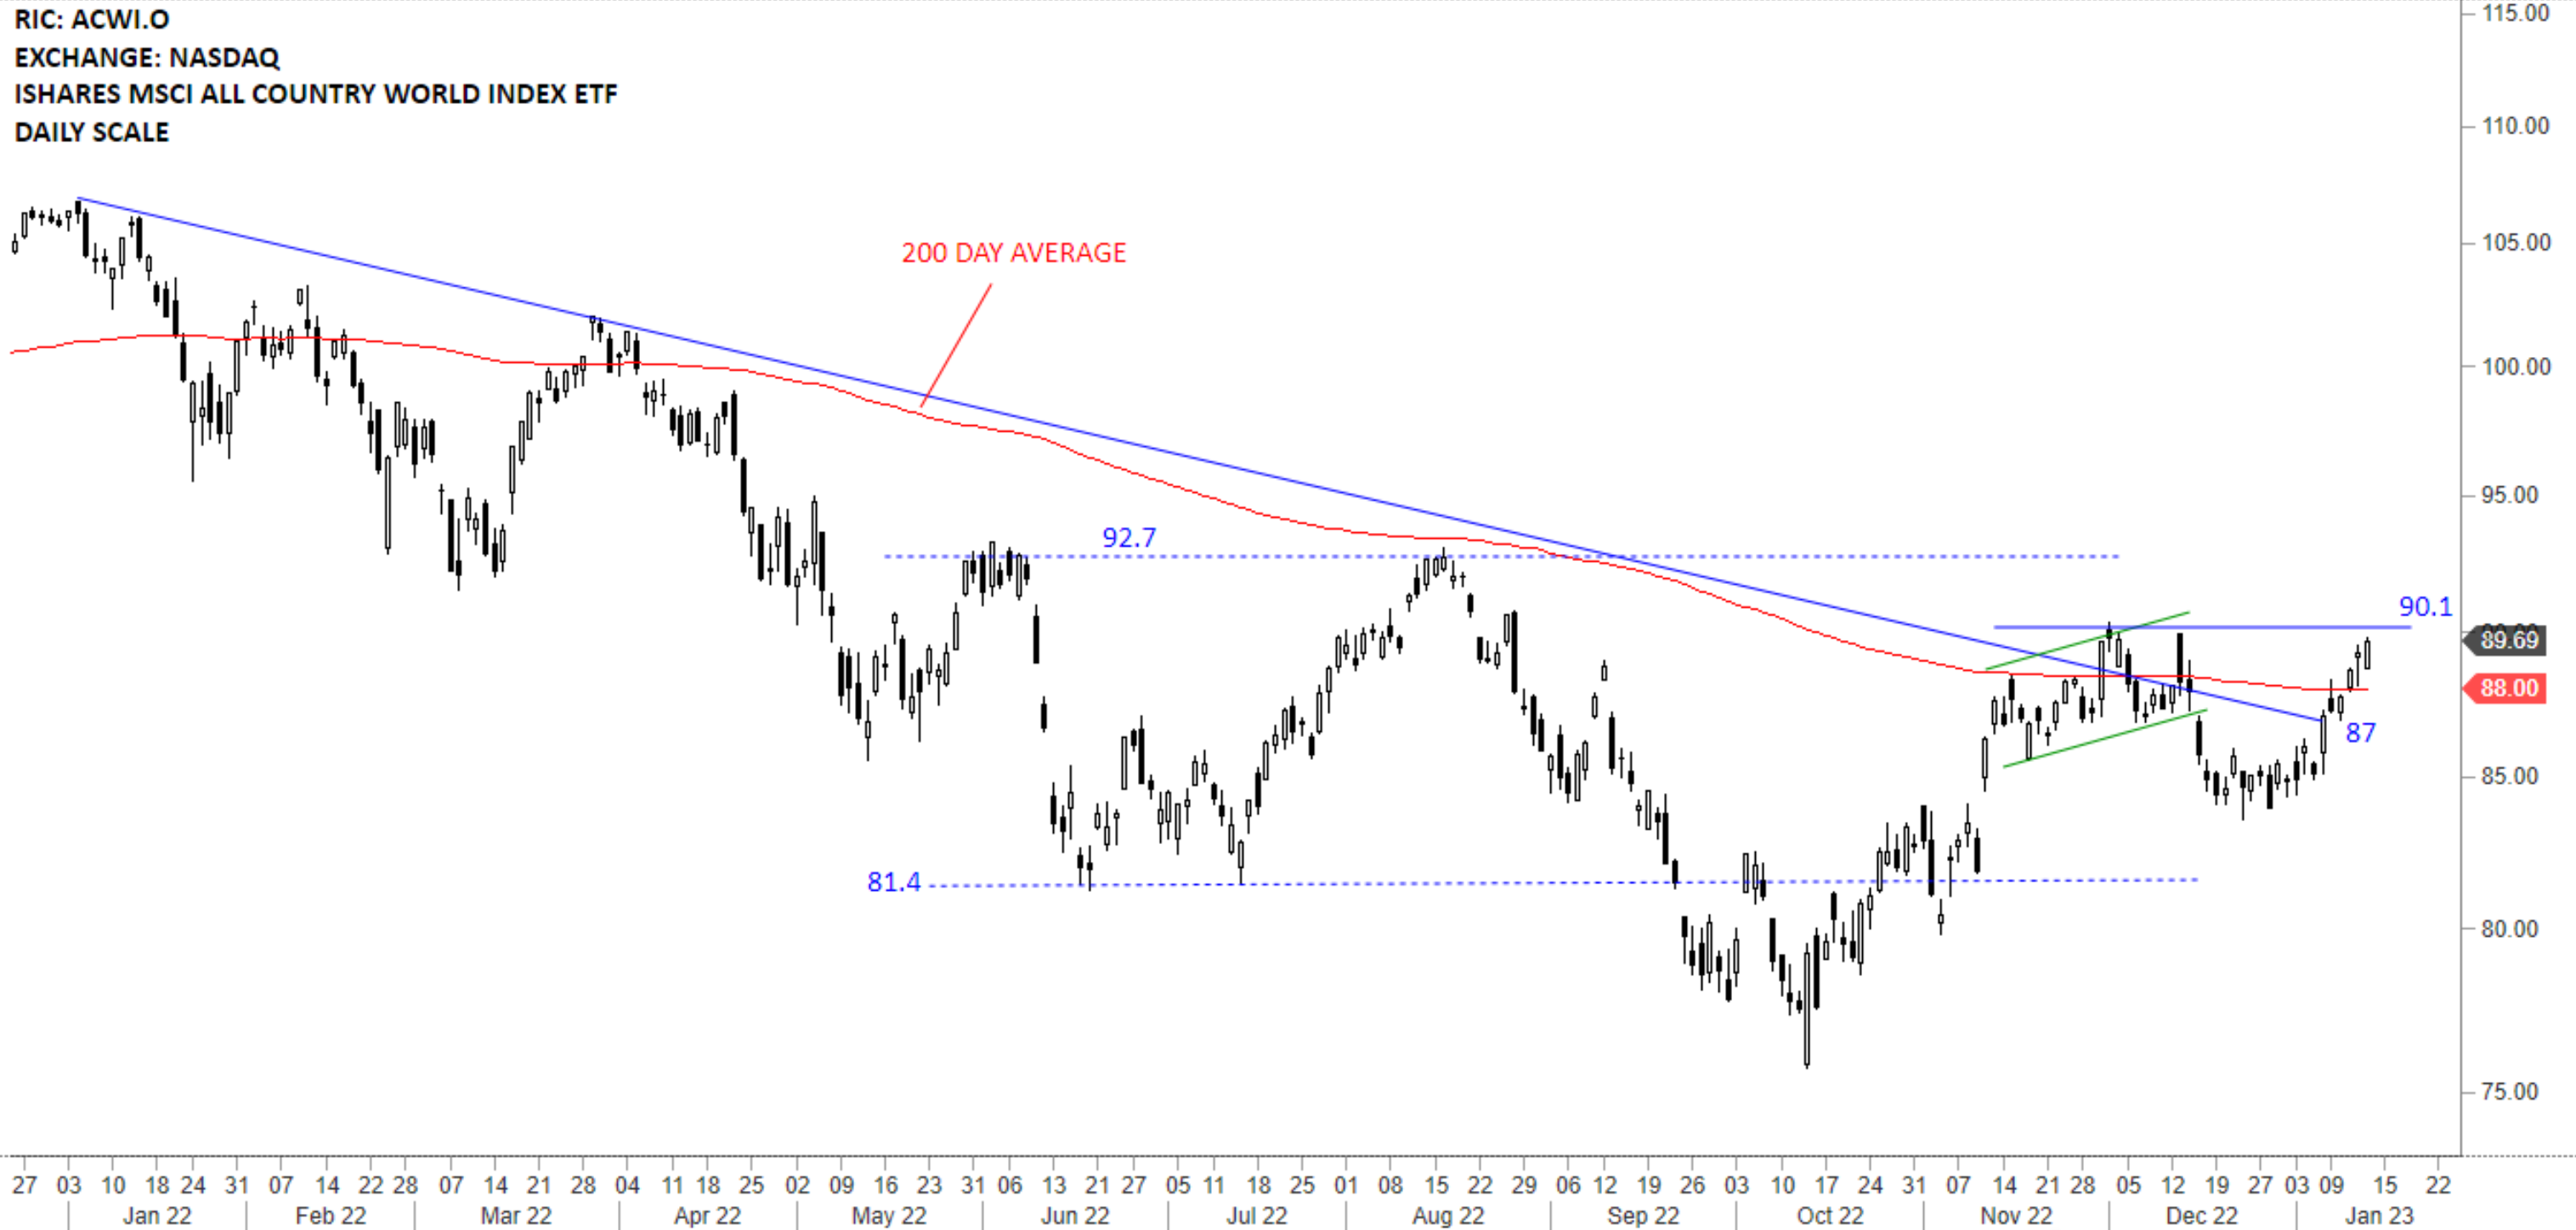
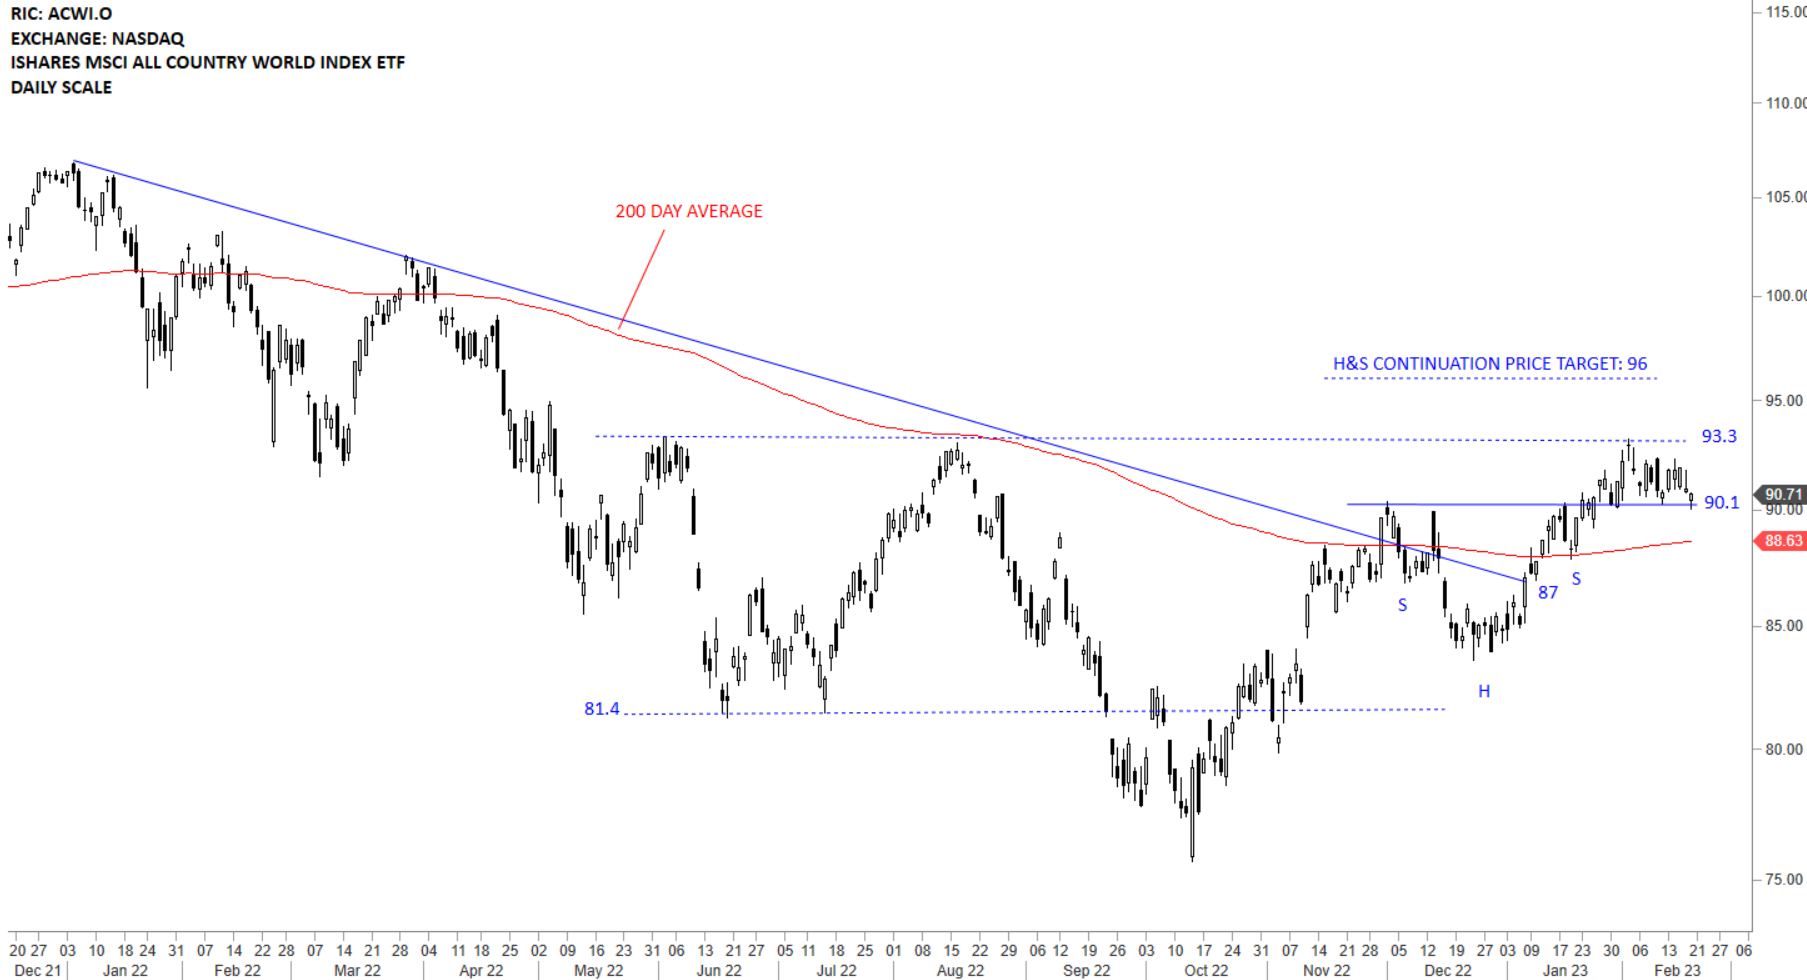
The benchmark for the Global equity markets performance, the iShares MSCI All Country World Index ETF (ACWI.O) cleared its short-term horizontal resistance (90.1) after holding above the 200-day average. 90.1 acted as the possible neckline of a H&S continuation. It is important for the equity benchmark to hold above its 200-day average and the neckline between 88.49 and 90.1 levels. H&S continuation price target stands at 96 levels. This week's price action can act as a pullback to the broken neckline. This is now the second test of the neckline over the past 2 weeks.
 Read More