GLOBAL EQUITY MARKETS – April 23, 2022

REVIEW


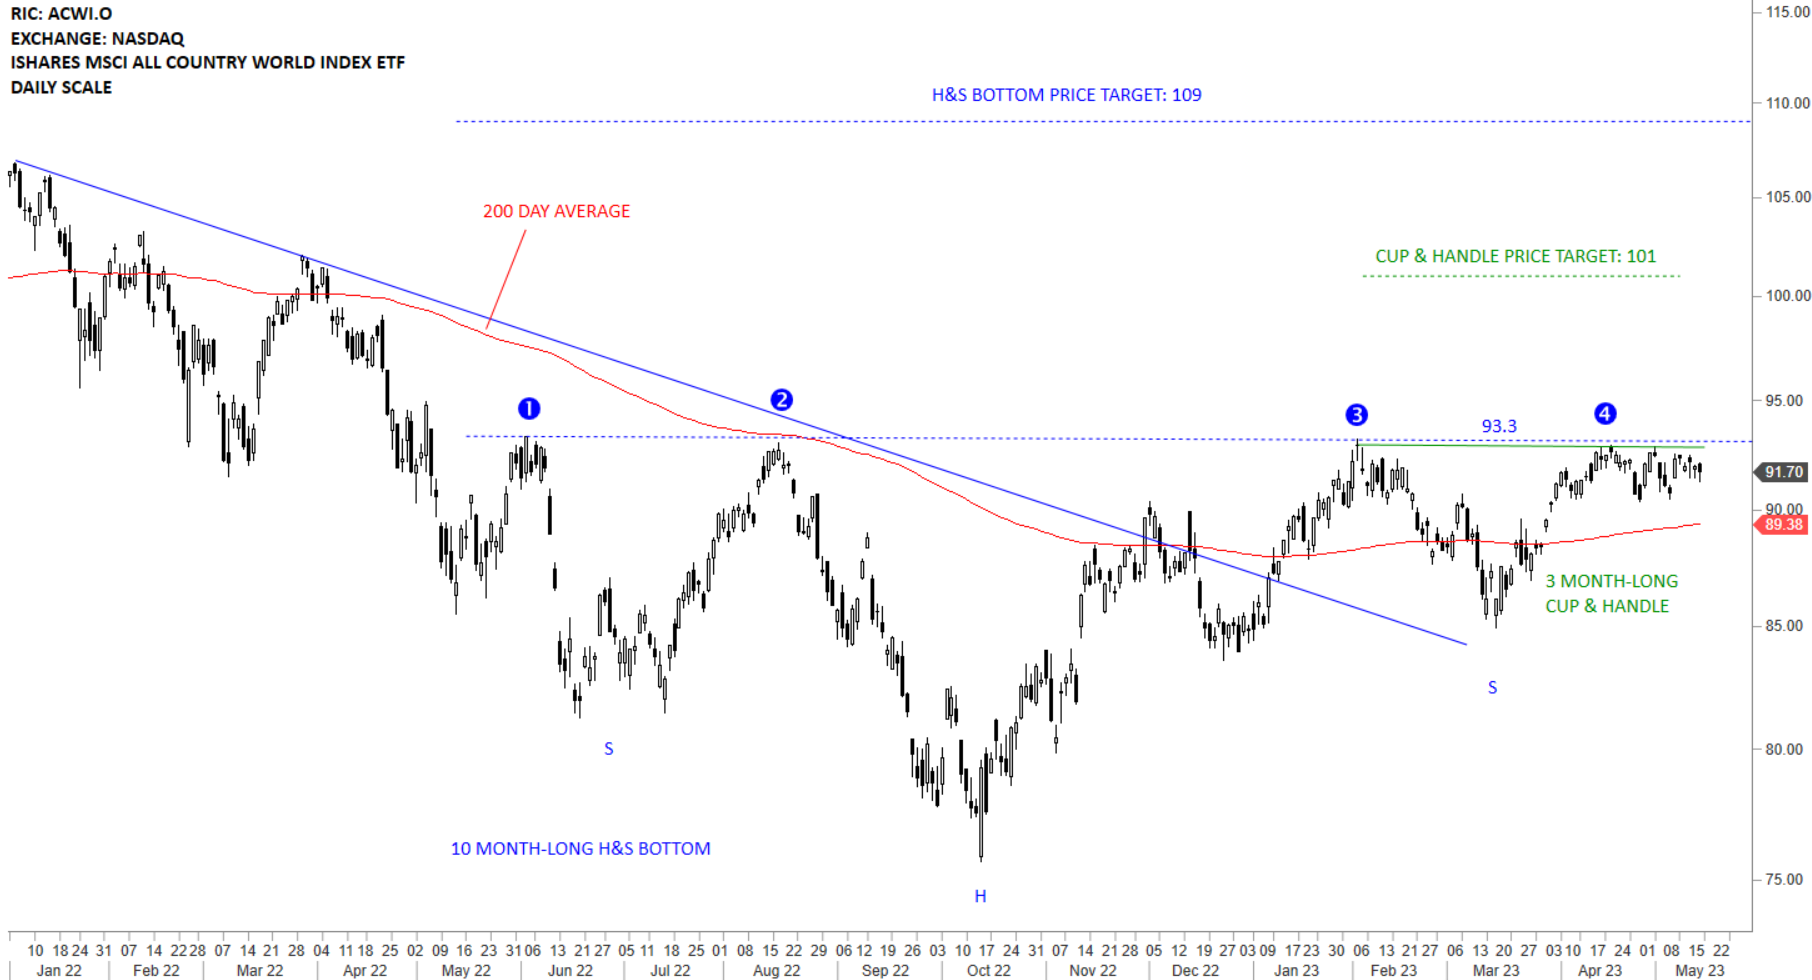
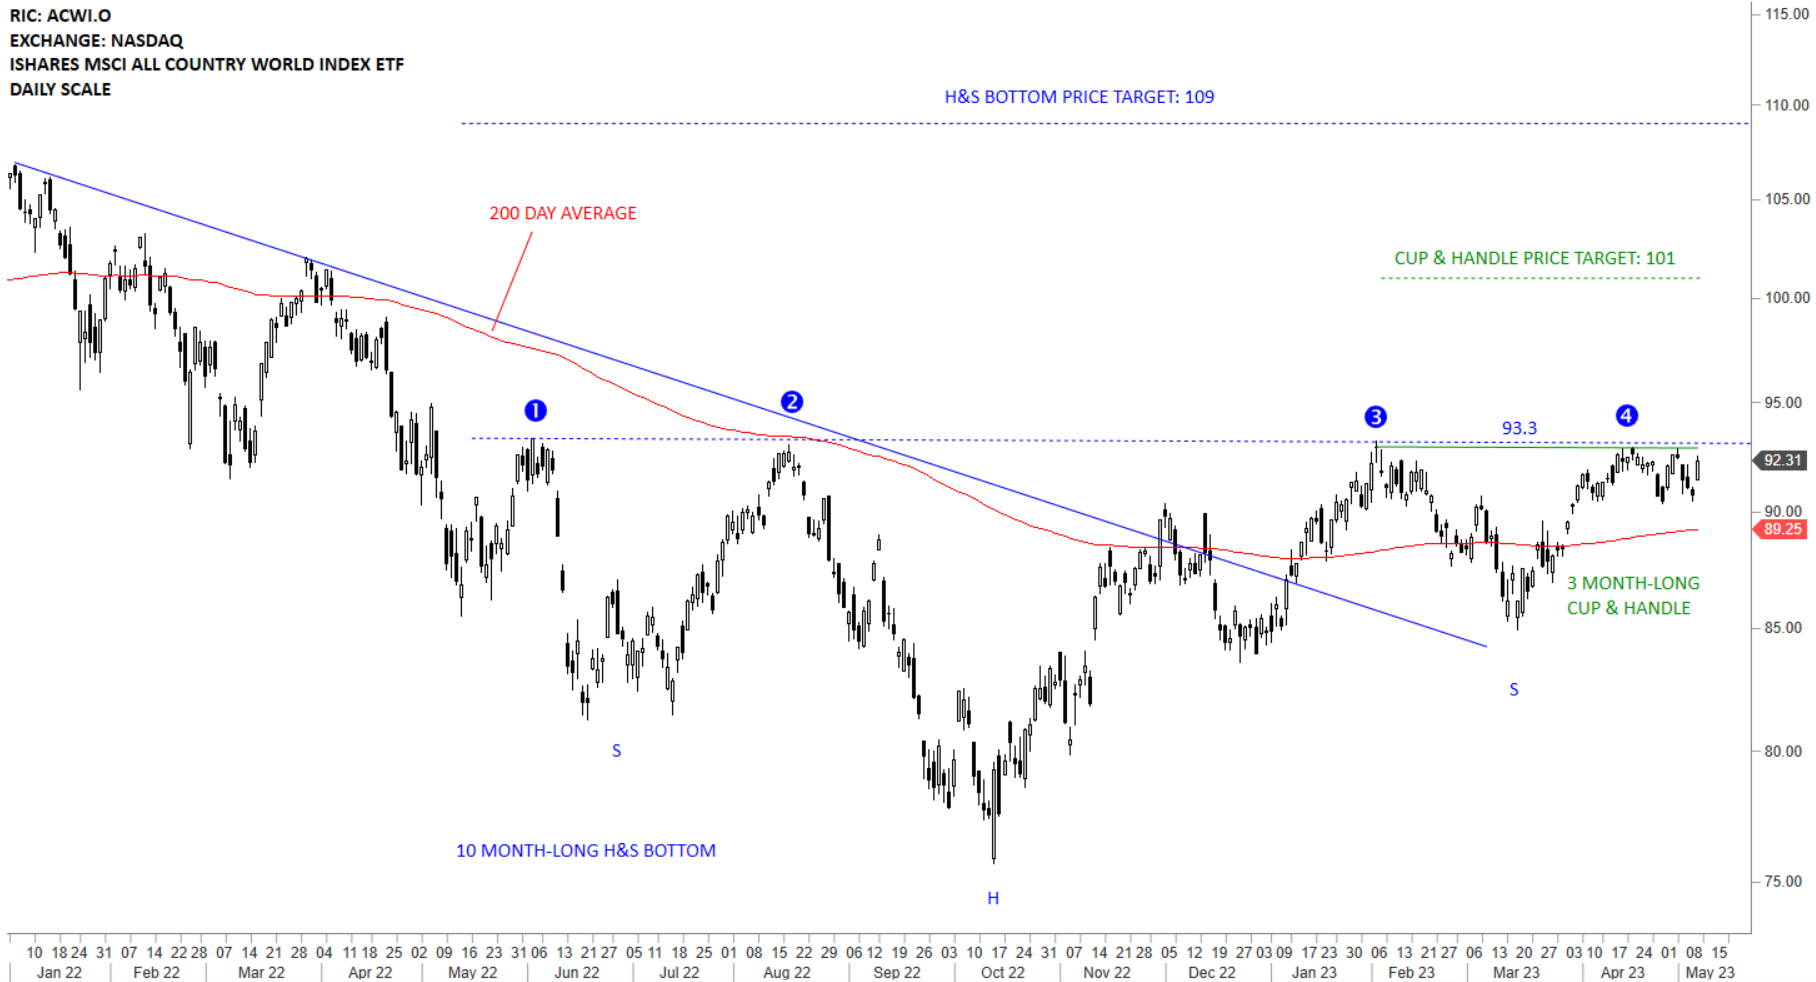
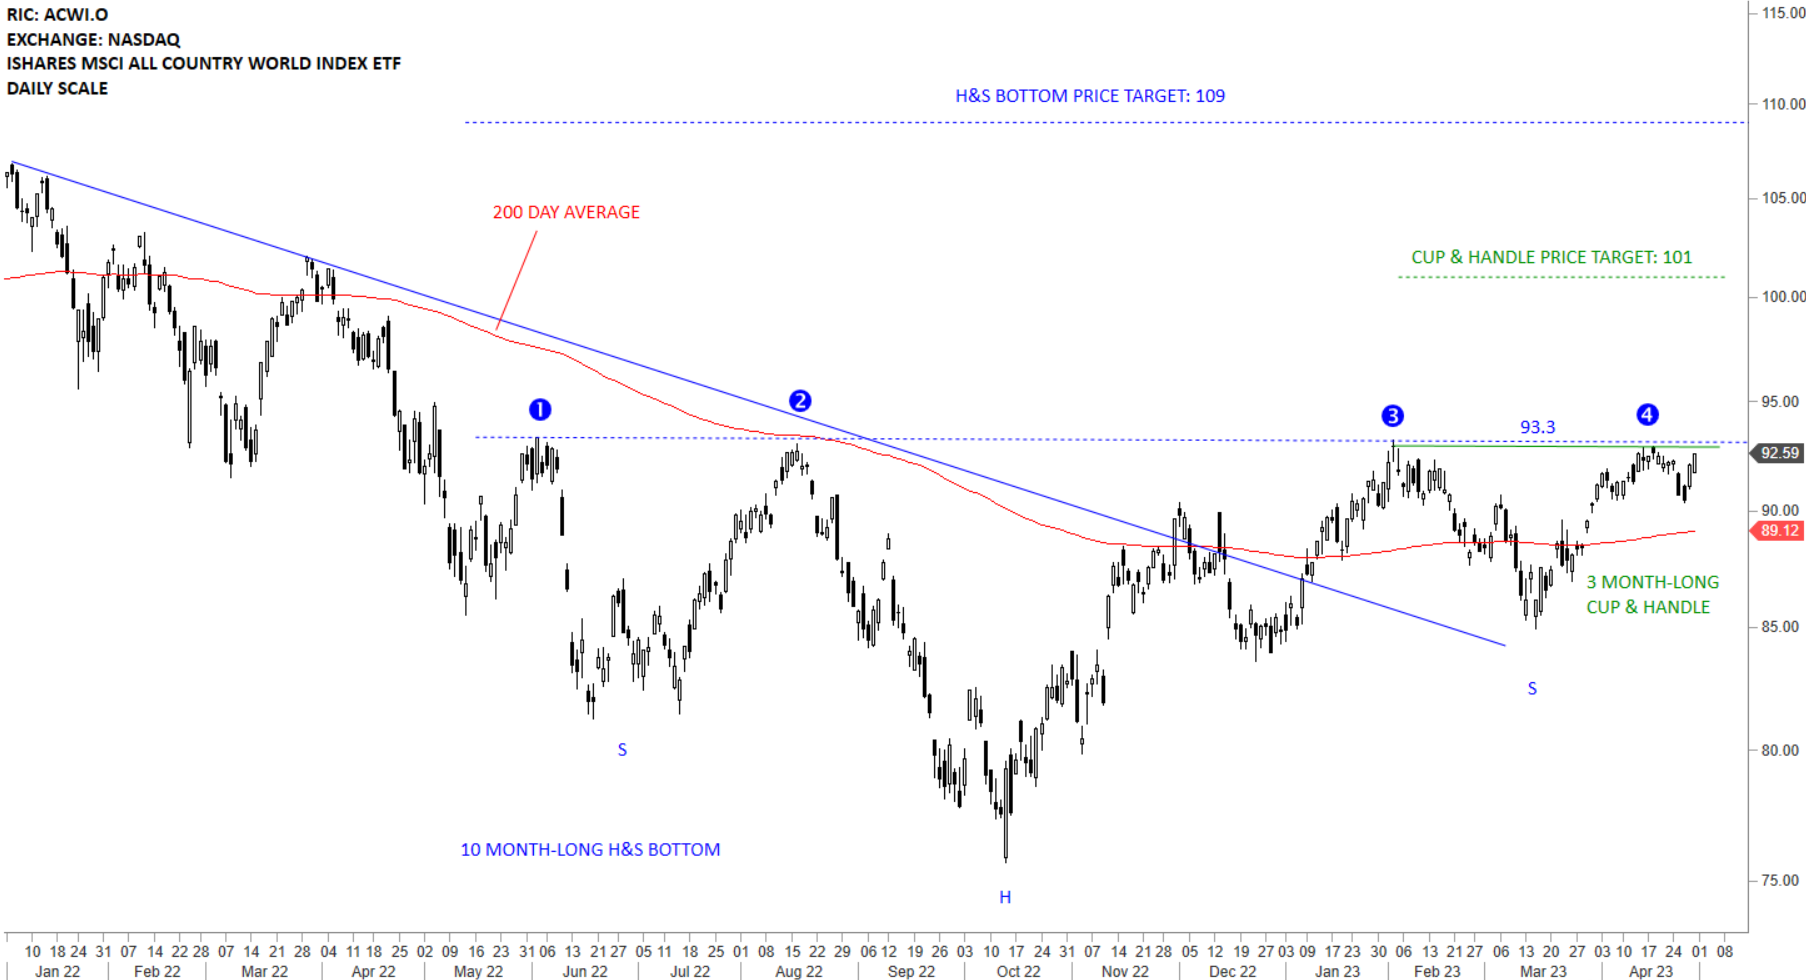
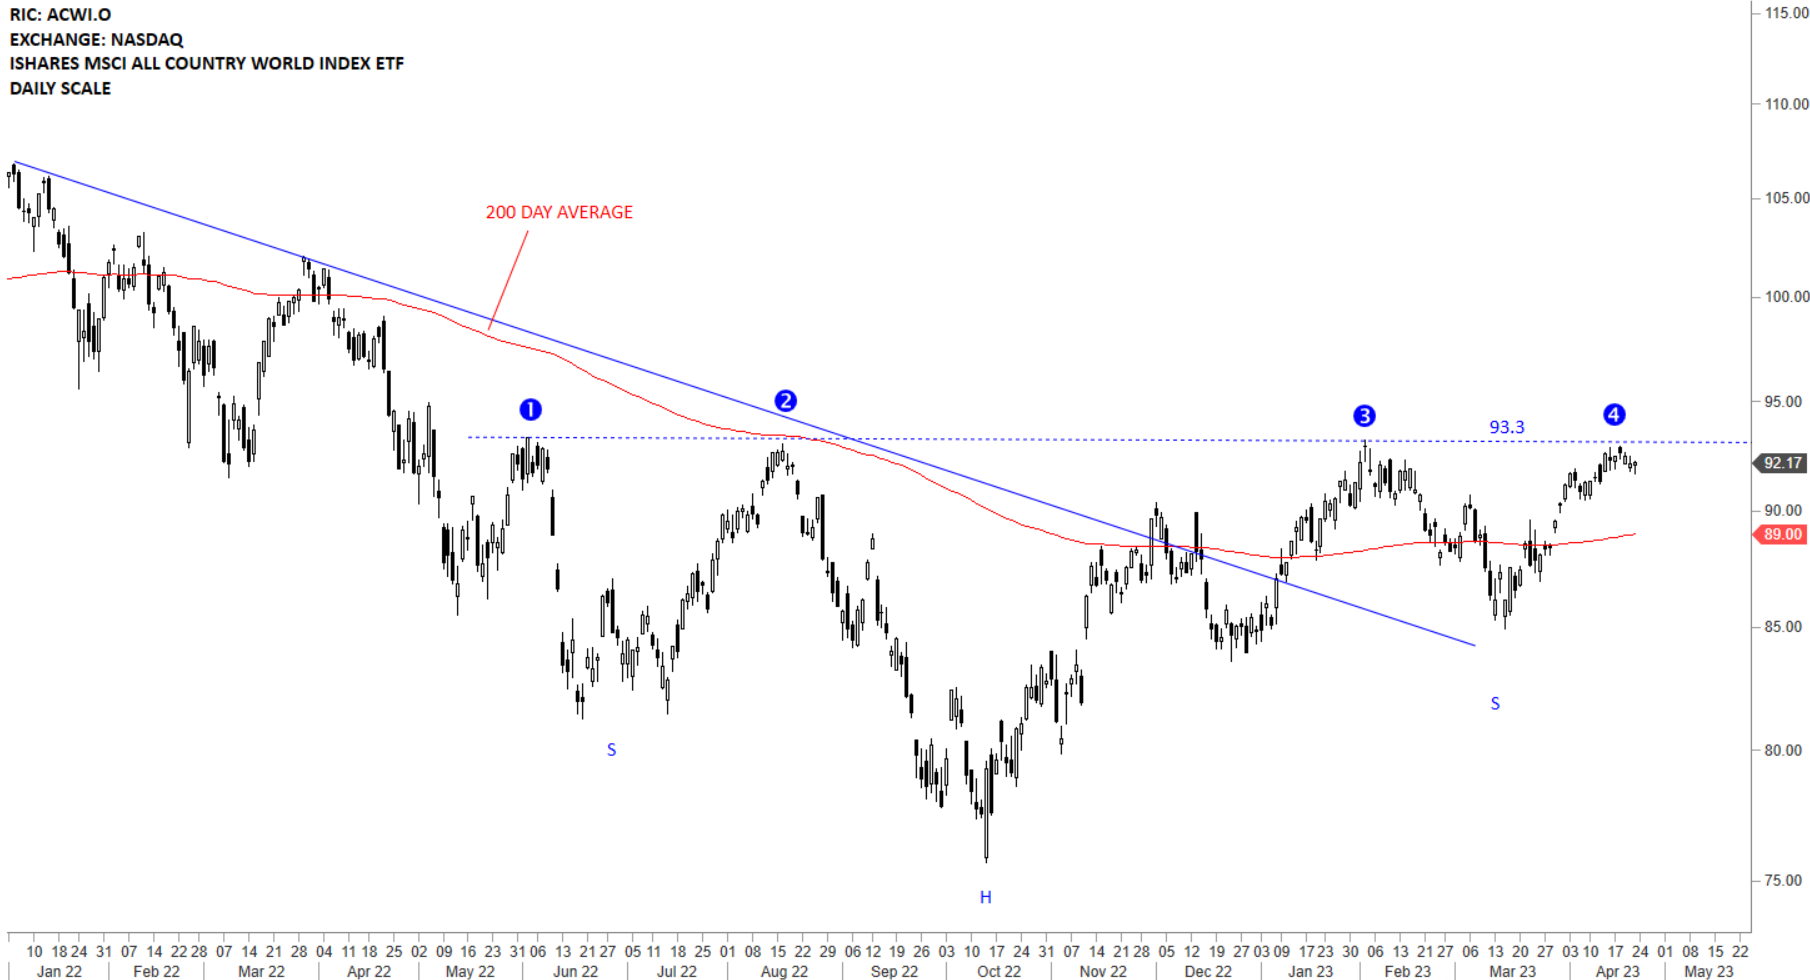
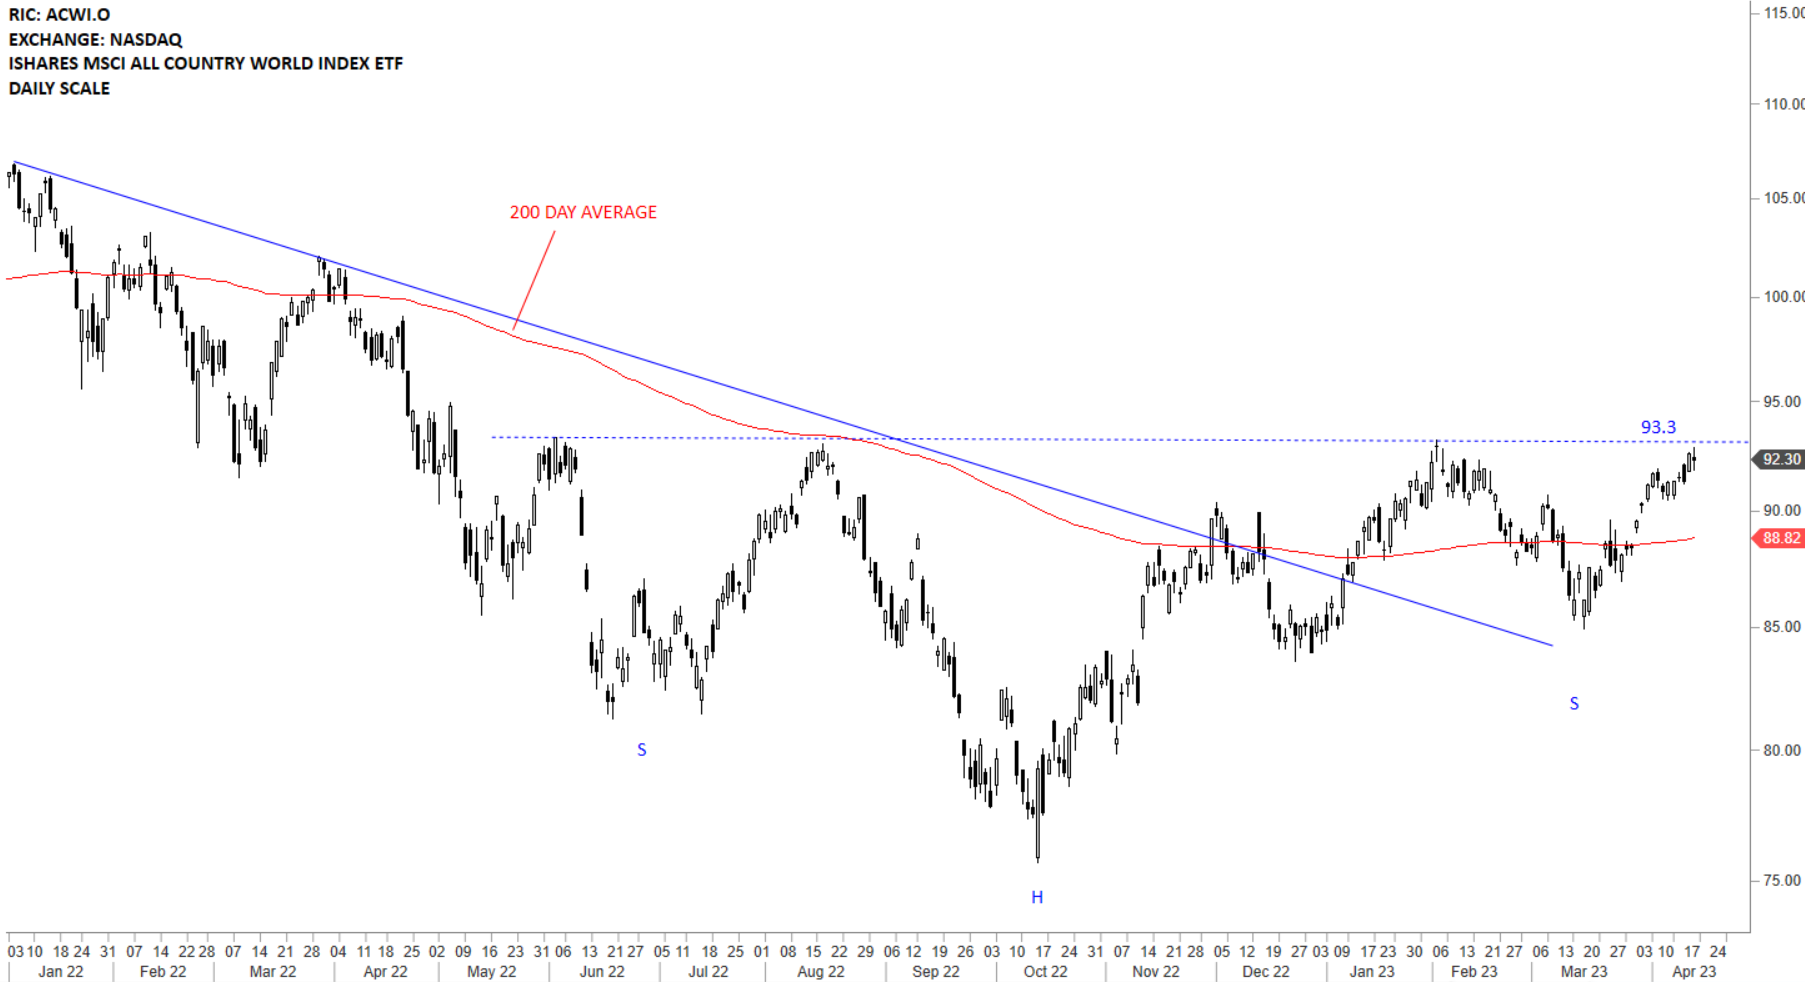
The benchmark for the Global equity markets performance, the iShares MSCI All Country World Index ETF (ACWI.O) once again fell below its 200-day average. To get bullish on Global Equities, I want to see the ETF clearing the 200-day average and settling above it. Until that happens I will view this as a counter trend rebound. We can see more sideways consolidation around the 200-day average until the index finds direction. The 200-day average is currently at 100 levels. The bullish case would be the formation of a H&S bottom reversal with the right shoulder being in progress. I would give few more days for the ETF to prove the bullish thesis wrong. An upward move towards 100-101.7 area will increase my confidence on the H&S bottom reversal development. Failure to form a right shoulder and continued weakness will establish the downtrend below the 200-day average for the coming months.

Read More

GLOBAL EQUITY MARKETS – April 16, 2022

REVIEW


The benchmark for the Global equity markets performance, the iShares MSCI All Country World Index ETF (ACWI.O) is consolidating around its 200-day average. To get bullish on Global Equities, I want to see the ETF clearing the 200-day average and settling above it. Until that happens I will view this as a counter trend rebound. We can see more sideways consolidation around the 200-day average until the index finds direction. The 200-day average is currently at 100 levels. The bullish case would be the formation of a H&S bottom reversal with the right shoulder being in progress. An upward move towards 100-101.7 area will increase my confidence on the H&S bottom reversal development.

Read More

CRYPTOCURRENCIES – April 10, 2022

When I start seeing the same chart pattern on several price charts I call it a developing "theme". Yes, those assets might be correlated but usually I don't see similar price actions taking place on a wide universe. Several altcoins are showing similar reversal chart patterns. Question is: are they going to be successful? I will give those patterns another week to prove themselves. Though I can't wait another week to bring them to your attention. I want our members to follow those patterns the way I'm monitoring them in the following few weeks.

Read More

GLOBAL EQUITY MARKETS – April 9, 2022

REVIEW


The benchmark for the Global equity markets performance, the iShares MSCI All Country World Index ETF (ACWI.O) is consolidating around its 200-day average. To get bullish on Global Equities, I want to see the ETF clearing the 200-day average and settling above it. Until that happens I will view this as a counter trend rebound. We can see more sideways consolidation around the 200-day average until the index finds direction. The bullish case would be the formation of a H&S bottom reversal with the right shoulder being in progress. Similar H&S bottom reversal labelling can be seen on the S&P 500 and Nasdaq 100 charts featured below.

Read More

GLOBAL EQUITY MARKETS – April 2, 2022

REVIEW


The benchmark for the Global equity markets performance, the iShares MSCI All Country World Index ETF (ACWI.O) recovered above its 200-day average. To get bullish on Global Equities, I want to see the ETF clearing the 200-day average and settling above it. Until that happens I will view this as a counter trend rebound. We can see more sideways consolidation around the 200-day average until the index finds direction.

Read More

Chart Pattern Reliability & Review of Current Market Opportunities – March 2022 Tech Charts Webinar

Chart Pattern Reliability & Review of Current Market Opportunities - March 2022 Tech Charts Webinar

We are continuing our Member webinar series with chart pattern reliability and how the latest market conditions have impacted success rates on different chart patterns. Webinar Outline
  • Review of chart pattern statistics and discussion on chart pattern reliability covering the first quarter of 2022
  • Review of markets and latest opportunities
  • Open discussion on answering members’ questions on different markets and specific charts they want to discuss
  • Education/analysis of fine points on classical charting as we go through different charts/questions

Live questions from Members

  1. SLIDE 3 - Is it possible to publish this data only for the US market? 01:07:37
  2. SLIDE 14 - When drawing the channel's lower boundary, I would have used the lows in 2014 and 2018 to connect the trendline. What made you confident ignoring those lows? 01:08:38
  3. Can you look at praj.ns. listed on the NSE in India? A rectangle with a premature breakout and now trying again? 01:10:46
  4. Do you use a minimum volume threshold to determine which ETFs make it into your asset universe? 01:12:17
  5. Do you believe AKAM is a valid rectangle? 01:13:21
  6. Do you have plans to add commodities to your reports? 01:14:35
  7. ARES chart, please. 01:14:54
  8. Do you adjust stock data for dividends? 01:16:12
  9. Is there technically a proper H&S top on ADBE? 01:17:42
  10. Another stock you've covered in the past is Indian hotel listed on NSE...another breakout rectangle breaking? 01:18:57
  11. When you wait for the 3% breakout threshold, do you only buy on the next day or at the close? 01:20:19

Educational Videos mentioned in this webinar 

Recorded live 03.31.2022  Read More

GLOBAL EQUITY MARKETS – March 26, 2022

REVIEW


The benchmark for the Global equity markets performance, the iShares MSCI All Country World Index ETF (ACWI.O) continues to remain below the 200-day average. Past few days rebound has been strong and pushed the ETF towards the strong resistance area between 99 and 100.1. To get bullish on Global Equities, I want to see the ETF clearing the 200-day average and settling above it. Until that happens I will view this as a counter trend rebound. Last 3 months trend has been downwards with clear lower lows and lower highs.

  Read More

CRYPTOCURRENCIES – March 20, 2022

Cryptocurrency markets have been muted for the past few months. Clearly volatility dropped to low levels which suggests an increase in volatility on the coming weeks. Increase in volatility usually results in a trend period. Many charts I'm reviewing are lacking any breakout setup. However, there is a common theme between charts that suggest a possible rebound from strong support areas which can offer trading opportunity between boundaries. Below I feature these opportunities.

Read More

GLOBAL EQUITY MARKETS – March 19, 2022

REVIEW


The benchmark for the Global equity markets performance, the iShares MSCI All Country World Index ETF (ACWI.O) continues to remain below the 200-day average. Past few days rebound has been strong and pushed the ETF towards the strong resistance area between 99 and 100.1. To get bullish on Global Equities, I want to see the ETF clearing the 200-day average and settling above it. Until that happens I will view this as a counter trend rebound. Last 3 months trend has been downwards with clear lower lows and lower highs.

Read More

GLOBAL EQUITY MARKETS – March 12, 2022

REVIEW


The benchmark for the Global equity markets performance, the iShares MSCI All Country World Index ETF (ACWI.O) continues to remain below the 200-day average and exposed for further weakness. Previous rebound got rejected at the 200-day average. 99-100.4 area is the new resistance. The ETF started forming lower lows and lower highs. If rebounds can't push prices above the 99-100.4 area, downtrend can accelerate.

Read More