Quick note for our new members:
First I would like to thank to our existing members for their continued interest in Tech Chart membership service and to our new members wish a successful journey in classical charting with Tech Charts. I hope to keep a high standard and continue to add value to your decision making process.
Below is our flagship Global Equity Markets report published weekly on Saturdays. It consists of three sections, a review section with classical chart pattern setups across major benchmarks (can include some FX and commodities charts that are relevant for Equity markets performance), a breakout alert section (stocks that have confirmed their breakouts during the week) and a watchlist section. Watchlist section has 4 sub categories. Americas, Europe, Middle East & Africa and Asia. The aim of Tech Charts membership service is to offer a broad perspective in classical charting but not no catch each and every breakout opportunity. You would agree that featuring each and every breakout opportunity in Global Equities is almost impossible. However, the long-term goal is to help traders/investors gain knowledge in identifying those opportunities on their own. To help build a framework in running a bottom/up research in Global Equity Markets.
Once a breakout is confirmed the stock is placed under Breakouts page (under the specific week's report). An update is posted only if the stock reaches pattern price objective or the chart pattern negation level. Once one of those levels are reached, the stock is also updated as a completed trade idea under chart pattern reliability tables.
There are more than 45 educational videos. They are for traders and investors across different knowledge and experience levels. I strongly recommend watching those videos with your own pace. You will find several tactical trading videos where I discuss different stop-loss and trailing stop-loss strategies as well as basics in identifying classical chart patterns.
At the end of each report there is a DISQUS section where you can login with your social media/email accounts and ask questions, share charts and interact with other Tech Charts members.
If the market conditions dictate (fast moving markets, several setups emerging during the week), I will issue Interim Updates. All communications are via e-mail notifications and also through the website.
I continue to add new educational videos and interactive educational posts. Keep an eye on those updates and new content through your e-mail or through the website.
Special crypto currency reports are published bi-monthly (next one scheduled for Sunday 11th). Though they are also subject to Interim Updates if the market conditions require.
Any market related questions you might have please don't hesitate to contact me at aksel@techcharts.net and any membership related questions you might have, Jolleen Oleson (jolleen@techcharts.net) will kindly help you.
I wish you all success and thanks again for being part of Tech Charts community.
Aksel Kibar, CMT
REVIEW
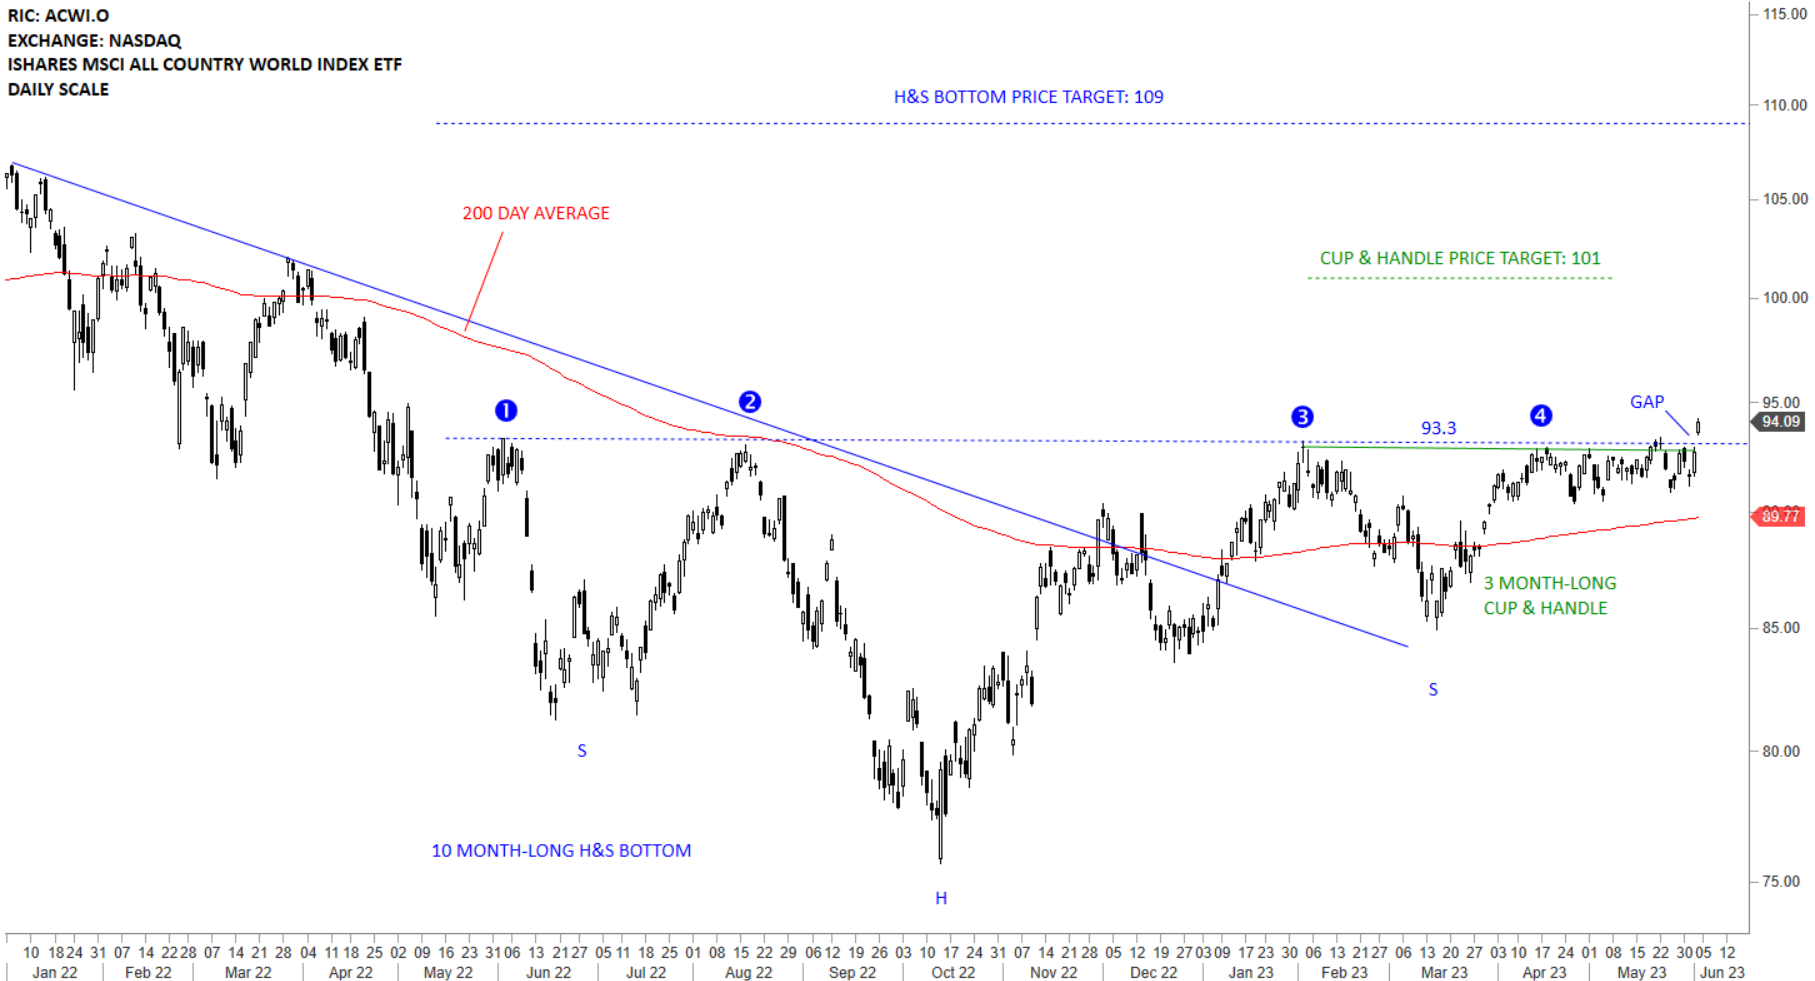
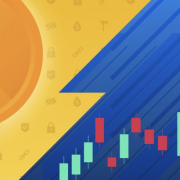
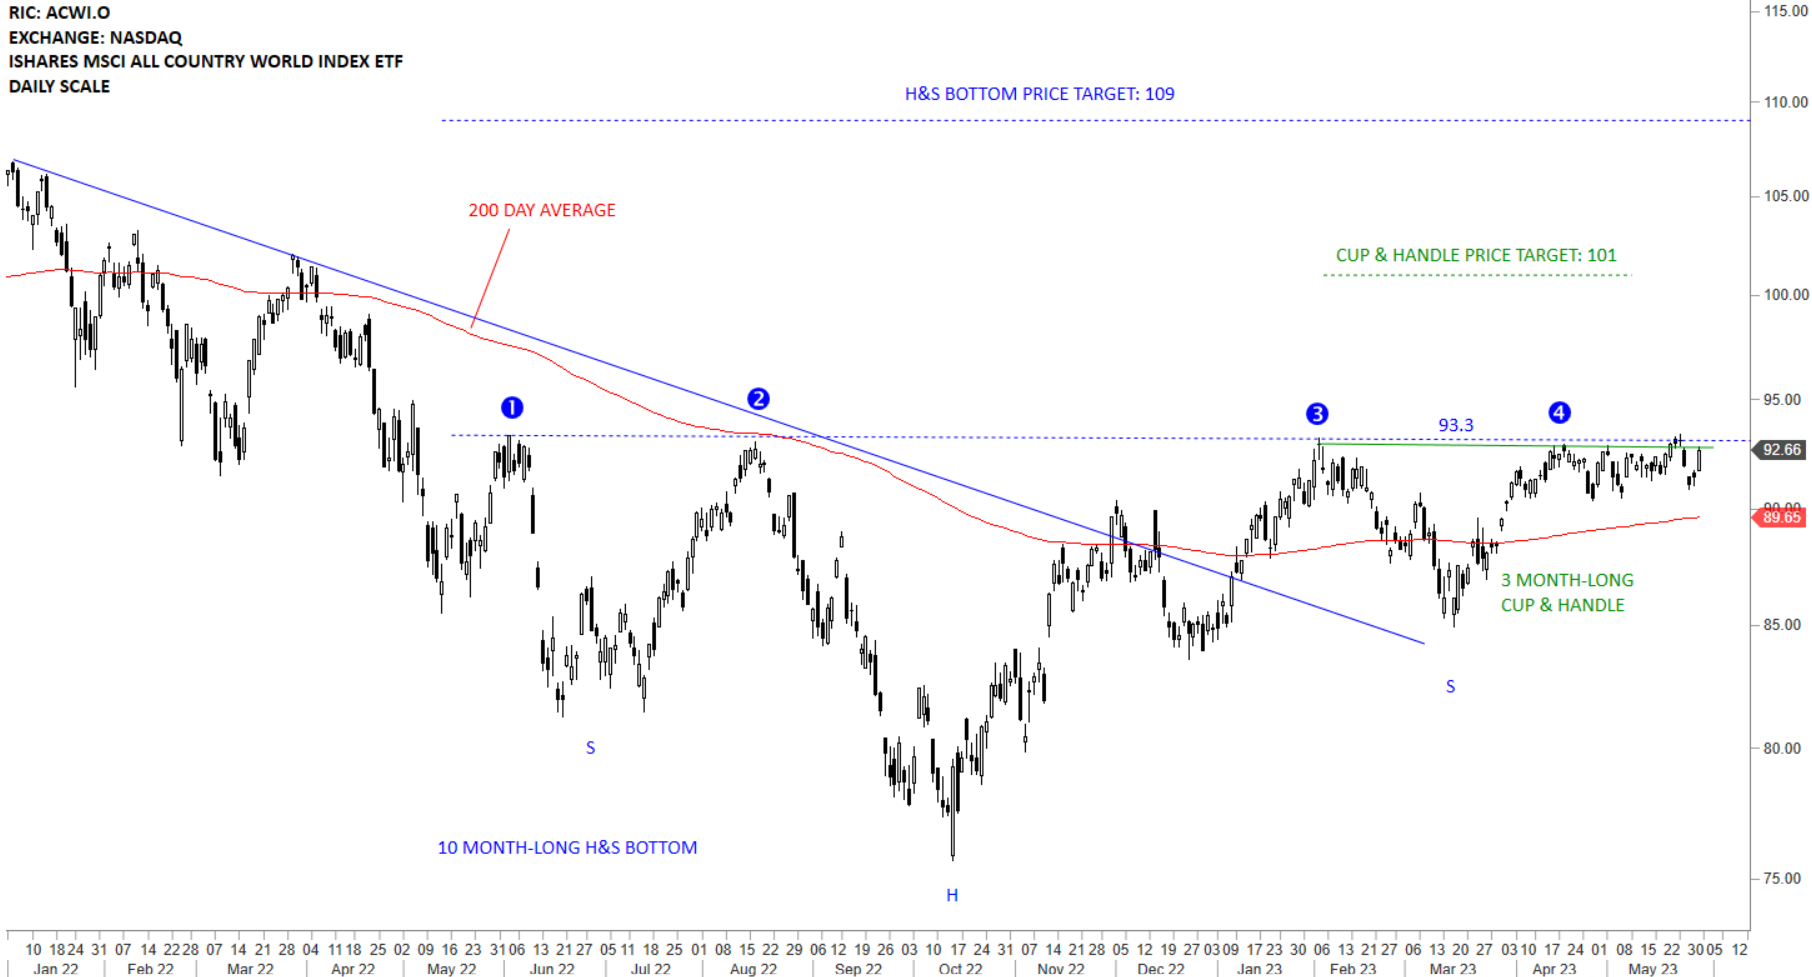
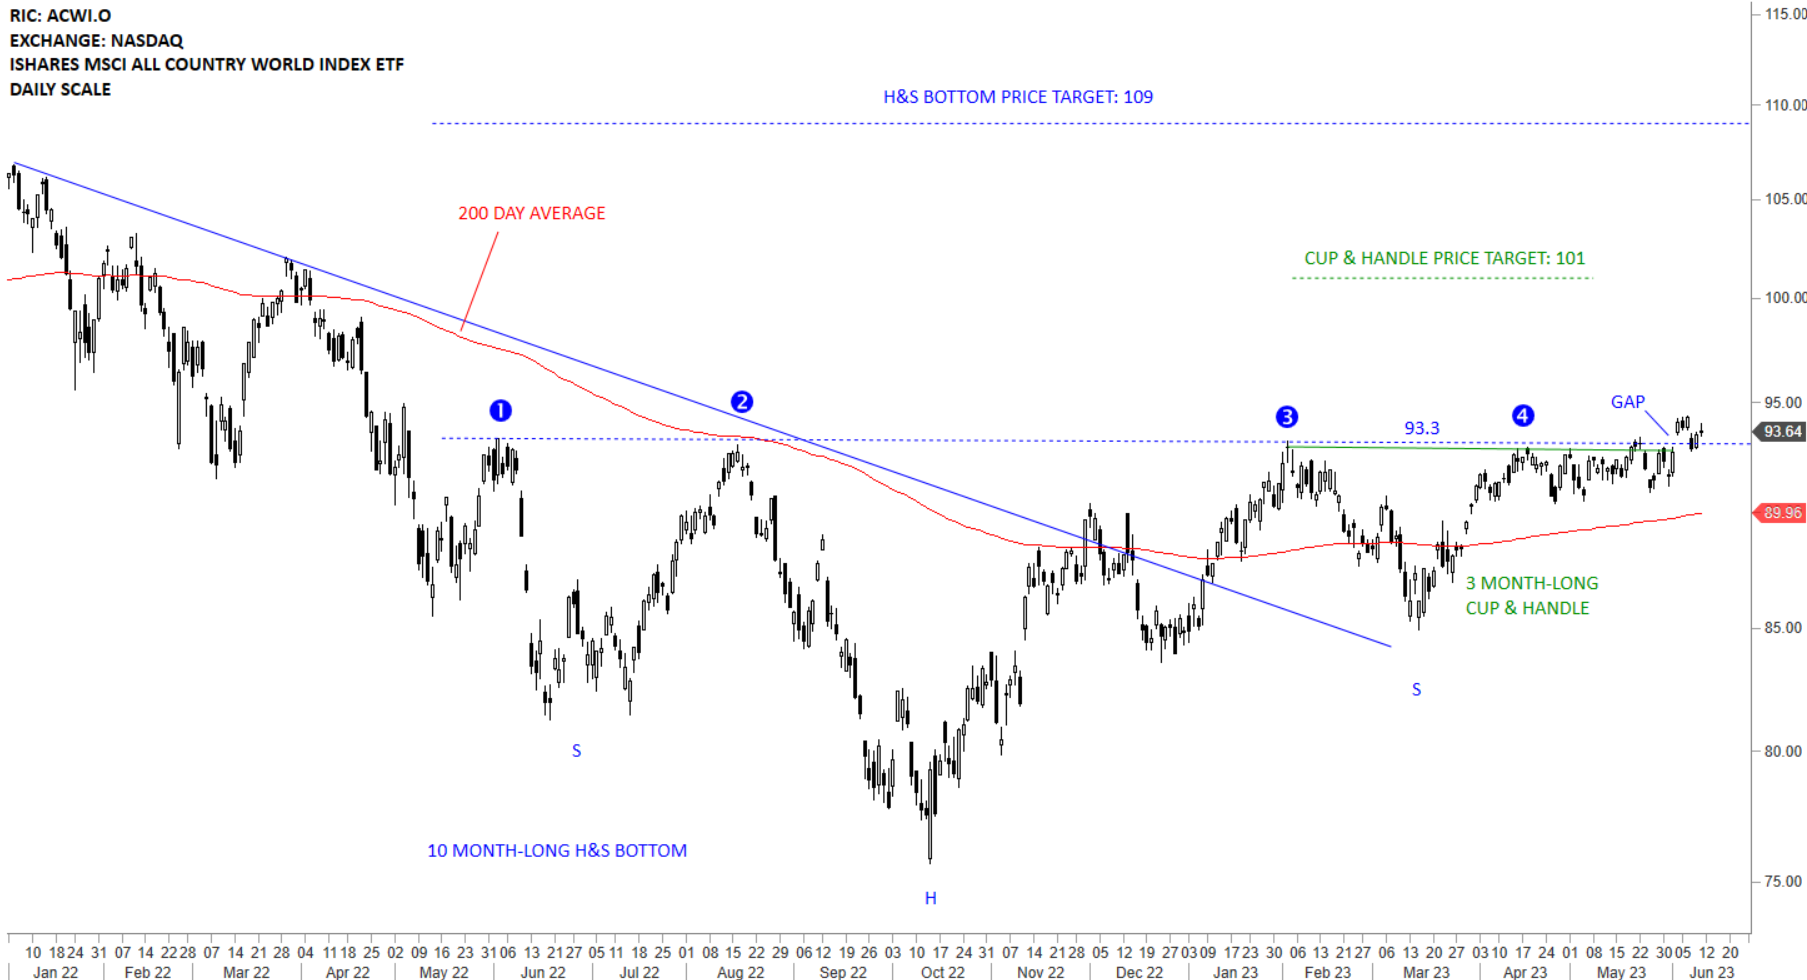
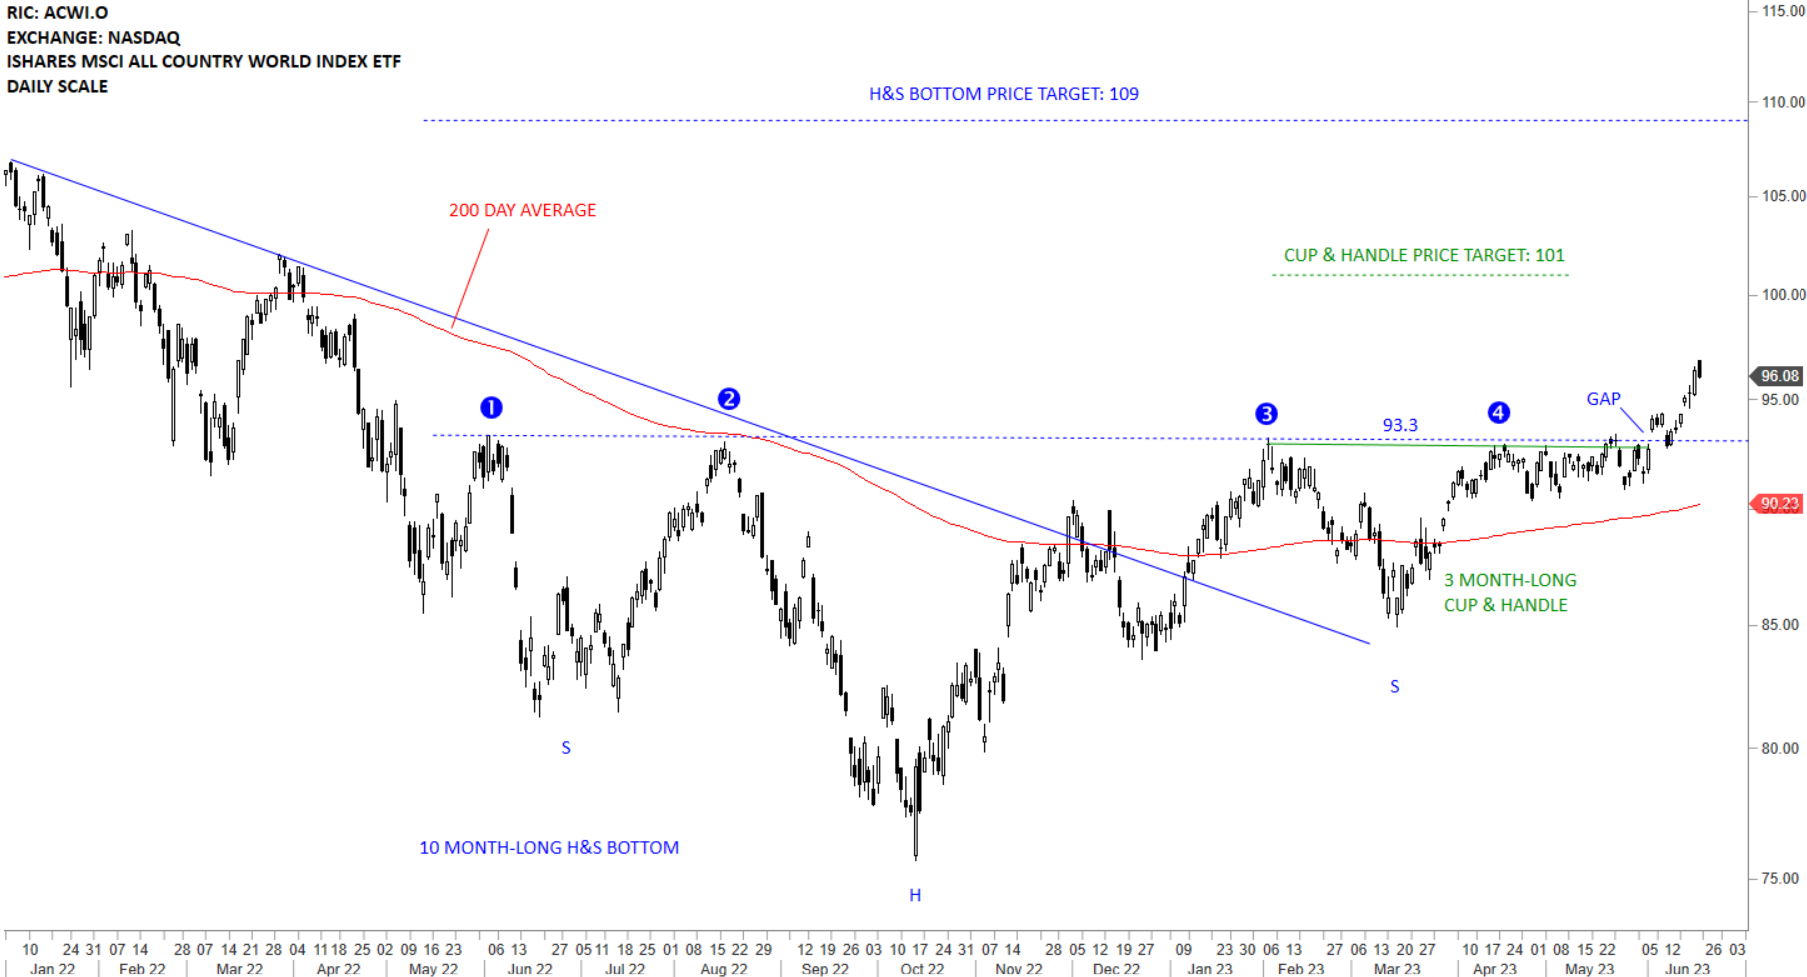
The benchmark for the Global equity markets performance, the iShares MSCI All Country World Index ETF (ACWI.O) broke out of its multi-month long consolidation. Breakout above 93.3 levels is very positive for Global equities. The ETF is possibly completing two chart patterns at the same time, increasing conviction in the recent breakout. The gap was filled during the recent pullback. It is now clear that the recent gap was not a breakaway gap. Previous resistance at 93.3 levels becomes the new support. It will be important for the ETF to start trending higher and quickly moving away from the support area. Cup with handle price target stands at 101 and the larger scale H&S bottom reversal price target is at 109 levels.
 Read More
 Read More