GLOBAL EQUITY MARKETS – September 9, 2023
REVIEW
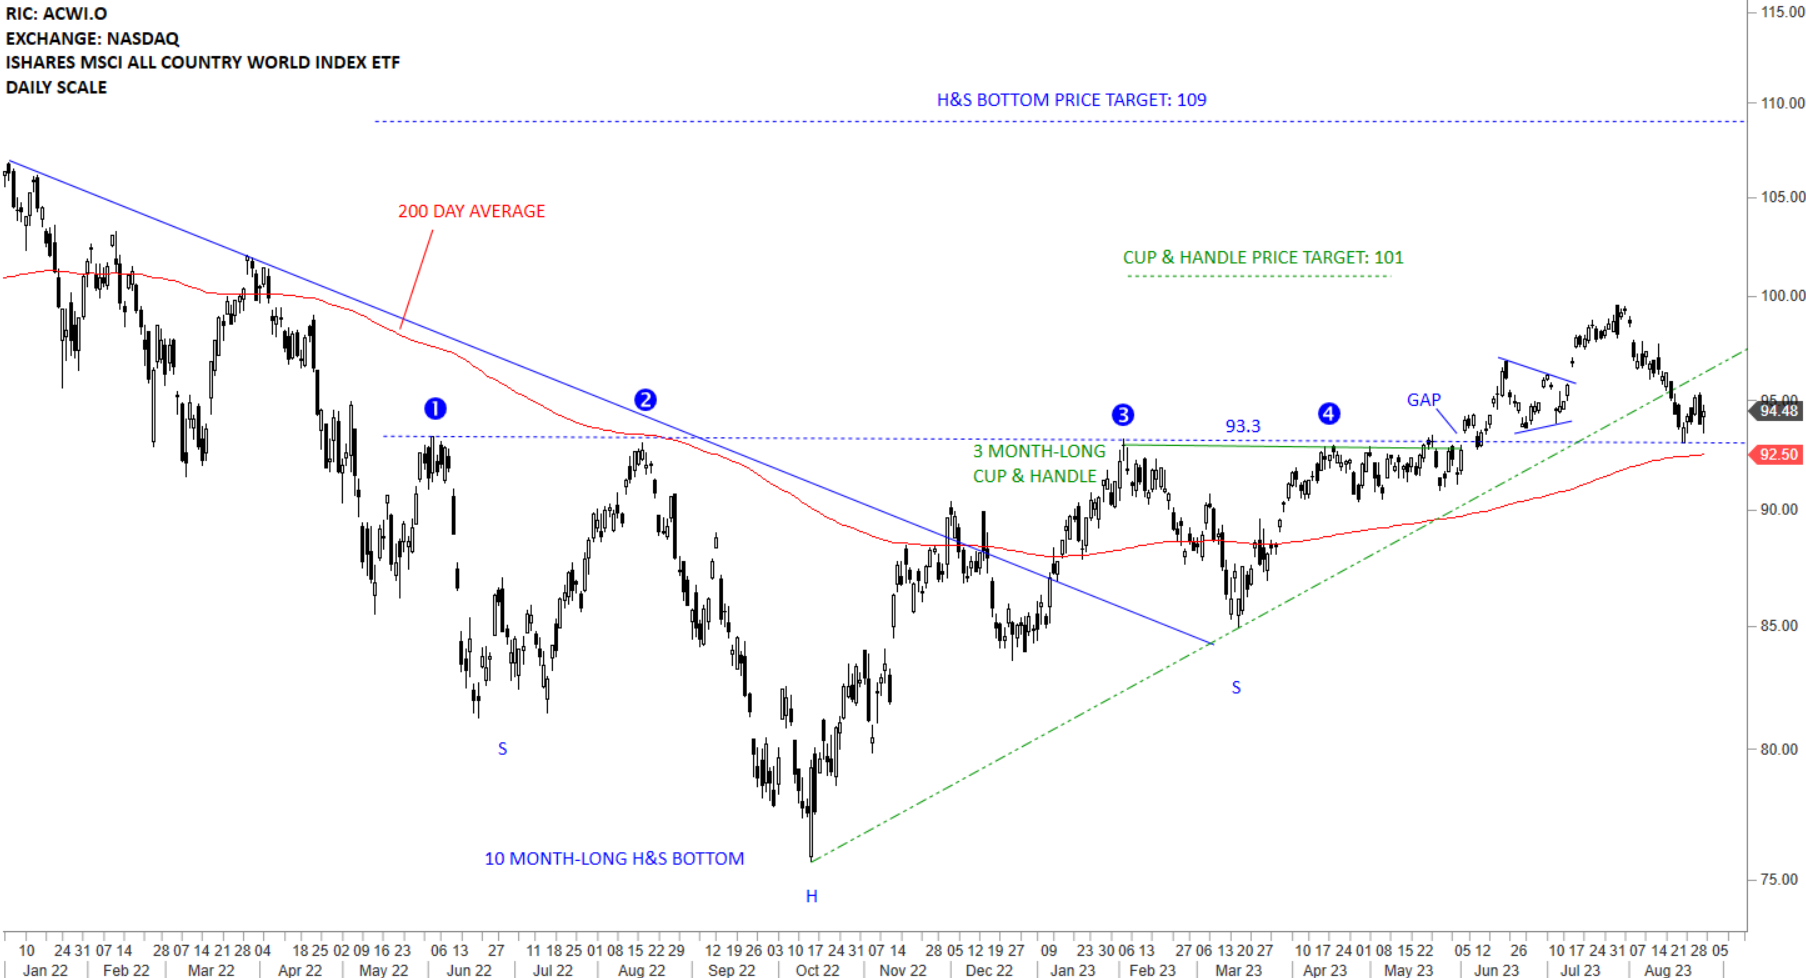
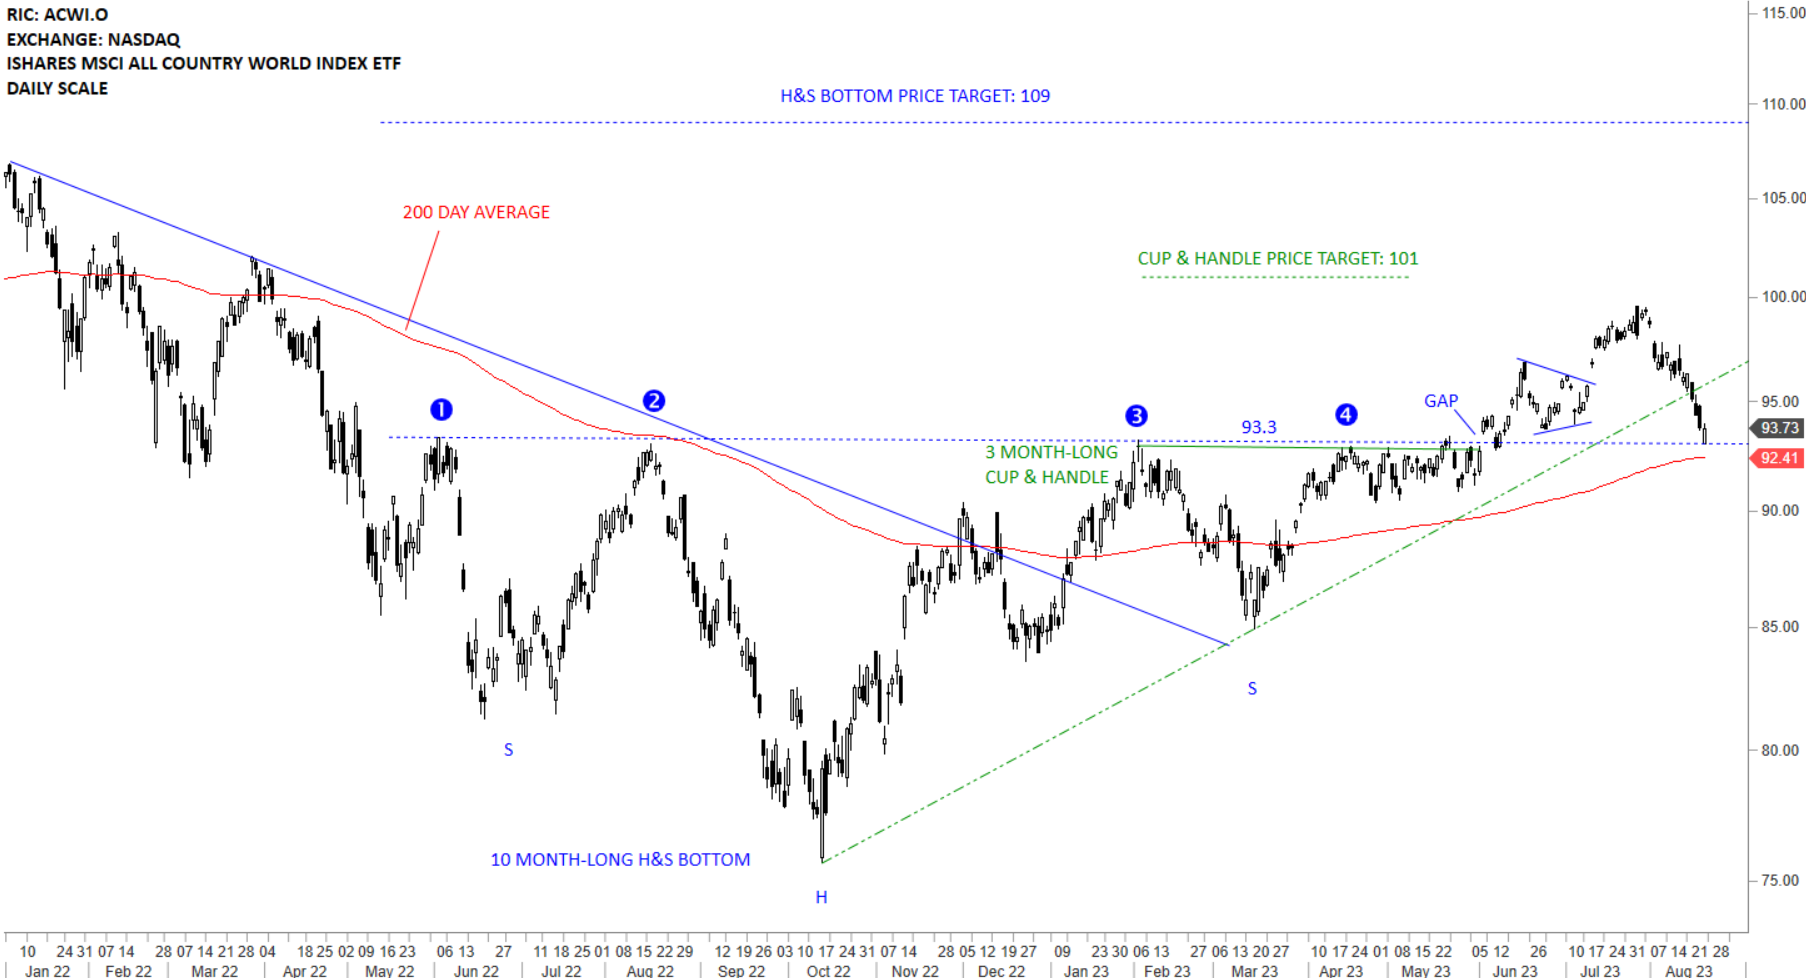
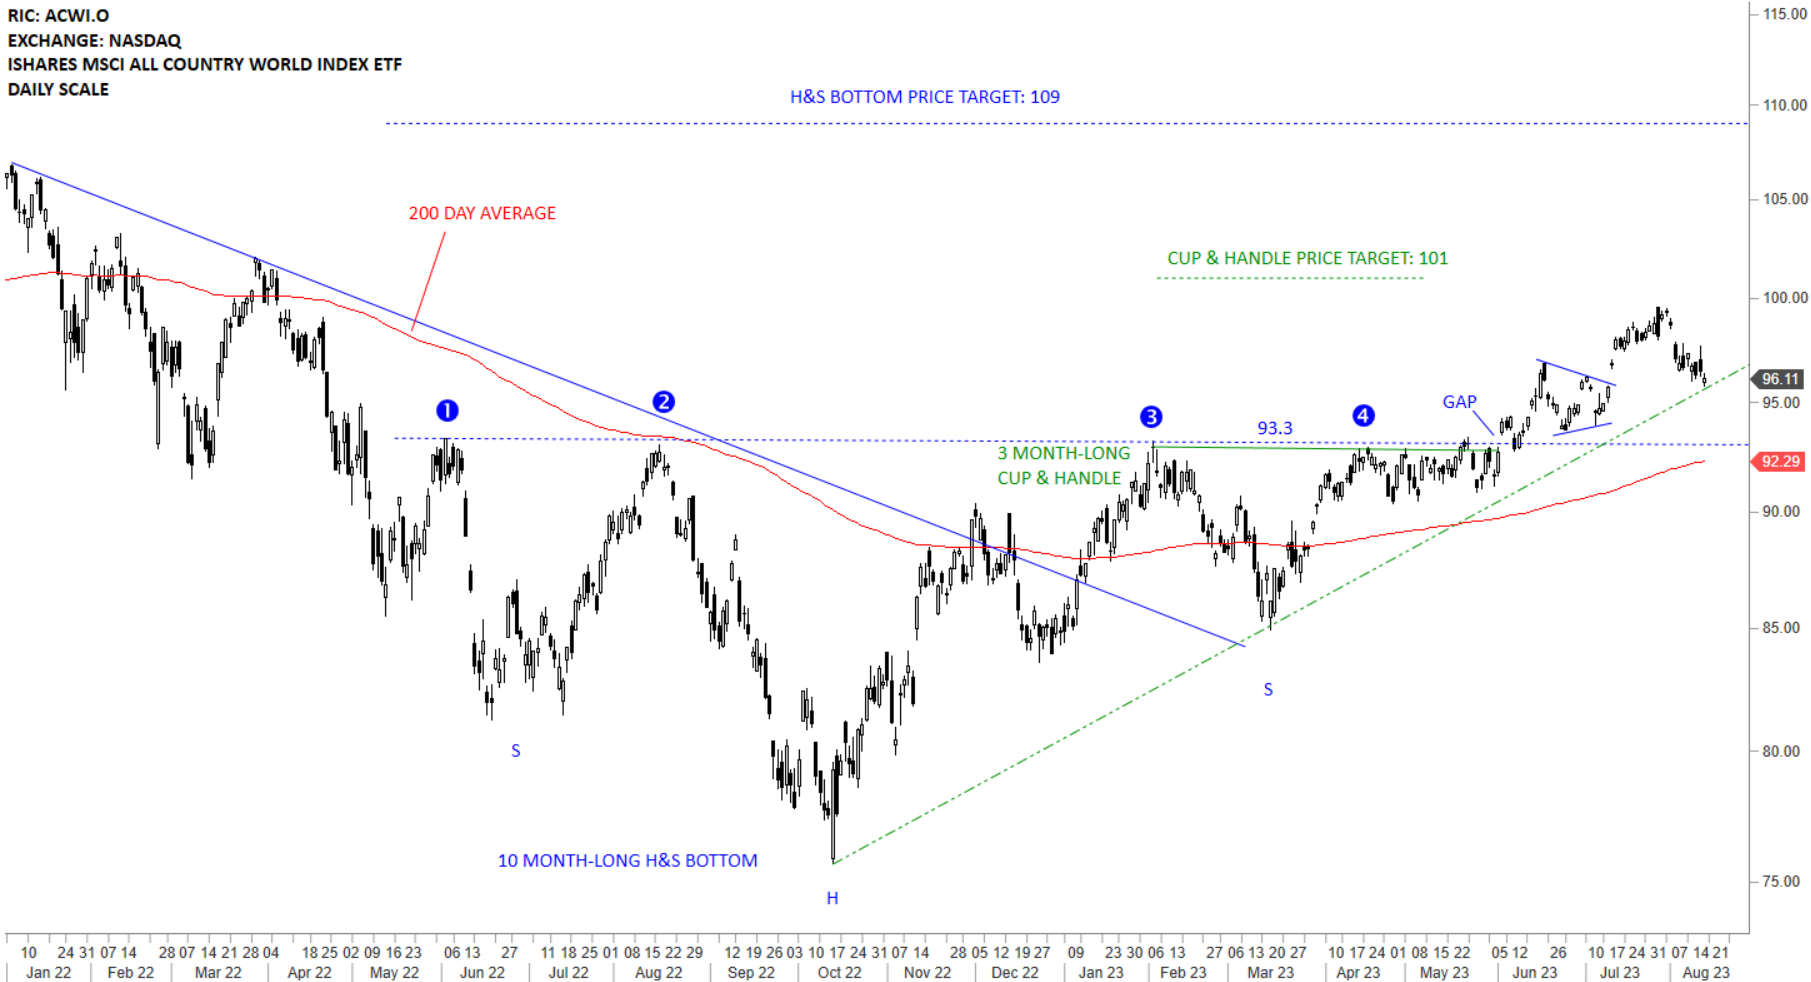
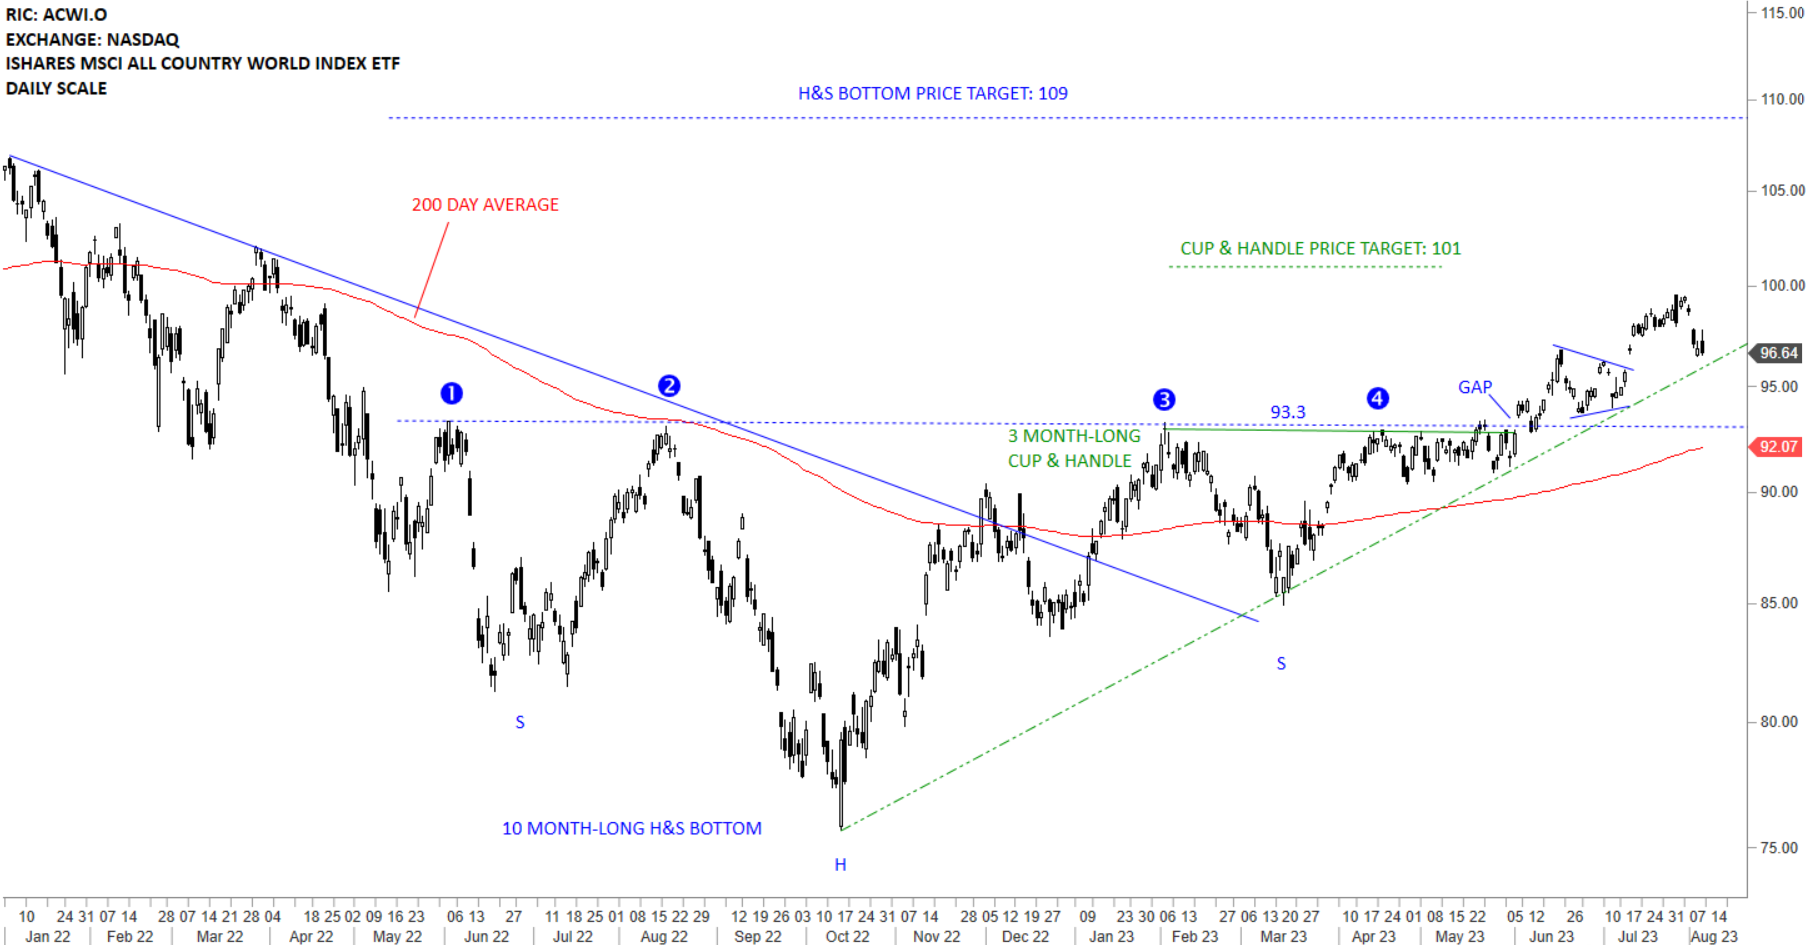
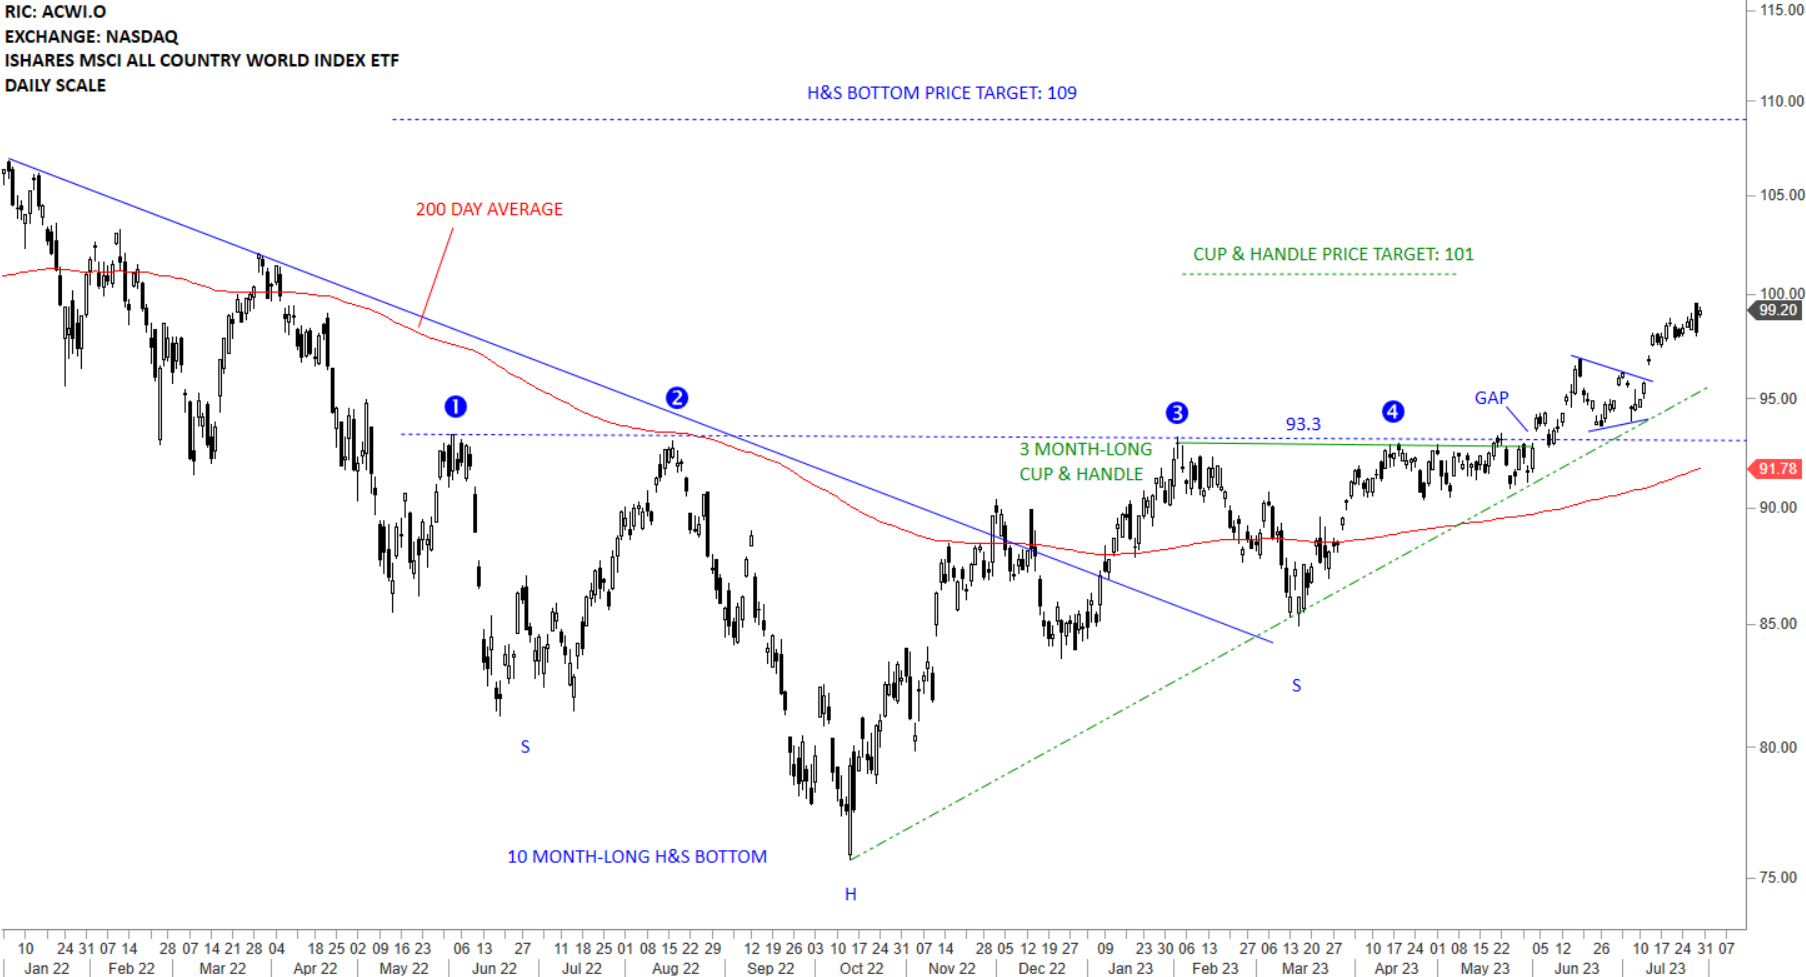
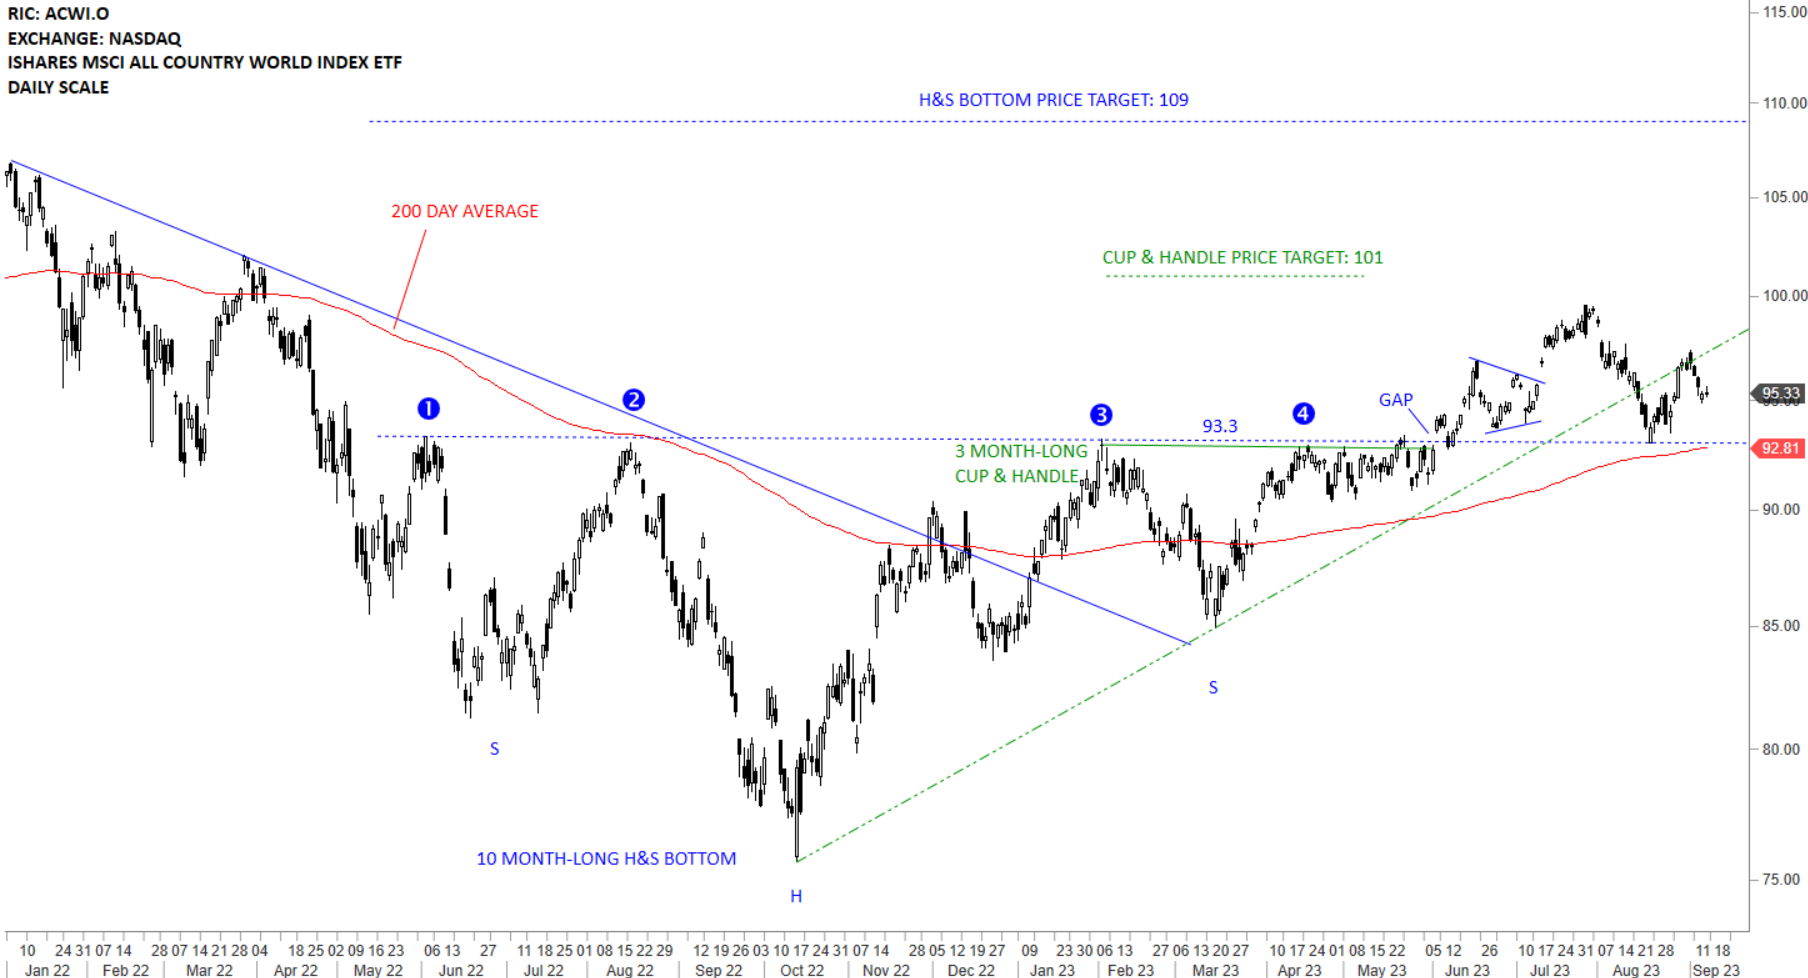
The benchmark for the Global equity markets performance, the iShares MSCI All Country World Index ETF (ACWI.O) broke out of its multi-month long consolidation. Price action so far looks like a reversion to the mean. Strong support area remains between the 200-day average, 92.81 and the horizontal boundary at 93.3 levels. Given that two important technical levels are overlapping around the same area, I see it as an inflection point. Failure to hold above the 200-day average can result in a change in trend. If the pullback (re-test of the horizontal support) has been completed the ETF can target cup & handle price target at 101 levels in the following weeks. Uptrend is intact above the 200-day average.
 Read More