GLOBAL EQUITY MARKETS – December 2, 2023
/0 Comments/in Premium/by Aksel KibarREVIEW
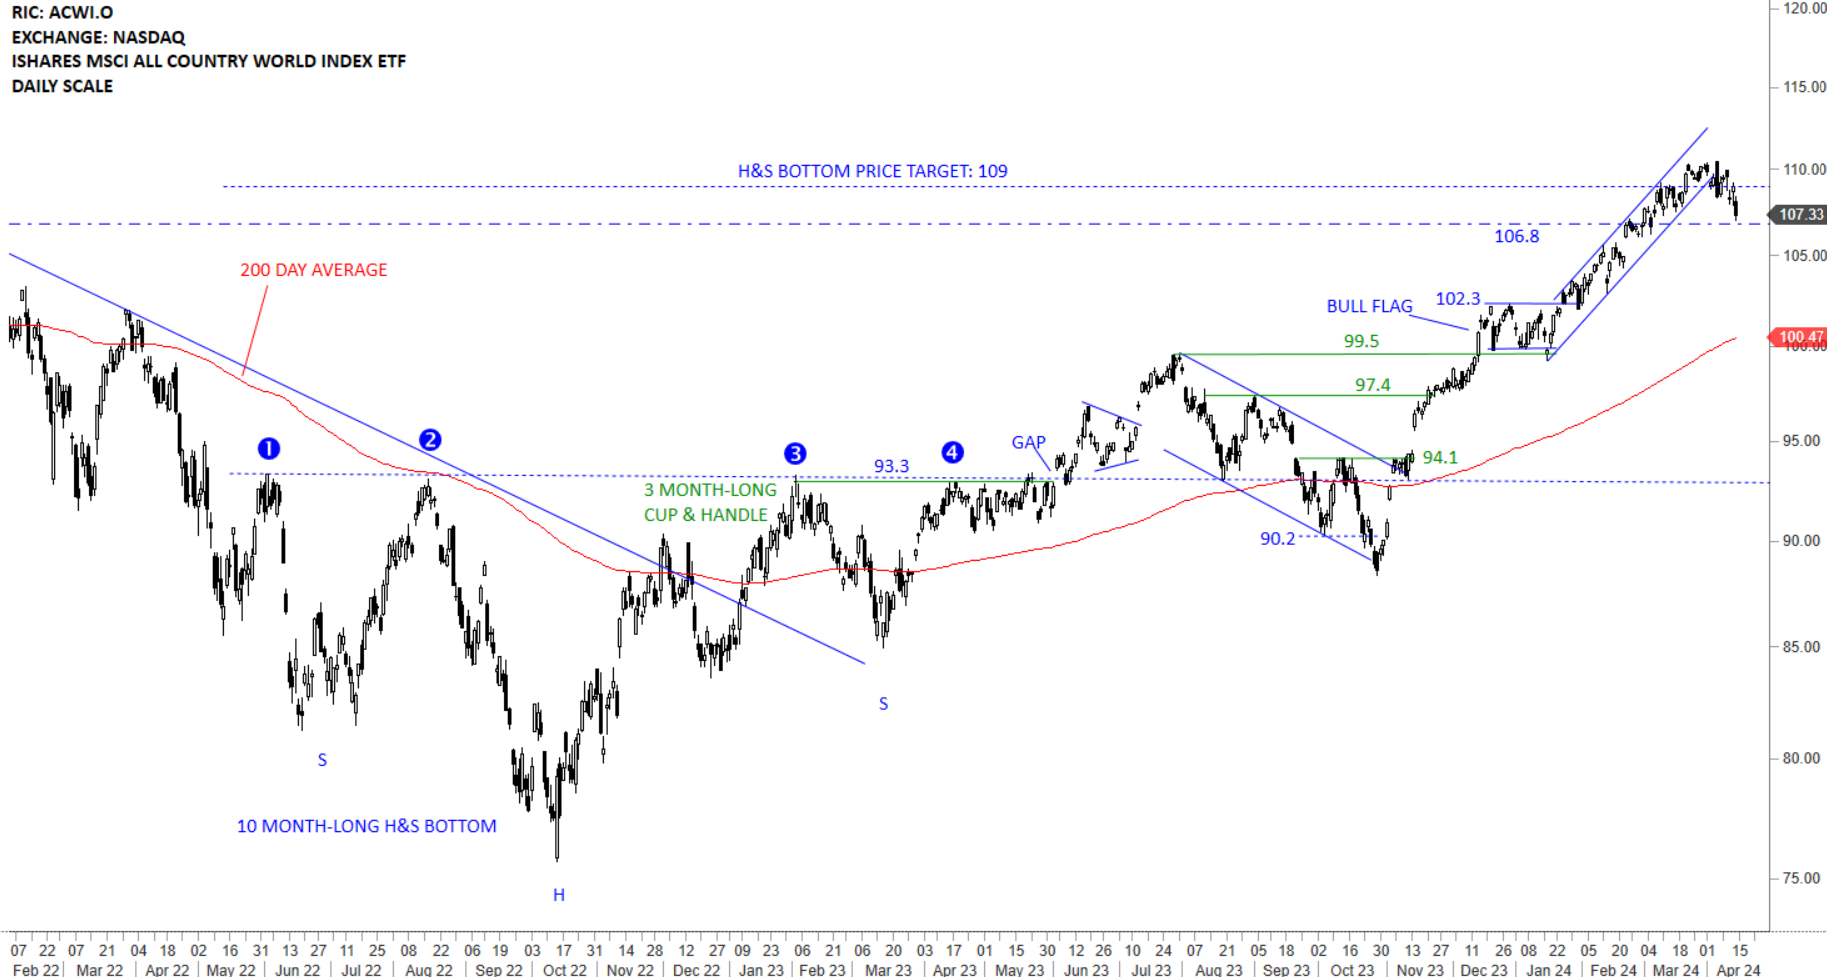
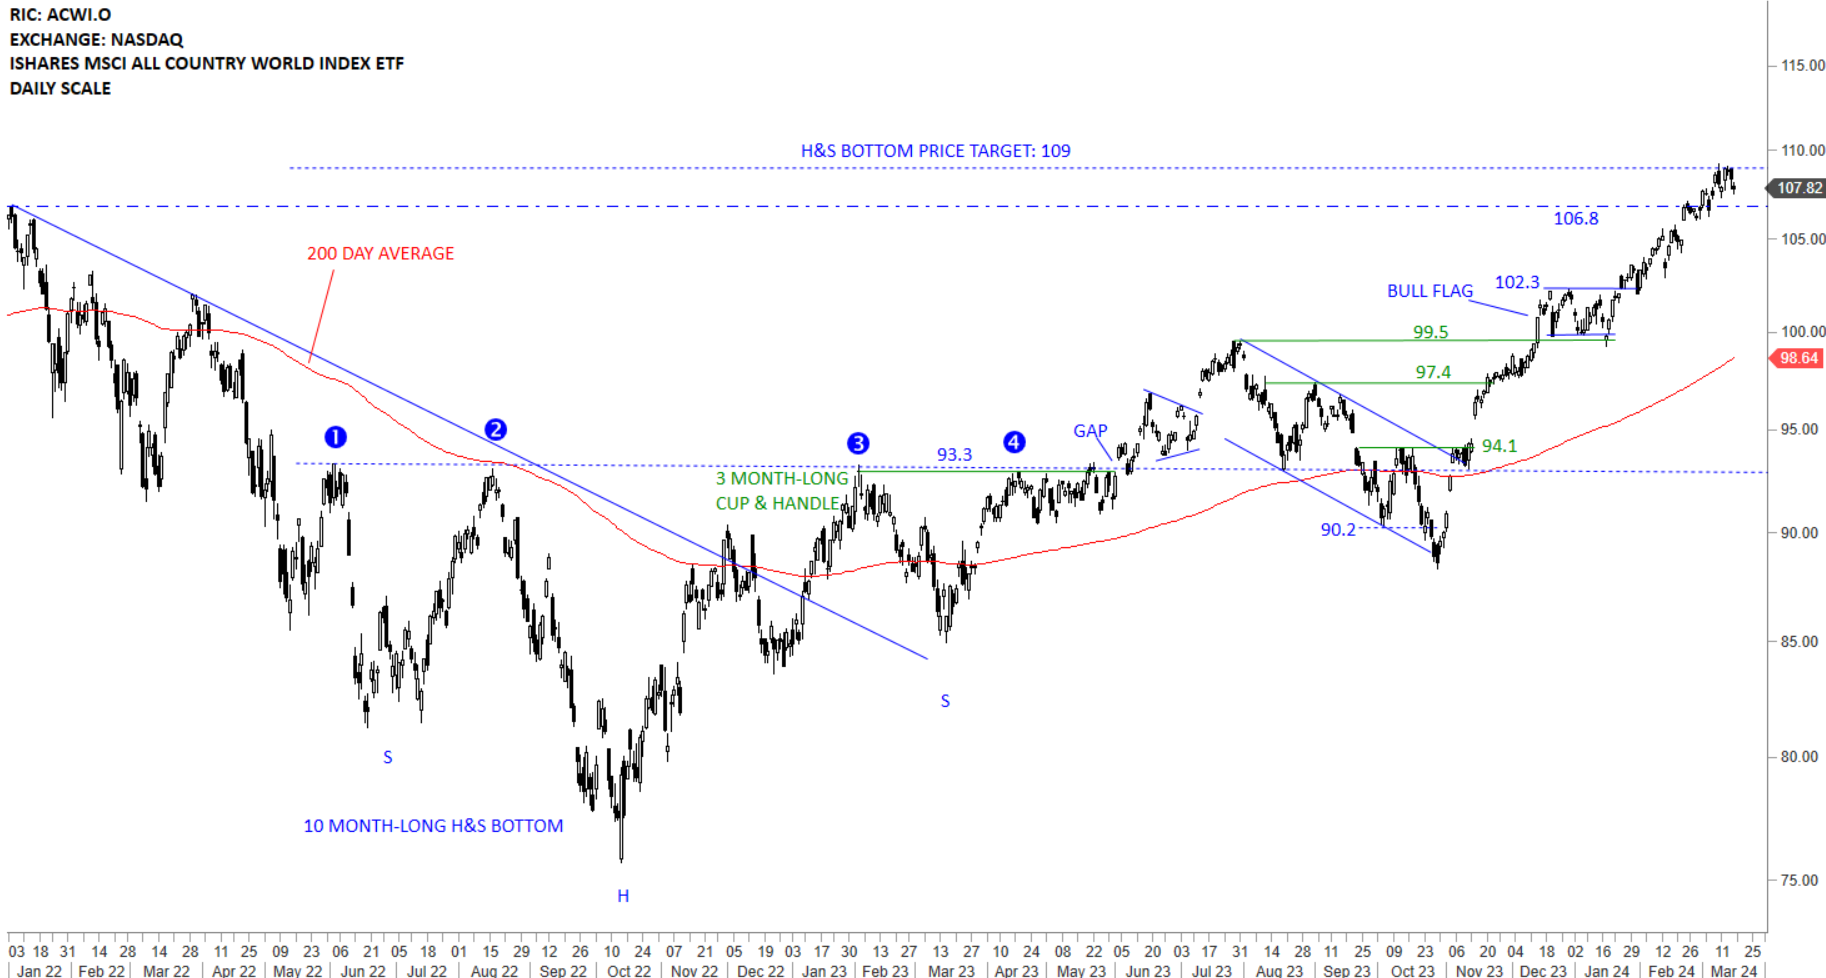
The benchmark for the Global equity markets performance, the iShares MSCI All Country World Index ETF (ACWI.O) is trying to stabilize above the 200-day average. The ETF is holding on to its gains and resuming towards the next resistance at 99.5 levels. With the recovery above the 200-day average, I start monitoring the chart with a bullish perspective. During any pullback the ETF can fill the gap above 94.1 levels, which could be considered as a pullback to the long-term average. Long-term H&S bottom price target stands at 109 levels.

CRYPTOCURRENCIES – November 26, 2023
/1 Comment/in Premium/by Aksel KibarBTCUSD reached rectangle price target at 38K. Uptrend remains intact. Short-term consolidation below 38K can act as a bullish continuation. ETHUSD chart might be forming a rising wedge with the upper boundary acting at resistance at 2260 levels. ETHUSD also has a channel price target at 2260 levels, an inflection point. Read More
GLOBAL EQUITY MARKETS – November 25, 2023
/3 Comments/in Premium/by Aksel KibarREVIEW
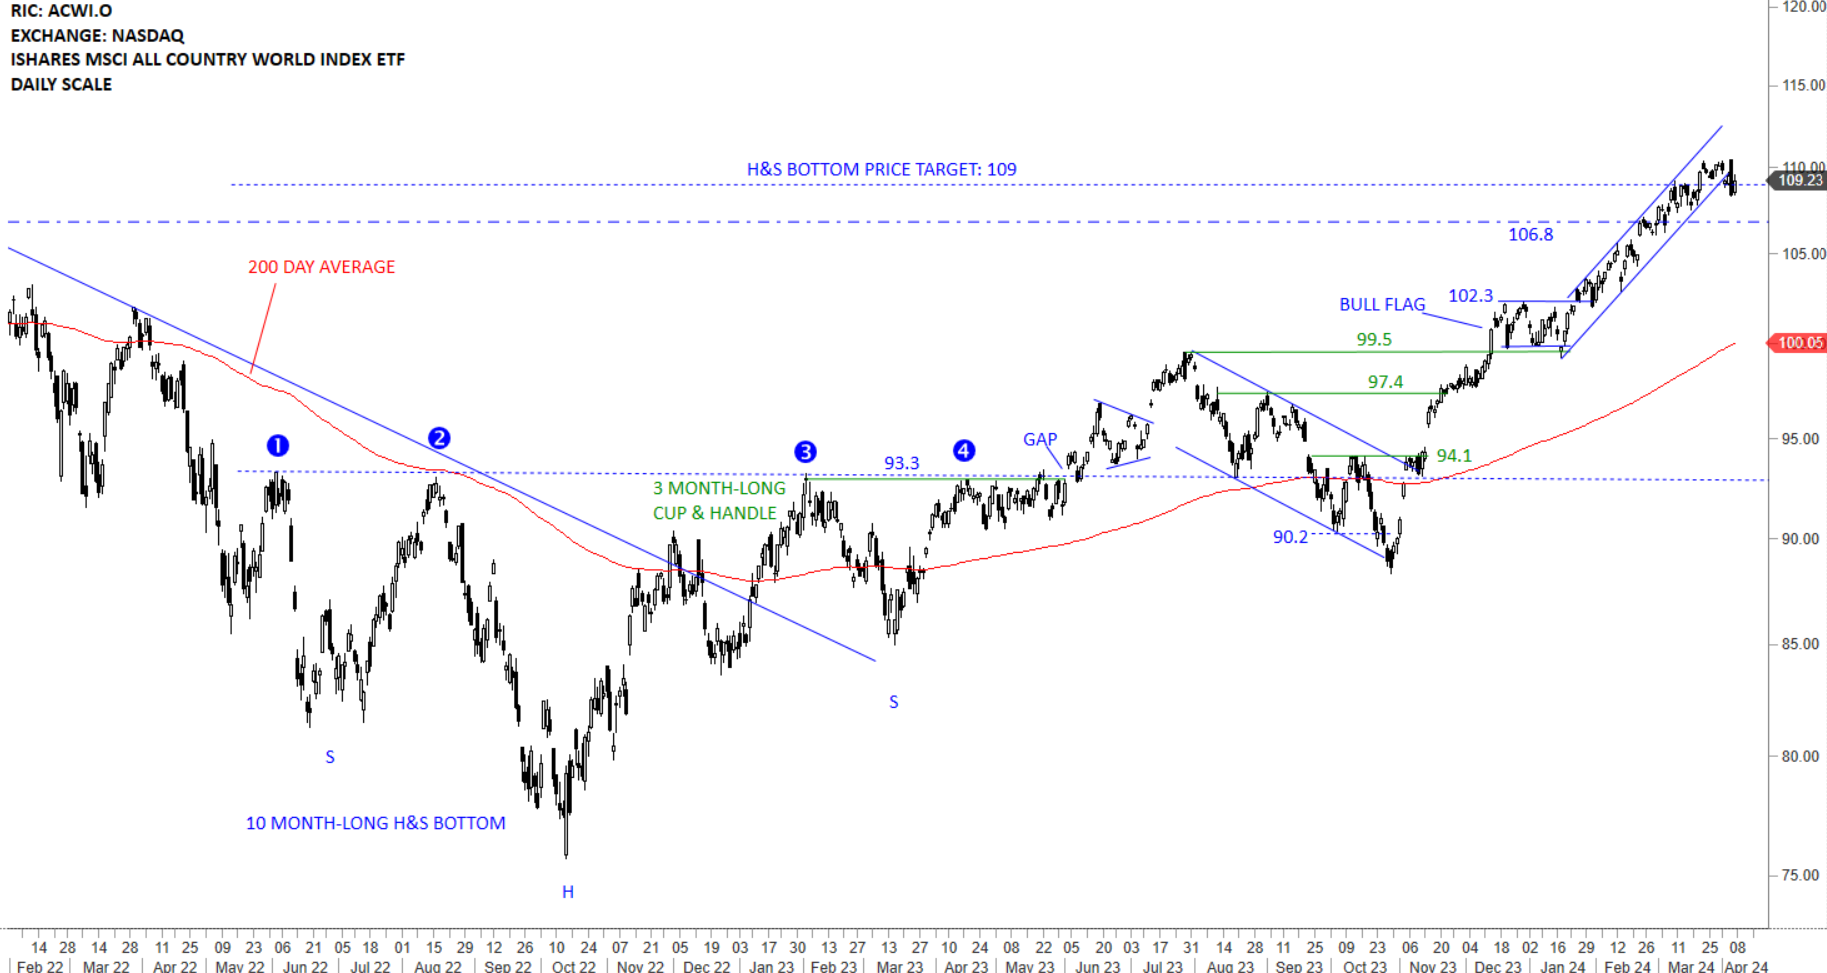
The benchmark for the Global equity markets performance, the iShares MSCI All Country World Index ETF (ACWI.O) is trying to stabilize above the 200-day average. The ETF held on to last week's gains. Two short-term resistance levels are at 97.4 and 99.5. With the recovery above the 200-day average, I start monitoring the chart with a bullish perspective. During any pullback the ETF can fill the gap above 94.1 levels. Long-term H&S bottom price target stands at 109 levels.

GLOBAL EQUITY MARKETS – November 18, 2023
/0 Comments/in Premium/by Aksel KibarREVIEW
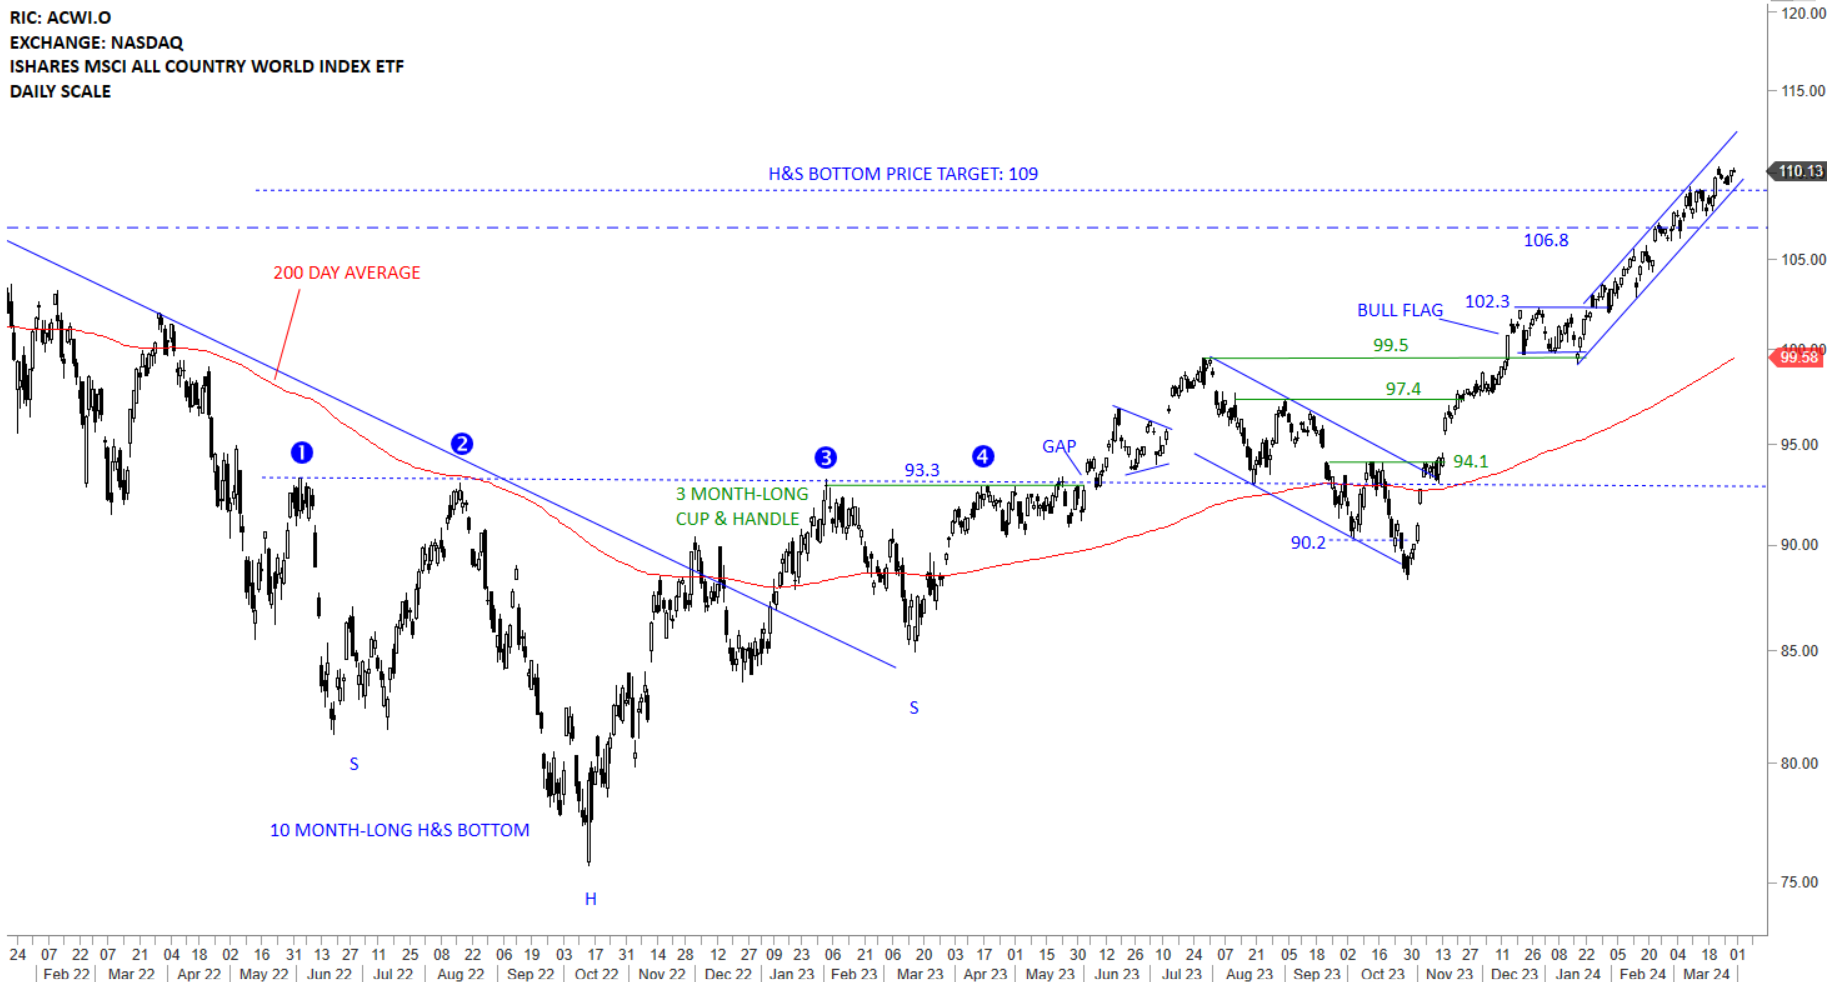
The benchmark for the Global equity markets performance, the iShares MSCI All Country World Index ETF (ACWI.O) is trying to stabilize above the 200-day average. Strong open to the week with a gap was followed by continued strength that pushed the ETF towards the minor resistance at 97.4 levels. With the recovery above the 200-day average, I start monitoring the chart with a bullish perspective. Short-term resistance is at 97.4 and support is at 94.1 level. During any pullback the ETF can fill the gap above 94.1 levels. Long-term H&S bottom price target stands at 109 levels.

CRYPTOCURRENCIES – November 12, 2023
/7 Comments/in Premium/by Aksel KibarBTCUSD reaches rectangle price target at 38K. Uptrend remains intact. ETHUSD chart is might be forming a rising wedge with the upper boundary acting at resistance at 2260 levels. ETHUSD also has a channel price target at 2260 levels, an inflection point. Read More
GLOBAL EQUITY MARKETS – November 11, 2023
/0 Comments/in Premium/by Aksel KibarREVIEW
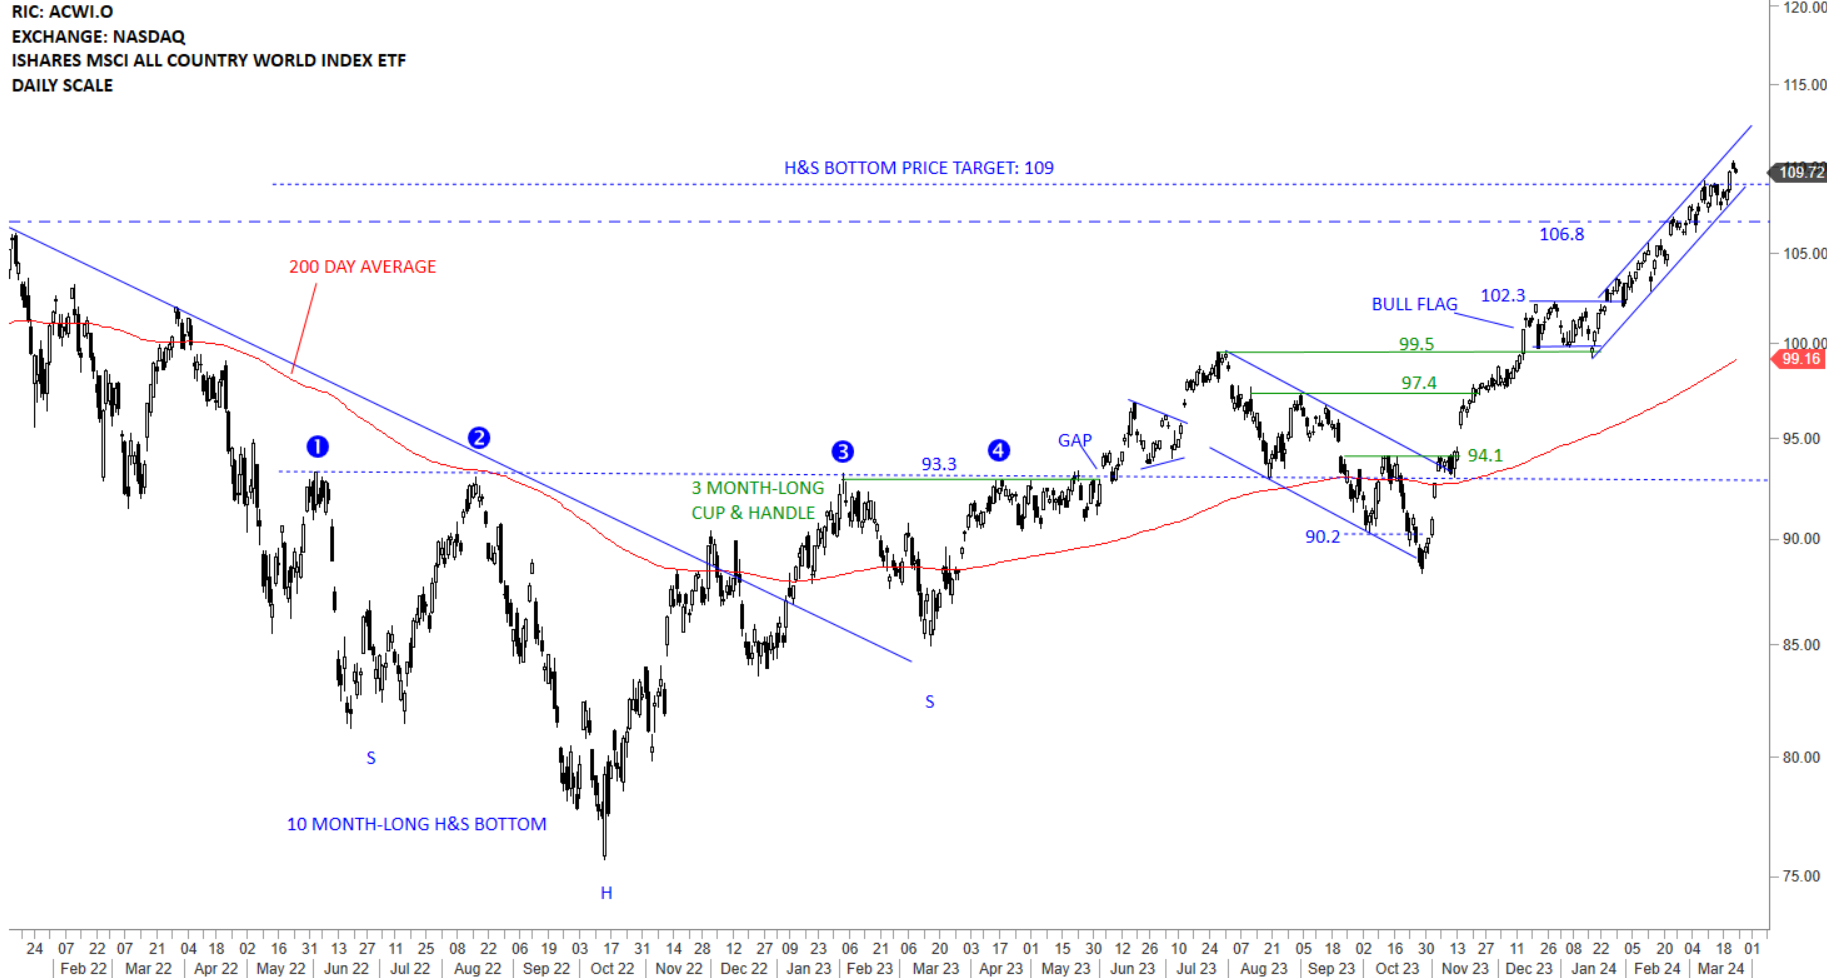
The benchmark for the Global equity markets performance, the iShares MSCI All Country World Index ETF (ACWI.O) is trying to stabilize above the 200-day average. The gap around 93 levels is filled. There is a wider gap below the 200-day average that might get filled. With the recovery above the 200-day average, I start monitoring the chart with a bullish perspective. One possibility is that the ETF can pullback to fill the larger gap and form the right shoulder of a short-term bottom reversal. The ETF can resume higher without any pullback. In that case I will continue to take breakout signals on single equities.

INTERIM UPDATE – November 10, 2023
/0 Comments/in Premium/by Aksel KibarDuring the daily charts review I came across those text-book opportunities which I think are time sensitive and fresh opportunities as breakdown candidates. Below are the latest additions to Tech Charts watchlist. These charts will also be included in the weekly update. I also plan to add more ideas to the watchlist in the upcoming Global Equity Markets report (scheduled for 11/11/2023).
Read MoreGLOBAL EQUITY MARKETS – November 4, 2023
/0 Comments/in Premium/by Aksel KibarREVIEW
The benchmark for the Global equity markets performance, the iShares MSCI All Country World Index ETF (ACWI.O) had an impressive rebound towards the 200-day average. Sharp rebound from 90 levels left few gaps that might get filled in the next few trading sessions. With the recovery above the 200-day average, I will start monitoring the chart with a bullish perspective. One possibility is that the ETF can pullback to fill the gaps and form the right shoulder of a short-term bottom reversal. Breach of a 200-day moving average both on the upside and on the downside is not a trading signal for me. I would like to see a classical chart pattern completion. The ETF can resume higher without any pullback. In that case I will continue to take breakout signals on single equities.

CRYPTOCURRENCIES – October 29, 2023
/3 Comments/in Premium/by Aksel KibarBullish outlook on BTCUSD remains intact. Price cleared the resistance at 31.4K which now becomes a strong support. H&S bottom reversal which had the neckline at 25K met its price objective at 34K. A possible rectangle might be in play with the price target of 38K. ETHUSD chart is possibly morphing with a possible channel on daily scale price chart. Read More
In Association with:
Latest Posts
- CRYPTOCURRENCIES – September 15, 2025September 15, 2025 - 11:34 am
- GLOBAL EQUITY MARKETS – September 13, 2025September 13, 2025 - 11:08 am
- BREAKOUT ROOM September 8, 2025 – LIVE MEETING, CHARTS Q&A (Recording)September 11, 2025 - 5:57 am
- BREAKOUT ROOM MONDAY 8th of September 9:00 AM EST – LIVE MEETING, CHARTS Q&ASeptember 6, 2025 - 7:48 pm