Review of 3rd Quarter 2024 Chart Pattern Reliability Numbers – September 2024 Tech Charts Member Webinar
Review of 3rd Quarter 2024 Chart Pattern Reliability Numbers - September 2024 Tech Charts Member Webinar
Webinar Outline- Review of chart pattern statistics and discussion on chart pattern reliability covering the YTD numbers and past quarter stats
- Capturing and riding directional moves from statistically successful chart patterns
- Review of global equity markets and latest opportunities
- Review of opportunities in the cryptocurrency markets
- Q&A
Questions from Members
The questions with timestamps were addressed in the webinar, the others are answered below. Questions are not in chronological order, but in the order in which they were documented.- Q: Do you recommend using the charts Adjusted by dividends or not? And why? A: Given that chart patterns most of the time reach their price objectives earlier than a dividend cycle and we are most of the time not eligible for the dividends, I exclude them from my calculation and use unadjusted charts. It is important for me to have levels that are recognized by market participants. Boundaries that are tested several times and respected usually show the overall market's reaction and recognition of that level.
- Q: Why don't you use the extremes of specific patterns when drawing your horizontal levels? For instance, why don't you use the highest high within a rectangle? If the price breaks out of one of the lower highs but not the extreme high, don't you risk running into resistance immediately after a breakout? A: I try to chart and fit those horizontal boundaries with the best fit principle. Usually breakout confirmation levels are above the highest levels inside a pattern and a close above that confirmation level takes out the highs. 1:05:36
- Q: Do you find the R:R of a lot of trade unfavorable when you use, for instance, the high of the right shoulder as your invalidation or the outer end of a triangle? Some of these patterns are so high that your invalidation points become terribly wide. A: You don't need to take pattern negation as your stop-loss. A pattern negation level is the level at which pattern is not considered a rectangle, H&S etc. However a stop-loss can be much tighter and can be used for tactical purposes for better risk management. Please refer to educational videos on this subject where I differentiate between a stop-loss and pattern negation and how to improve the Reward/Risk by using tighter stops.
- Q: Did you consider "Monty Hall problem" for type 1-3 of breakouts? There is an analogy with choosing the 1/3 door when a breakout occurs. If I know for sure that break out is not type 1 anymore, the probability of success/hitting my stop changes significantly. A: Please e-mail aksel@techcharts.net. I'm interested to learn more and explore this. 1:06:52
- Q: You have pointed out for some months how unemployment is trending upward, which is the most accurate recession indicator. Could this be a further reason to derisk before the breach of the 1 year average? A: I try not to involve fundamental data in my trading decisions. There have been many times when fundamentals remained weak and markets strong. Even though in the end they might become correlated, our ability to remain in a position during this time can be at risk.
- Q: Could you address the Bitcoin price action? It broke the trend channel and is very close to key support. A: The trend channel has 2 touch points and might not be the best to consider in terms of trend change. While a breakdown of the year-long average will also break down the channel and become a high conviction signal. Because of that I would like to take the signal for trend change from the year-long average.
- Q: A prime broker is the internet search term, correct? A: Yes. This will give you the list of brokers that trade multiple markets and instruments from a single account.
- Q: How do you determine chart pattern negation level? A: With H&St top it is the high of the right shoulder. With H&S bottom, it is the low of the right shoulder. With symmetrical triangle is the low of the last swing inside the pattern. With rectangles it is the minor swing low inside the pattern. In other words "the swing low" inside a chart pattern.
- Q: Do you have any stats on how long it takes to reach the pattern target once the BO takes place? A: We don't have a stat on this but I will work on the data to better understand if this can be of value. 1:04:02
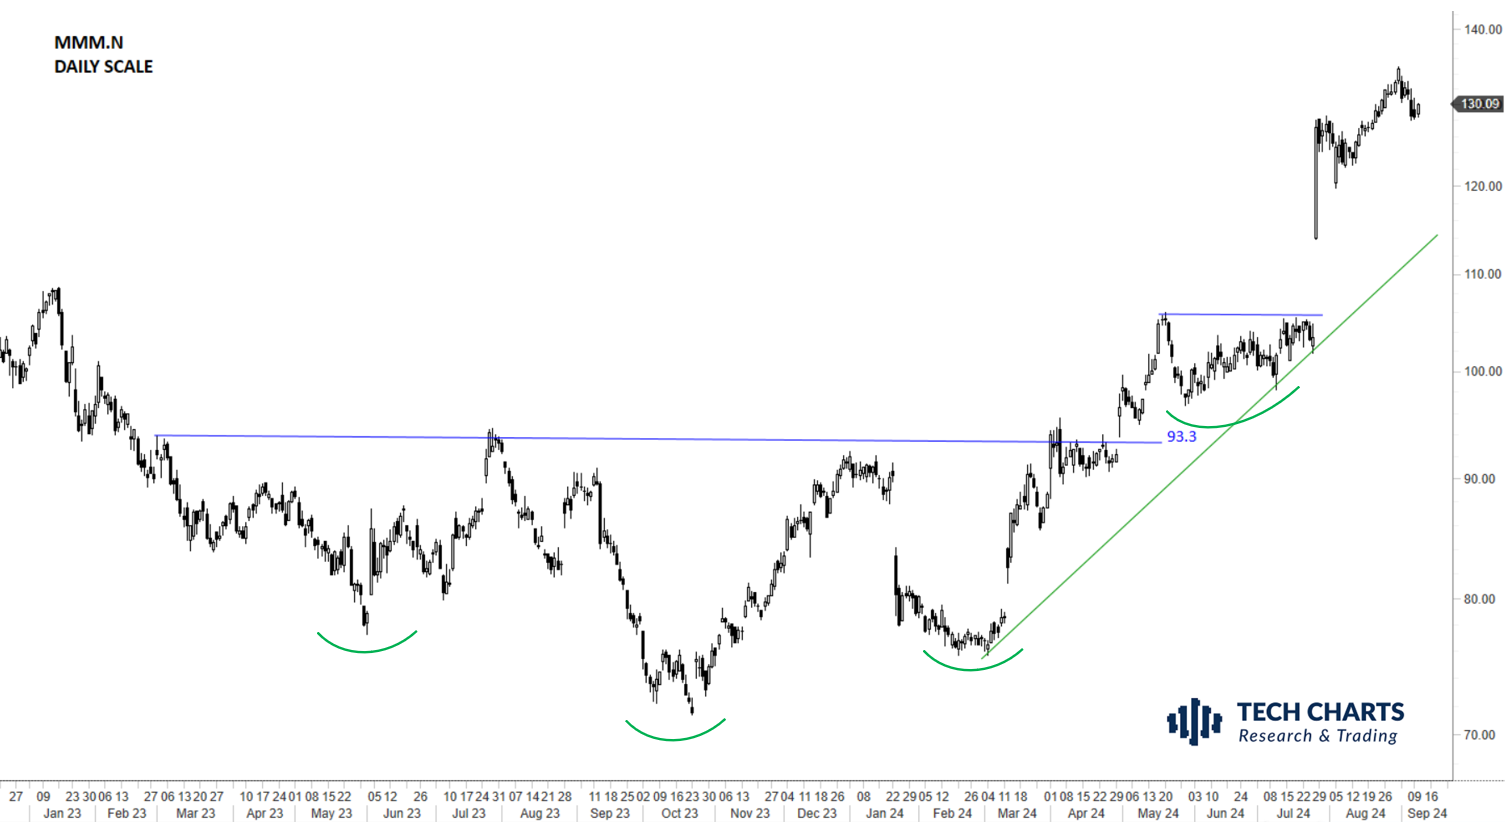
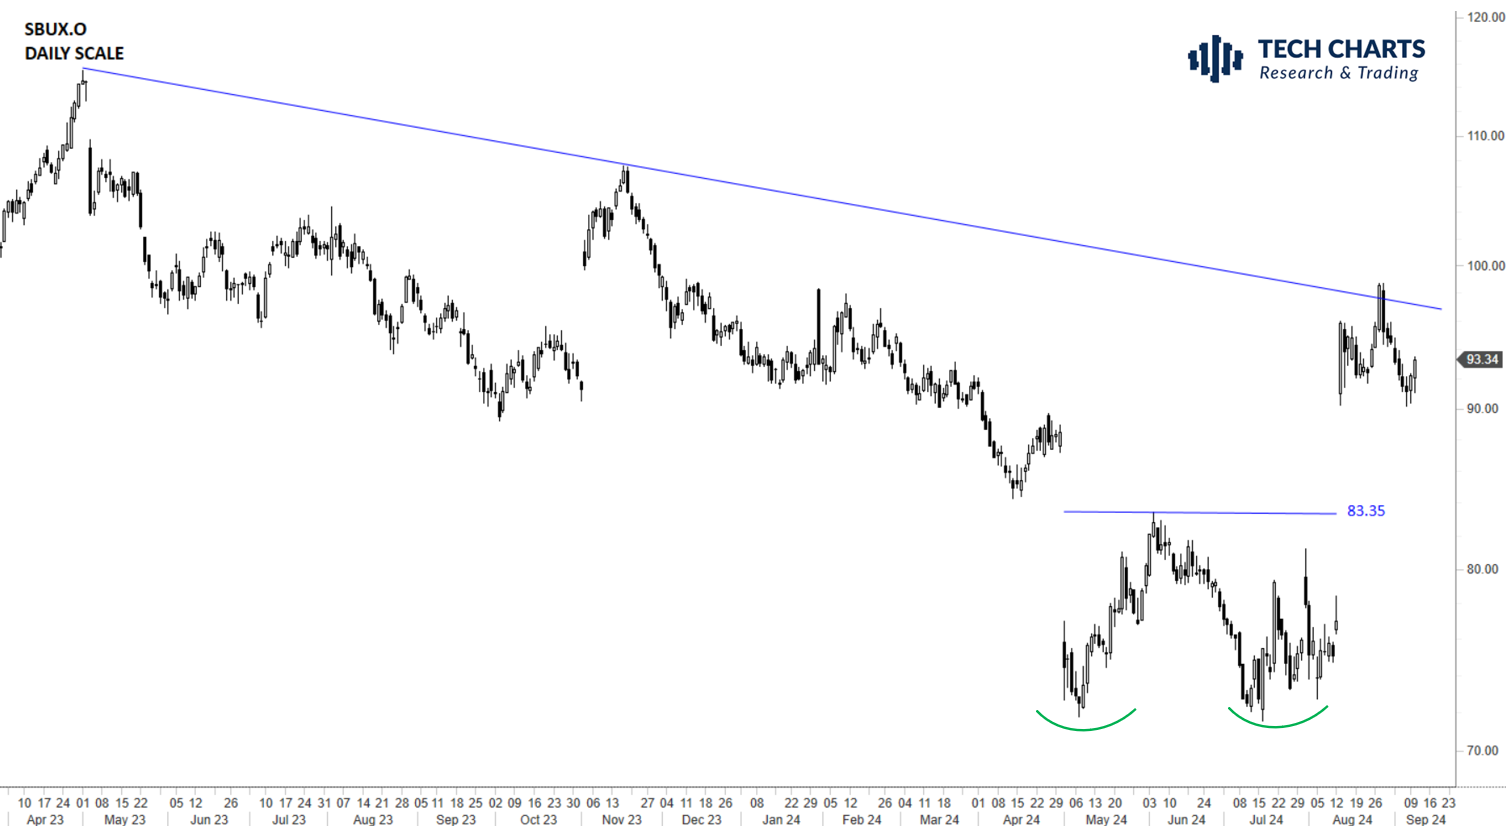
- Q: How to review stocks with big upward push in an otherwise struggling market. Ex., Can we check out 3M and SBUX? A: I always suggest treating each chart on its own merit. Sometimes markets are in correction though some sectors hold strong or even trend higher. This is due to fund managers constantly deploying cash from weak sectors to stronger ones in order to generate alpha or to beat their benchmarks. Price charts usually reveal such strength earlier than fundamentals.Both charts are in an uptrend and both completed bottom reversal patterns. MMM completed a larger scale H&S bottom reversal much earlier. SBUX completed a shorter-term double bottom with a gap opening. SBUX is now hitting trend resistance where it can form another short-term consolidation.
- Q: How much % of your portfolio is for investments, for swing trading, and any other derivative trading do you allocate? A: 20% of my personal funds are allocated for active trading (short-term) 40% is in fixed income and passive income generating assets (yields/cash + real estate) 40% is in long-term investments in financial markets (equities, ETFs, metals)
- Q: Which platform do you use for CFDs? I don't think we have CFDs in the USA. A: I'm not able to comment on brokerage services as I don't have a license. I also don't want to endorse any company due to risks being involved. If you run a quick research "prime brokers that offers CFDs" you will come across a long list of brokers. You just need to run your own due diligence on them.
- Q: What is the stop loss method do you use for trading your patterns? If the stock is moving upward and coming back, then what is the stop loss do you recommend? at entry and after entry? A: I use a volatility based ATR Trailing Stop. I've incorporated the indicator from this website where you can also learn more about chandelier exits (https://www.tradernexus.com/advancedstop/advancedstop.html)
- Q: Do you trade these patterns of stocks or indices in equities only? or do you trade these in futures and options as well? If you trade in futures and options, which strategy do you prefer? A: I trade these patterns in equities and ETFs. No futures or options trading. 55:11
- Q: Which platform do you use for futures trading and options trading? A: Answer in question 12. 55:11
- Q: For trailing SL, do you use any indicator? A: Answer in question 13. 1:03:22
- Q: Do you have any comments on monthly chart breakouts? I'm looking at multi-year consolidation at the life high of a stock. Examples: NDAQ, MDU, FCFS A: Breakouts on long-term charts are reliable. They have less noise in terms of spikes. If one can wait for confirmation from weekly and monthly scale price charts and manage risk with wider stops, then I think these long-term charts will have higher success rate. 1:01:57
- Q: Does Aksel always wait till the closing price is above/below the trigger price, then put in an order the next day? A: In a fast moving market, I apply a more aggressive scaling in tactic, though compromising on the win% due to failed attempts. I explained it in this educational video (https://blog.techcharts.net/index.php/2023/03/01/stop-limit-order-and-early-entry/)
- Q: Is there a free or paid service that sends out alerts based on stock price X minutes before markets close? For example, if I want to buy a stock if the closing price is above $40, if 15 minutes before the closing bell, the stock is already higher than $40.01, I get an alert. A: I try not to turn the membership service into a trade alert service. My aim is to help members become self-sufficient with their research and process so they can run their own trading operation without any outside support. Having said that, given that I'm providing breakout confirmation levels on each chart, with today's technology it is very easy for each member to place trade alerts that are sent directly to their e-mails from their trading platforms.
- Q: I noticed the cut-loss level is sometimes much lower than the entry price (assuming we are long a stock), which causes the reward:risk ratio to close to 1:1. Does Aksel personally enter those trades? A: Please note that the red labels are not stop-loss levels. They are chart pattern negation levels. Stop-loss can be much tighter than the chart pattern negation level and as long as pattern negation level is not reached, a trader can attempt for a re-entry strategy which is explained in Type 3 breakout videos.
- Q: How does Aksel set his stop loss once he enters a trade? And does he use intra-day price or closing price for stop-loss orders? A: Please refer to this educational video for stop-loss placement and trailing a trade. (https://blog.techcharts.net/index.php/2023/03/01/stop-limit-order-and-early-entry/)
- Q: Can Aksel consider some bot service to send out alerts for establishing/exiting a new stock position? A: Please refer to question 19.
- Q: In your most recent report you mentioned "Failure to remain in the trend channel will risk breaking down the long-term average and a possible trend reversal." This is currently taking place, isn't this enough of a reason to de-risk? Isn't waiting for a breach of the 1 year average giving away much of the current bull market gains?? (which if one waits for a weekly close basis could be even lower than the actual 1 year average level) 57:09
- Q: Doesn't the recent sequence of lower highs suggest distribution/weakness and that the line of least resistance is most likely downward, adding to the significance of the breach of the trend channel and potential loss of the 56K support? 57:09
- Could you please review the chart for ADBE (5 year /weekly) ? I see a larger C&H pattern starting on Dec 6, 2022, but also a smaller one inside it starting on March 4, 2024 & now forming a neckline now at an approximate level of $580.00 Are there 2 C&H or am I imagining this? If there are in fact, 2 C&H's, does having one pattern inside another increase the pattern's chance of a success that I heard you mention before. (There is also a C&H on a 3 year/daily chart naturally) Also, in case there is a C&H inside a larger one (5 year/ weekly), how would you trade this and manage the trade or trades and how would you choose the targets? On a larger C&H what neckline do you see: the $638 level or higher? I often see something like this and not sure what to choose a smaller or a larger C&H (sometimes i see the same thing on H&S patterns as well) 59:14
- My question concerned to following; how can I measure price target for HS top when target is going to ‘minus’ - on the chart. For example on the $algo chart. Do I measure the arrow or the percentages? 1:00:49