GLOBAL EQUITY MARKETS – December 9, 2023

REVIEW


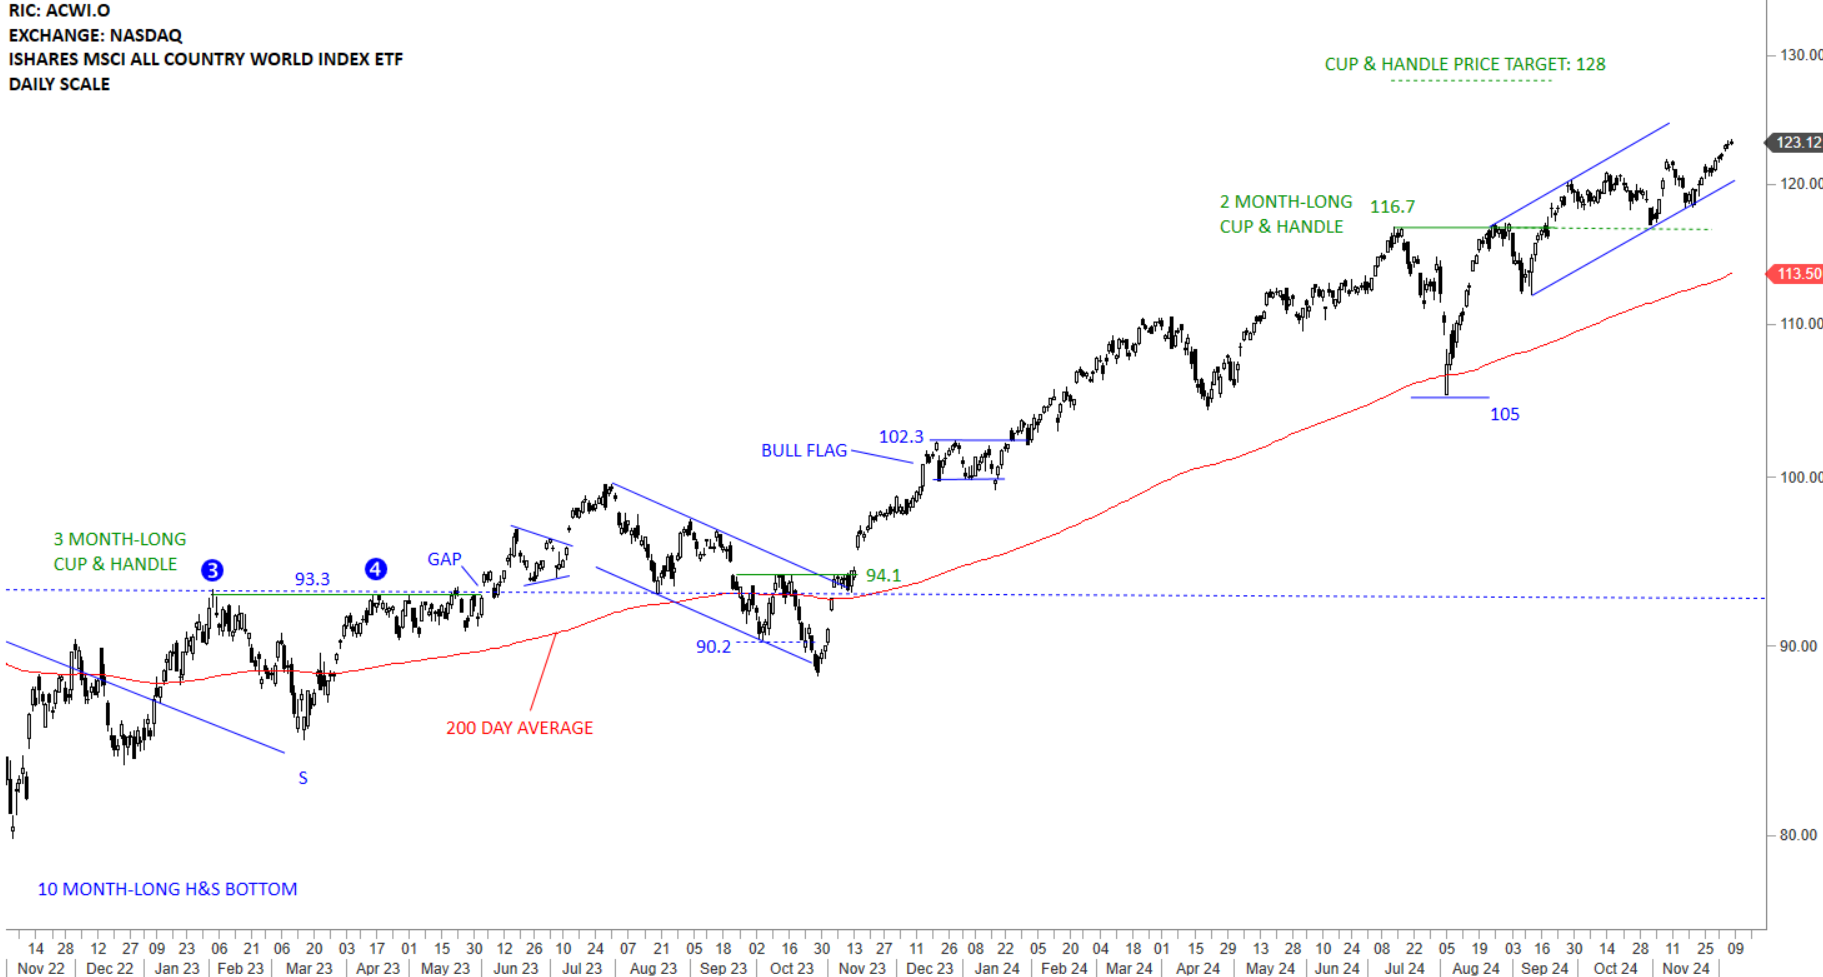
The benchmark for the Global equity markets performance, the iShares MSCI All Country World Index ETF (ACWI.O) is trying to stabilize above the 200-day average. The ETF is holding on to its gains and resuming towards the next resistance at 99.5 levels. With the recovery above the 200-day average, I start monitoring the chart with a bullish perspective. During any pullback the ETF can fill the gap above 94.1 levels, which could be considered as a pullback to the long-term average. Long-term H&S bottom price target stands at 109 levels. Breakout above 99.5 levels can resume the uptrend towards the H&S bottom price target at 109 levels.

Read More

Live Webinar and Q&A with Aksel – Thursday, December 14, 2023, 8:30 am mountain

Dear Tech Charts Members, We are continuing our Member webinar series with chart pattern reliability and how the latest market conditions have impacted success rates on different chart patterns. We plan to have an interactive session and an open discussion to answer members' questions on different markets and specific charts of interest. Please send your charts and questions to aksel@techcharts.net, and I will add them to the webinar discussion points. Scheduled for: Thursday, December 14, 8:30 am mountain (register below) Read More

GLOBAL EQUITY MARKETS – December 2, 2023

REVIEW


The benchmark for the Global equity markets performance, the iShares MSCI All Country World Index ETF (ACWI.O) is trying to stabilize above the 200-day average. The ETF is holding on to its gains and resuming towards the next resistance at 99.5 levels. With the recovery above the 200-day average, I start monitoring the chart with a bullish perspective. During any pullback the ETF can fill the gap above 94.1 levels, which could be considered as a pullback to the long-term average. Long-term H&S bottom price target stands at 109 levels.

Read More

CRYPTOCURRENCIES – November 26, 2023

BTCUSD reached rectangle price target at 38K. Uptrend remains intact. Short-term consolidation below 38K can act as a bullish continuation. ETHUSD chart might be forming a rising wedge with the upper boundary acting at resistance at 2260 levels. ETHUSD also has a channel price target at 2260 levels, an inflection point. Read More

GLOBAL EQUITY MARKETS – November 25, 2023

REVIEW


The benchmark for the Global equity markets performance, the iShares MSCI All Country World Index ETF (ACWI.O) is trying to stabilize above the 200-day average. The ETF held on to last week's gains. Two short-term resistance levels are at 97.4 and 99.5. With the recovery above the 200-day average, I start monitoring the chart with a bullish perspective. During any pullback the ETF can fill the gap above 94.1 levels. Long-term H&S bottom price target stands at 109 levels.

Read More

GLOBAL EQUITY MARKETS – November 18, 2023

REVIEW


The benchmark for the Global equity markets performance, the iShares MSCI All Country World Index ETF (ACWI.O) is trying to stabilize above the 200-day average. Strong open to the week with a gap was followed by continued strength that pushed the ETF towards the minor resistance at 97.4 levels. With the recovery above the 200-day average, I start monitoring the chart with a bullish perspective. Short-term resistance is at 97.4 and support is at 94.1 level. During any pullback the ETF can fill the gap above 94.1 levels. Long-term H&S bottom price target stands at 109 levels.

Read More

CRYPTOCURRENCIES – November 12, 2023

BTCUSD reaches rectangle price target at 38K. Uptrend remains intact. ETHUSD chart is might be forming a rising wedge with the upper boundary acting at resistance at 2260 levels. ETHUSD also has a channel price target at 2260 levels, an inflection point. Read More

GLOBAL EQUITY MARKETS – November 11, 2023

REVIEW


The benchmark for the Global equity markets performance, the iShares MSCI All Country World Index ETF (ACWI.O) is trying to stabilize above the 200-day average. The gap around 93 levels is filled. There is a wider gap below the 200-day average that might get filled. With the recovery above the 200-day average, I start monitoring the chart with a bullish perspective. One possibility is that the ETF can pullback to fill the larger gap and form the right shoulder of a short-term bottom reversal. The ETF can resume higher without any pullback. In that case I will continue to take breakout signals on single equities.

Read More

INTERIM UPDATE – November 10, 2023

During the daily charts review I came across those text-book opportunities which I think are time sensitive and fresh opportunities as breakdown candidates. Below are the latest additions to Tech Charts watchlist. These charts will also be included in the weekly update. I also plan to add more ideas to the watchlist in the upcoming Global Equity Markets report (scheduled for 11/11/2023).

Read More

GLOBAL EQUITY MARKETS – November 4, 2023

REVIEW


The benchmark for the Global equity markets performance, the iShares MSCI All Country World Index ETF (ACWI.O) had an impressive rebound towards the 200-day average. Sharp rebound from 90 levels left few gaps that might get filled in the next few trading sessions. With the recovery above the 200-day average, I will start monitoring the chart with a bullish perspective. One possibility is that the ETF can pullback to fill the gaps and form the right shoulder of a short-term bottom reversal. Breach of a 200-day moving average both on the upside and on the downside is not a trading signal for me. I would like to see a classical chart pattern completion. The ETF can resume higher without any pullback. In that case I will continue to take breakout signals on single equities.

Read More