Review of Risk/Reward in Type 1 and Type 2 Breakouts – December 2023 Tech Charts Member Webinar

Review of Risk/Reward in Type 1 and Type 2 Breakouts - December 2023 Tech Charts Member Webinar

Webinar Outline
  • Review of chart pattern statistics and discussion on chart pattern reliability covering the 4th quarter of 2023 and YTD numbers
  • Review of global equity markets and latest opportunities
  • Breakouts after a minimum 3 tests of pattern boundaries and what we can expect around breakout levels.
  • How to manage Type 1 and Type 2 breakouts in order to maximize the potential of a breakout
  • Member questions

Live Questions from Members

  1. Can you let me know your thoughts on the FTSE 250 chart? 51:29
  2. What is the outlook for DXY in the near term? 52:51
  3. When multiple breakouts occur simultaneously, how do you choose which ones to trade? 54:13
  4. When does Aksel choose to use the 1.5% breakout rule, over the 3% rule? Is there a specific criteria for 1.5% instead of 3%, or does the eye simply judge it? 54:56
  5. Could we have a view/comment on the current metal run, particularly Gold, Copper, and silver, and the bearish nature of the USD. 55:52
  6. Do you take all trades with a clear pattern or only take trades with a clear pattern and a minimum reward-to-risk ratio? 57:17
  7. Do you use a screen/filter to identify a shortlist of charts from which you eyeball for patterns? 58:47
  8. Regarding the pattern statistics: Have you considered organizing pattern success rates by Exchange? My assumption is that Turkey and Japan had much higher than average win rates this year, while the U.S. had much lower. If one can only trade a single region, they likely experience very different success rates and must adjust accordingly. 59:36
  9. ATR STOP is based on 30 day ATR * 3? 01:00:39
  10. Do you only highlight breakouts that will be above the 200 day m.a.? 01:00:56
Recorded live 12.14.2023 Read More

GLOBAL EQUITY MARKETS – December 16, 2023

REVIEW


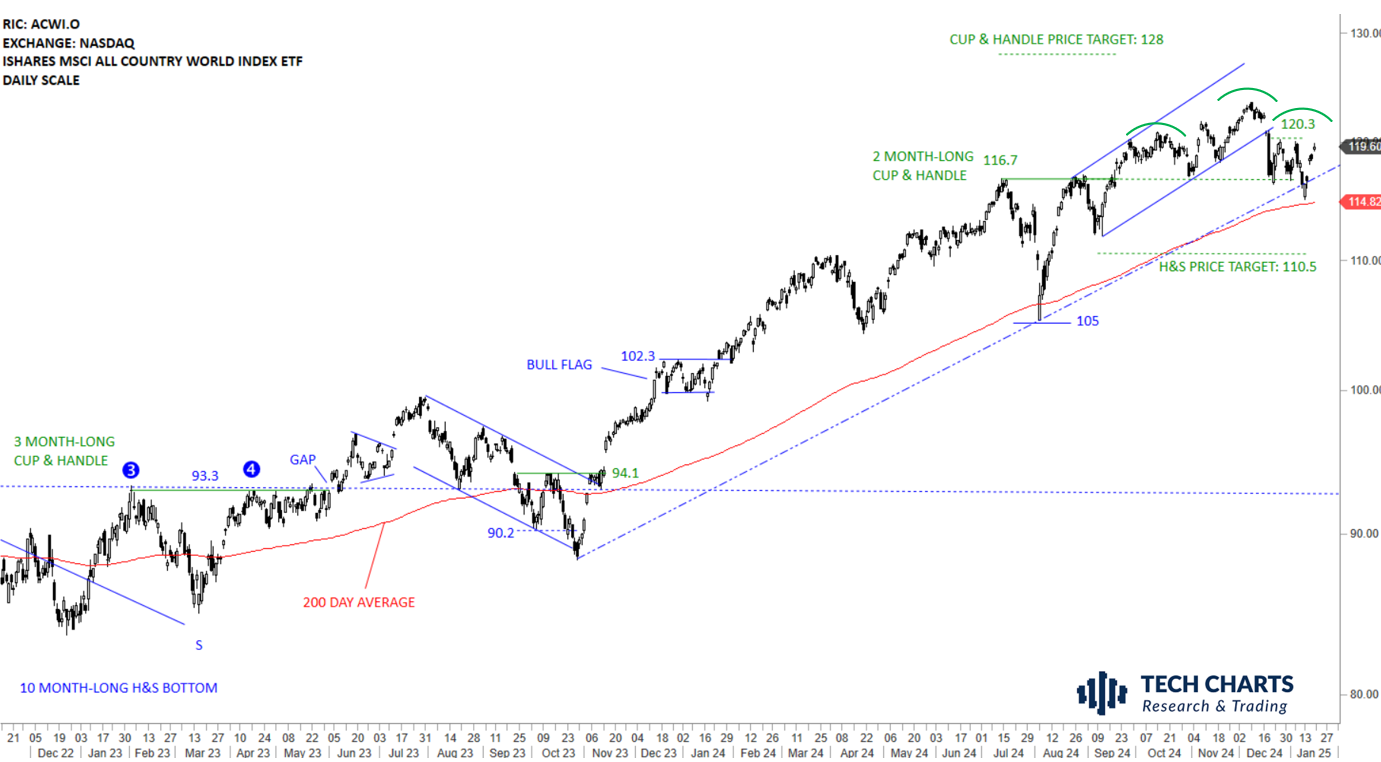
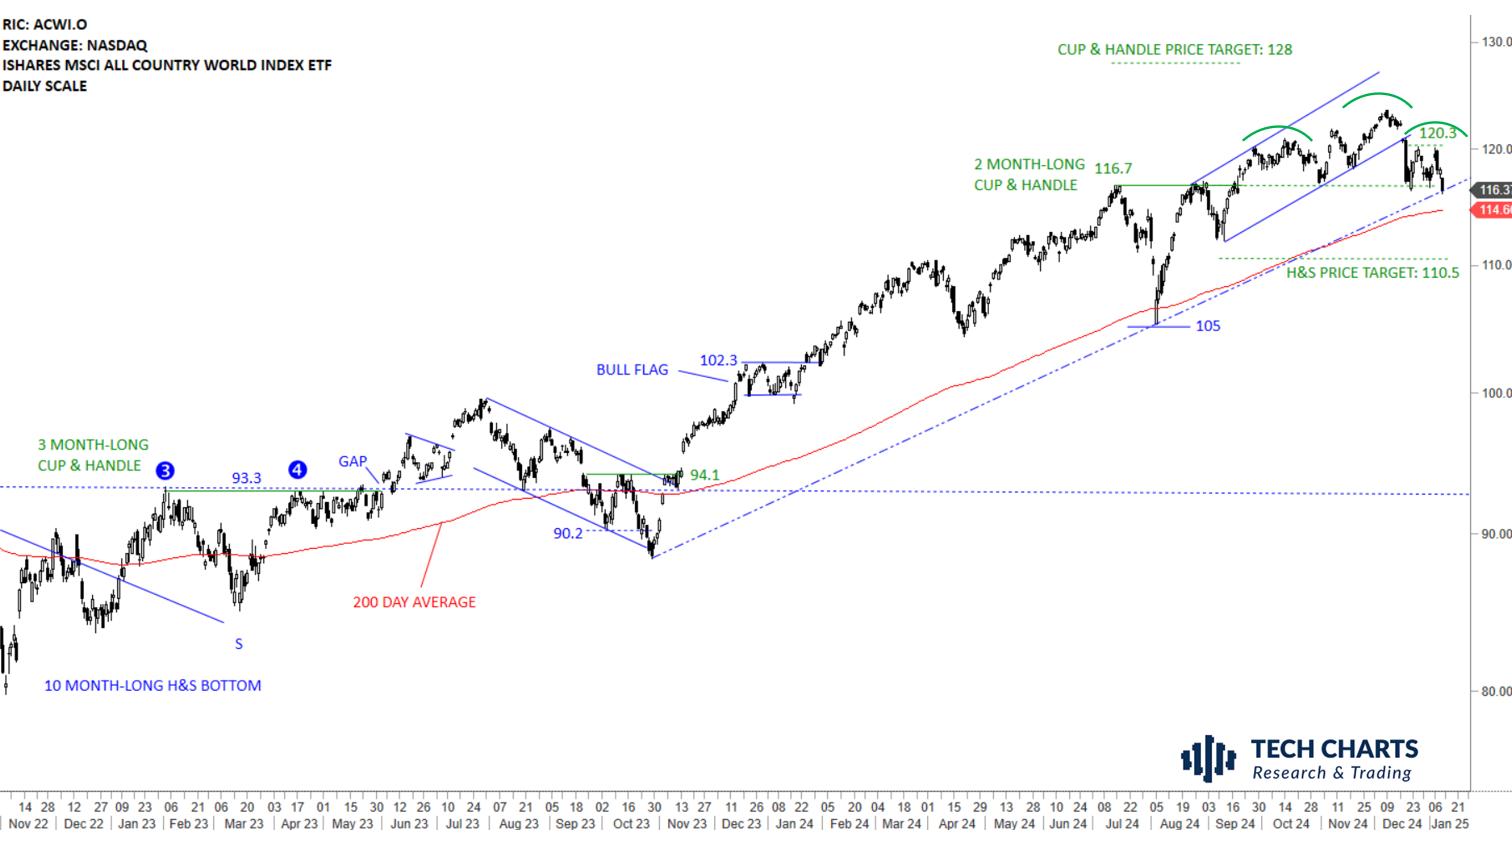
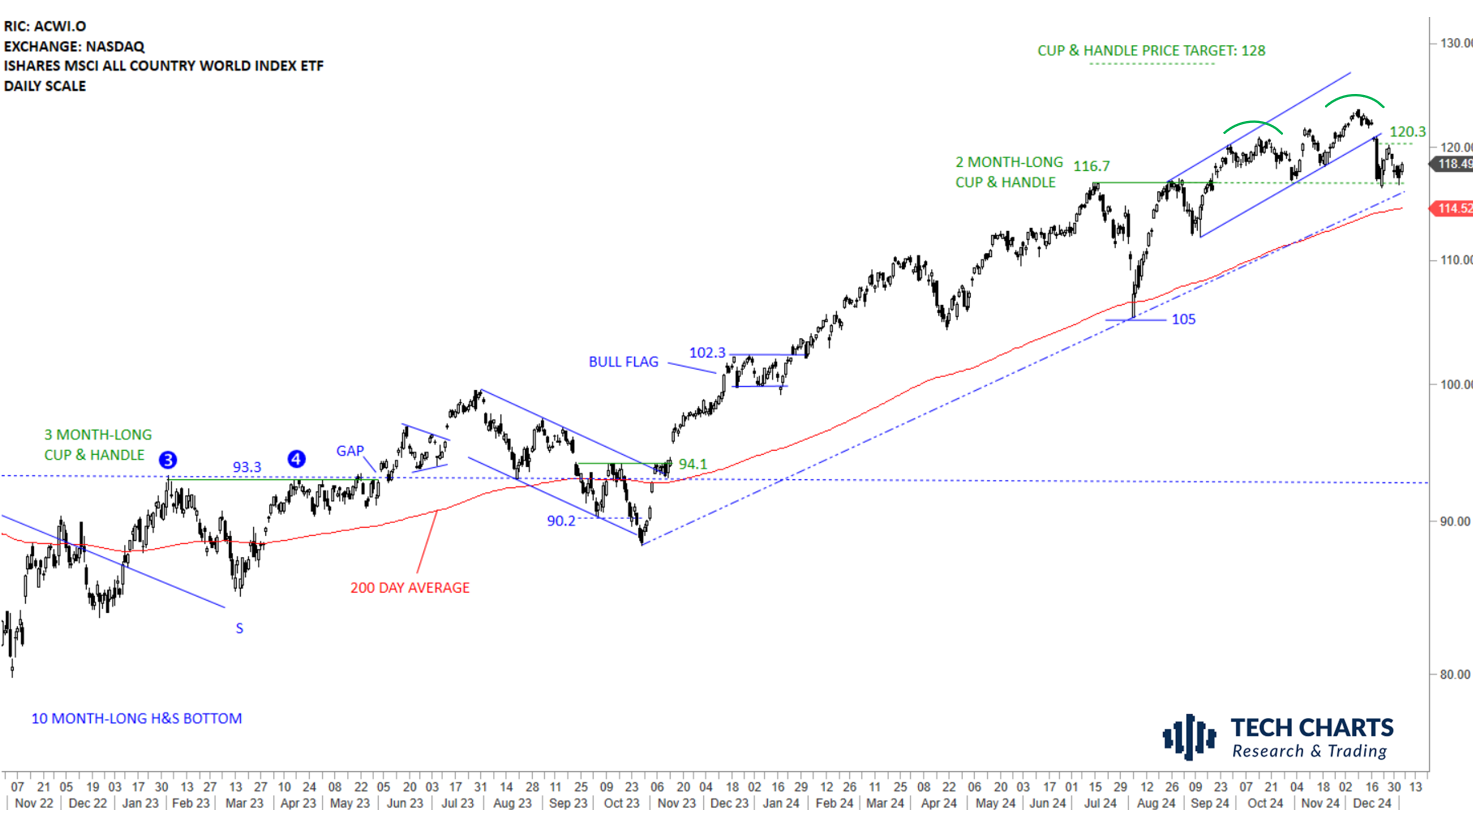
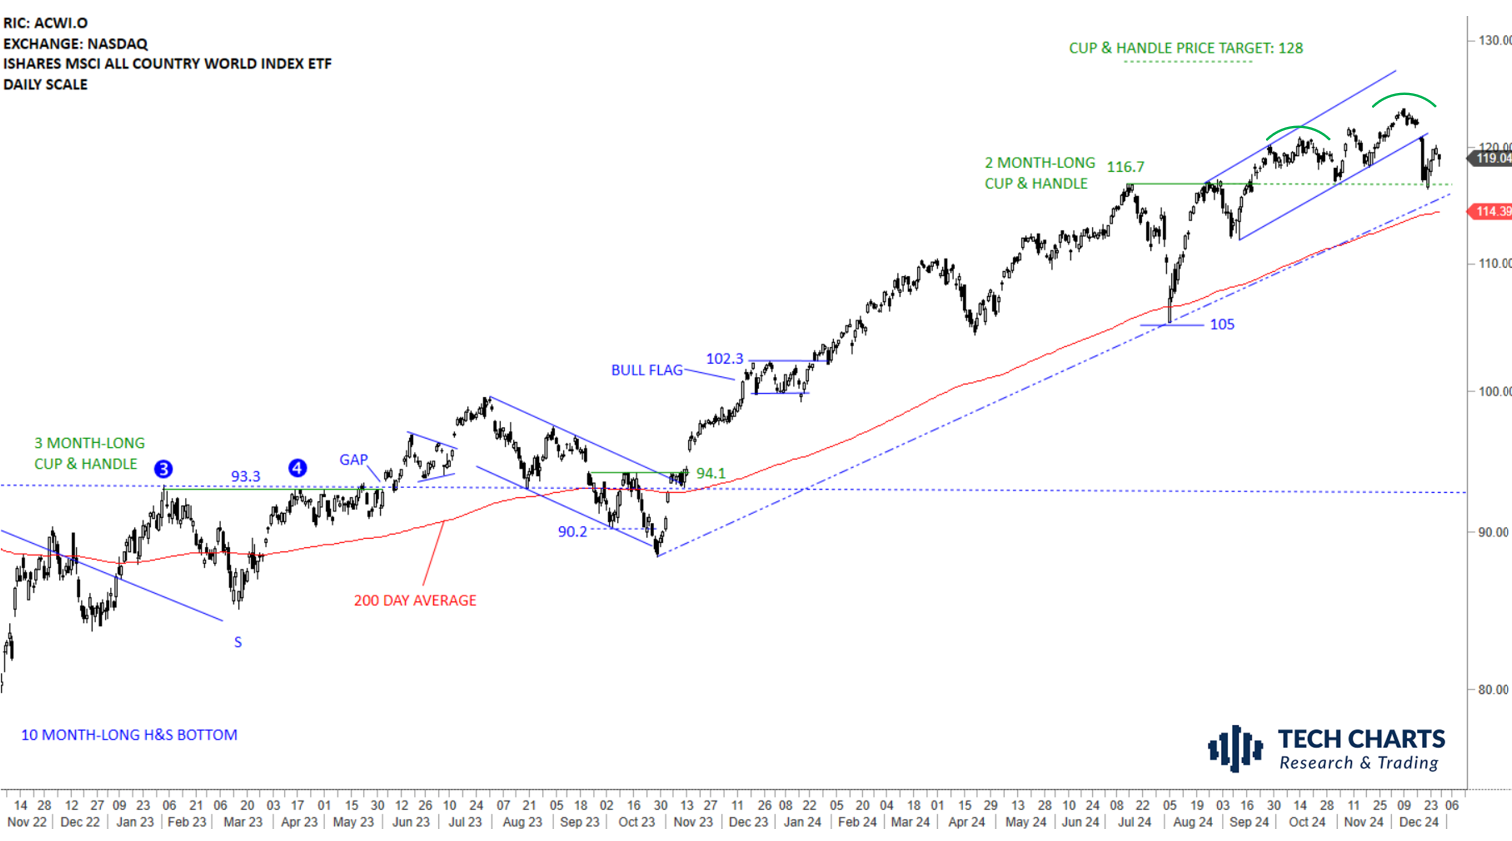
The benchmark for the Global equity markets performance, the iShares MSCI All Country World Index ETF (ACWI.O) cleared both minor resistances at 97.4 and 99.5 levels. The ETF is clearly above its 200-day average and in a steady uptrend. Long-term H&S bottom price target stands at 109 levels. Breakout above 99.5 levels is resuming the uptrend towards the H&S bottom price target at 109 levels. During any pullback 99.5 levels can act as short-term support.

Read More

CRYPTOCURRENCIES – December 10, 2023

BTCUSD reached rectangle price target at 38K. Uptrend remains intact. Short-term consolidation below 38K acted as a bullish continuation. ETHUSD reached its channel price target at 2,260 levels and now challenging the upper boundary of the possible rising wedge. Breakouts above the upper boundary of a rising wedge is usually followed by strong rallies. Read More

GLOBAL EQUITY MARKETS – December 9, 2023

REVIEW


The benchmark for the Global equity markets performance, the iShares MSCI All Country World Index ETF (ACWI.O) is trying to stabilize above the 200-day average. The ETF is holding on to its gains and resuming towards the next resistance at 99.5 levels. With the recovery above the 200-day average, I start monitoring the chart with a bullish perspective. During any pullback the ETF can fill the gap above 94.1 levels, which could be considered as a pullback to the long-term average. Long-term H&S bottom price target stands at 109 levels. Breakout above 99.5 levels can resume the uptrend towards the H&S bottom price target at 109 levels.

Read More

Live Webinar and Q&A with Aksel – Thursday, December 14, 2023, 8:30 am mountain

Dear Tech Charts Members, We are continuing our Member webinar series with chart pattern reliability and how the latest market conditions have impacted success rates on different chart patterns. We plan to have an interactive session and an open discussion to answer members' questions on different markets and specific charts of interest. Please send your charts and questions to aksel@techcharts.net, and I will add them to the webinar discussion points. Scheduled for: Thursday, December 14, 8:30 am mountain (register below) Read More

GLOBAL EQUITY MARKETS – December 2, 2023

REVIEW


The benchmark for the Global equity markets performance, the iShares MSCI All Country World Index ETF (ACWI.O) is trying to stabilize above the 200-day average. The ETF is holding on to its gains and resuming towards the next resistance at 99.5 levels. With the recovery above the 200-day average, I start monitoring the chart with a bullish perspective. During any pullback the ETF can fill the gap above 94.1 levels, which could be considered as a pullback to the long-term average. Long-term H&S bottom price target stands at 109 levels.

Read More

CRYPTOCURRENCIES – November 26, 2023

BTCUSD reached rectangle price target at 38K. Uptrend remains intact. Short-term consolidation below 38K can act as a bullish continuation. ETHUSD chart might be forming a rising wedge with the upper boundary acting at resistance at 2260 levels. ETHUSD also has a channel price target at 2260 levels, an inflection point. Read More

GLOBAL EQUITY MARKETS – November 25, 2023

REVIEW


The benchmark for the Global equity markets performance, the iShares MSCI All Country World Index ETF (ACWI.O) is trying to stabilize above the 200-day average. The ETF held on to last week's gains. Two short-term resistance levels are at 97.4 and 99.5. With the recovery above the 200-day average, I start monitoring the chart with a bullish perspective. During any pullback the ETF can fill the gap above 94.1 levels. Long-term H&S bottom price target stands at 109 levels.

Read More

GLOBAL EQUITY MARKETS – November 18, 2023

REVIEW


The benchmark for the Global equity markets performance, the iShares MSCI All Country World Index ETF (ACWI.O) is trying to stabilize above the 200-day average. Strong open to the week with a gap was followed by continued strength that pushed the ETF towards the minor resistance at 97.4 levels. With the recovery above the 200-day average, I start monitoring the chart with a bullish perspective. Short-term resistance is at 97.4 and support is at 94.1 level. During any pullback the ETF can fill the gap above 94.1 levels. Long-term H&S bottom price target stands at 109 levels.

Read More

CRYPTOCURRENCIES – November 12, 2023

BTCUSD reaches rectangle price target at 38K. Uptrend remains intact. ETHUSD chart is might be forming a rising wedge with the upper boundary acting at resistance at 2260 levels. ETHUSD also has a channel price target at 2260 levels, an inflection point. Read More