“Demystifying the world of Classical Charting”
– AKSEL KIBAR
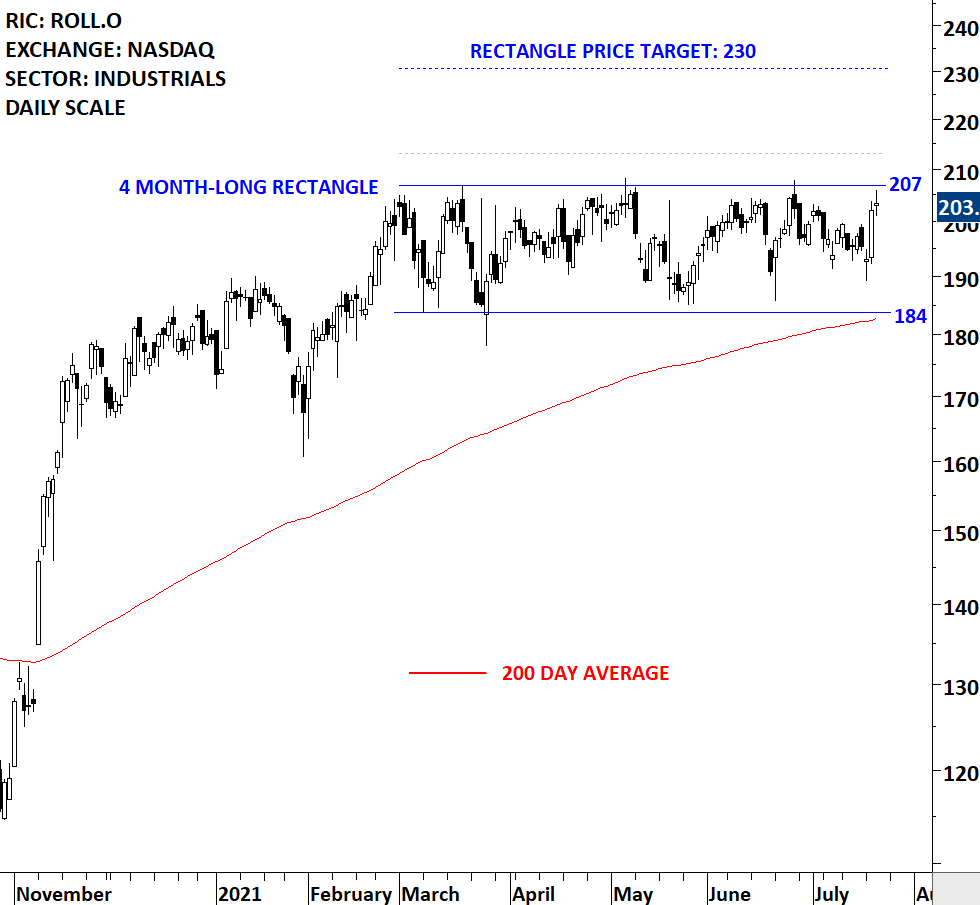
Every week Tech Charts Global Equity Markets report features some of the well-defined, mature classical chart patterns under a lengthy watchlist and the chart pattern breakout signals that took place during that week. Global Equity Markets report covers single stocks from developed, emerging and frontier markets, ETF’s, select commodities, cryptocurrencies and global equity indices. The report starts with a review section that highlights the important chart developments on global equity benchmarks. This blog post features from the watchlist section RBC BEARINGS INC (ROLL.O) listed on the Nasdaq Stock Exchange.
RBC Bearings Incorporated is an international manufacturer and marketer of engineered precision bearings and products, which are integral to the manufacture and operation of machines, aircraft and mechanical systems. The stock is listed on the Nasdaq Stock Exchange. Price chart formed a 4 month-long rectangle with the horizontal boundary acting as strong resistance at 207.00 levels. The horizontal boundary was tested several times over the course of the chart pattern. A daily close above 213.00 levels will confirm the breakout from the 4 month-long rectangle with the possible chart pattern price target of 230.00 levels. Breakout can push the stock to all-time highs.

By becoming a Premium Member, you’ll be able to improve your knowledge of the principles of classical charting.
With this knowledge, you can merge them with your investing system. In fact, some investors use my analyses to modify their existing style to invest more efficiently and successfully.
You will receive:
For your convenience your membership auto renews each year.
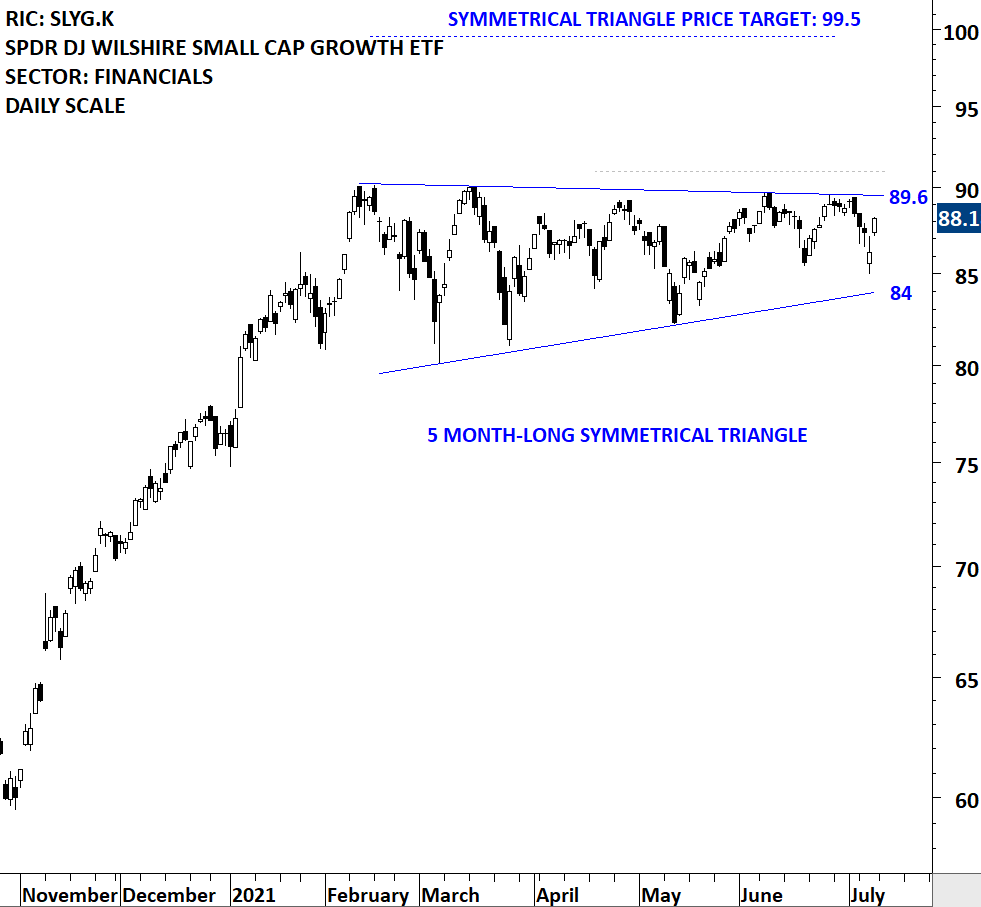
Every week Tech Charts Global Equity Markets report features some of the well-defined, mature classical chart patterns under a lengthy watchlist and the chart pattern breakout signals that took place during that week. Global Equity Markets report covers single stocks from developed, emerging and frontier markets, ETF’s, select commodities, cryptocurrencies and global equity indices. The report starts with a review section that highlights the important chart developments on global equity benchmarks. This blog post features from the watchlist section SPDR DJ WILSHIRE SMALL CAP GROWTH ETF (SLYG.K) listed on the New York Stock Exchange. If you think this ETF has low liquidity, the same outlook applies in general to small cap etfs.
The Fund seeks to approximate, before expenses, the investment results of the Dow Jones Small Cap Growth Index. The ETF is listed on the New York Stock Exchange. Price chart formed a 5 month-long symmetrical triangle with the upper boundary acting as strong resistance at 89.60 levels. The upper boundary was tested several times over the course of the chart pattern. A daily close above 91.00 levels will confirm the breakout from the 5 month-long symmetrical triangle with the possible chart pattern price target of 99.50 levels. Breakout can push the ETF to all-time highs.
By becoming a Premium Member, you’ll be able to improve your knowledge of the principles of classical charting.
With this knowledge, you can merge them with your investing system. In fact, some investors use my analyses to modify their existing style to invest more efficiently and successfully.
You will receive:
For your convenience your membership auto renews each year.

Every week Tech Charts Global Equity Markets report features some of the well-defined, mature classical chart patterns under a lengthy watchlist and the chart pattern breakout signals that took place during that week. Global Equity Markets report covers single stocks from developed, emerging and frontier markets, ETF’s, select commodities, cryptocurrencies and global equity indices. The report starts with a review section that highlights the important chart developments on global equity benchmarks. This blog post features from the watchlist section Country Garden Services Holdings Company Limited listed on the Hong Kong Stock Exchange.
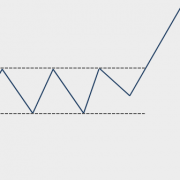
A high conviction setup for me needs to tick the boxes below. I look for few qualities with the perfect setups. These are:
![]() A well defined chart pattern with horizontal boundaries
A well defined chart pattern with horizontal boundaries
![]() Preferably a rectangle chart pattern in duration 2 months – 24 months
Preferably a rectangle chart pattern in duration 2 months – 24 months
![]() A bullish setup (or breakout) taking place above the long-term (200 day) average
A bullish setup (or breakout) taking place above the long-term (200 day) average
![]() Preferably a breakout to all-time highs (path of least resistance)
Preferably a breakout to all-time highs (path of least resistance)
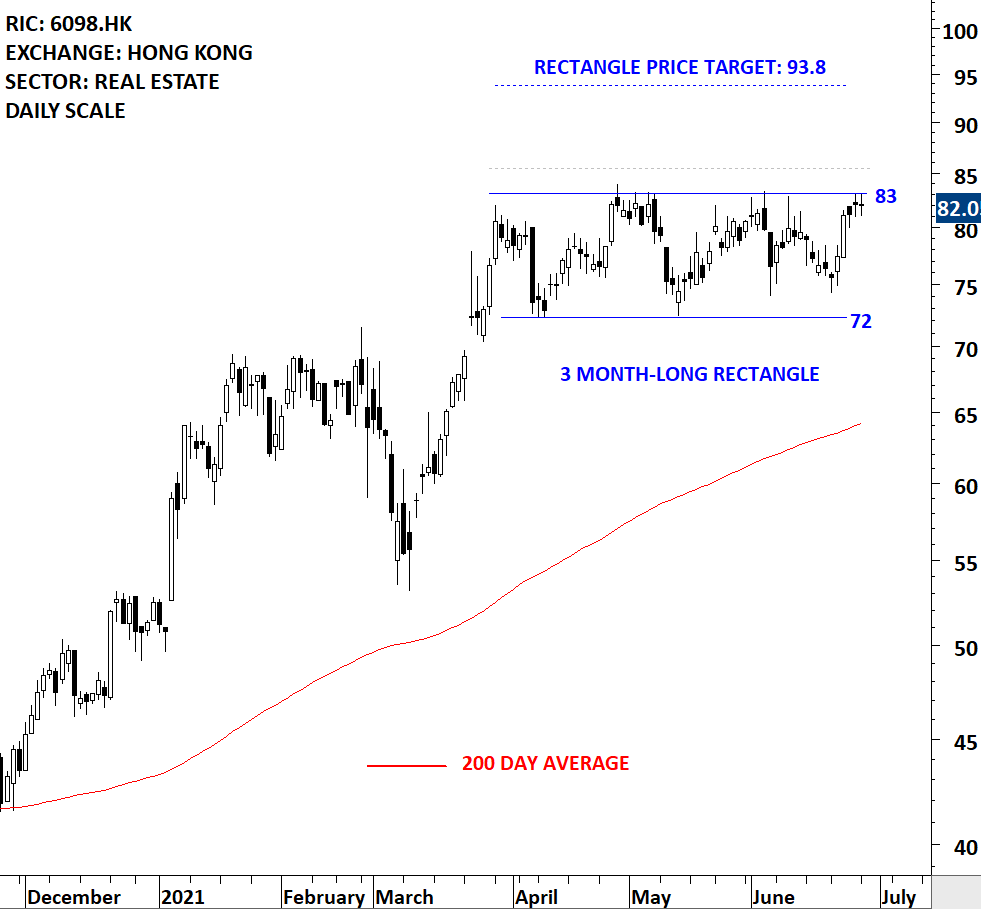
The chart below is a candidate for a high conviction setup.
Country Garden Services Holdings Company Limited is a China-based provider of residential property management services. The Company mainly provides property management services, community value-added services and non-owner value-added services. The stock is listed on the Hong Kong Stock Exchange. Price chart formed a 3 month-long rectangle with the horizontal boundary acting as strong resistance at 83.00 levels. The horizontal boundary was tested several times over the course of the chart pattern. A daily close above 85.50 levels will confirm the breakout from the 3 month-long rectangle with the possible chart pattern price target of 93.80 levels.
By becoming a Premium Member, you’ll be able to improve your knowledge of the principles of classical charting.
With this knowledge, you can merge them with your investing system. In fact, some investors use my analyses to modify their existing style to invest more efficiently and successfully.
You will receive:
For your convenience your membership auto renews each year.

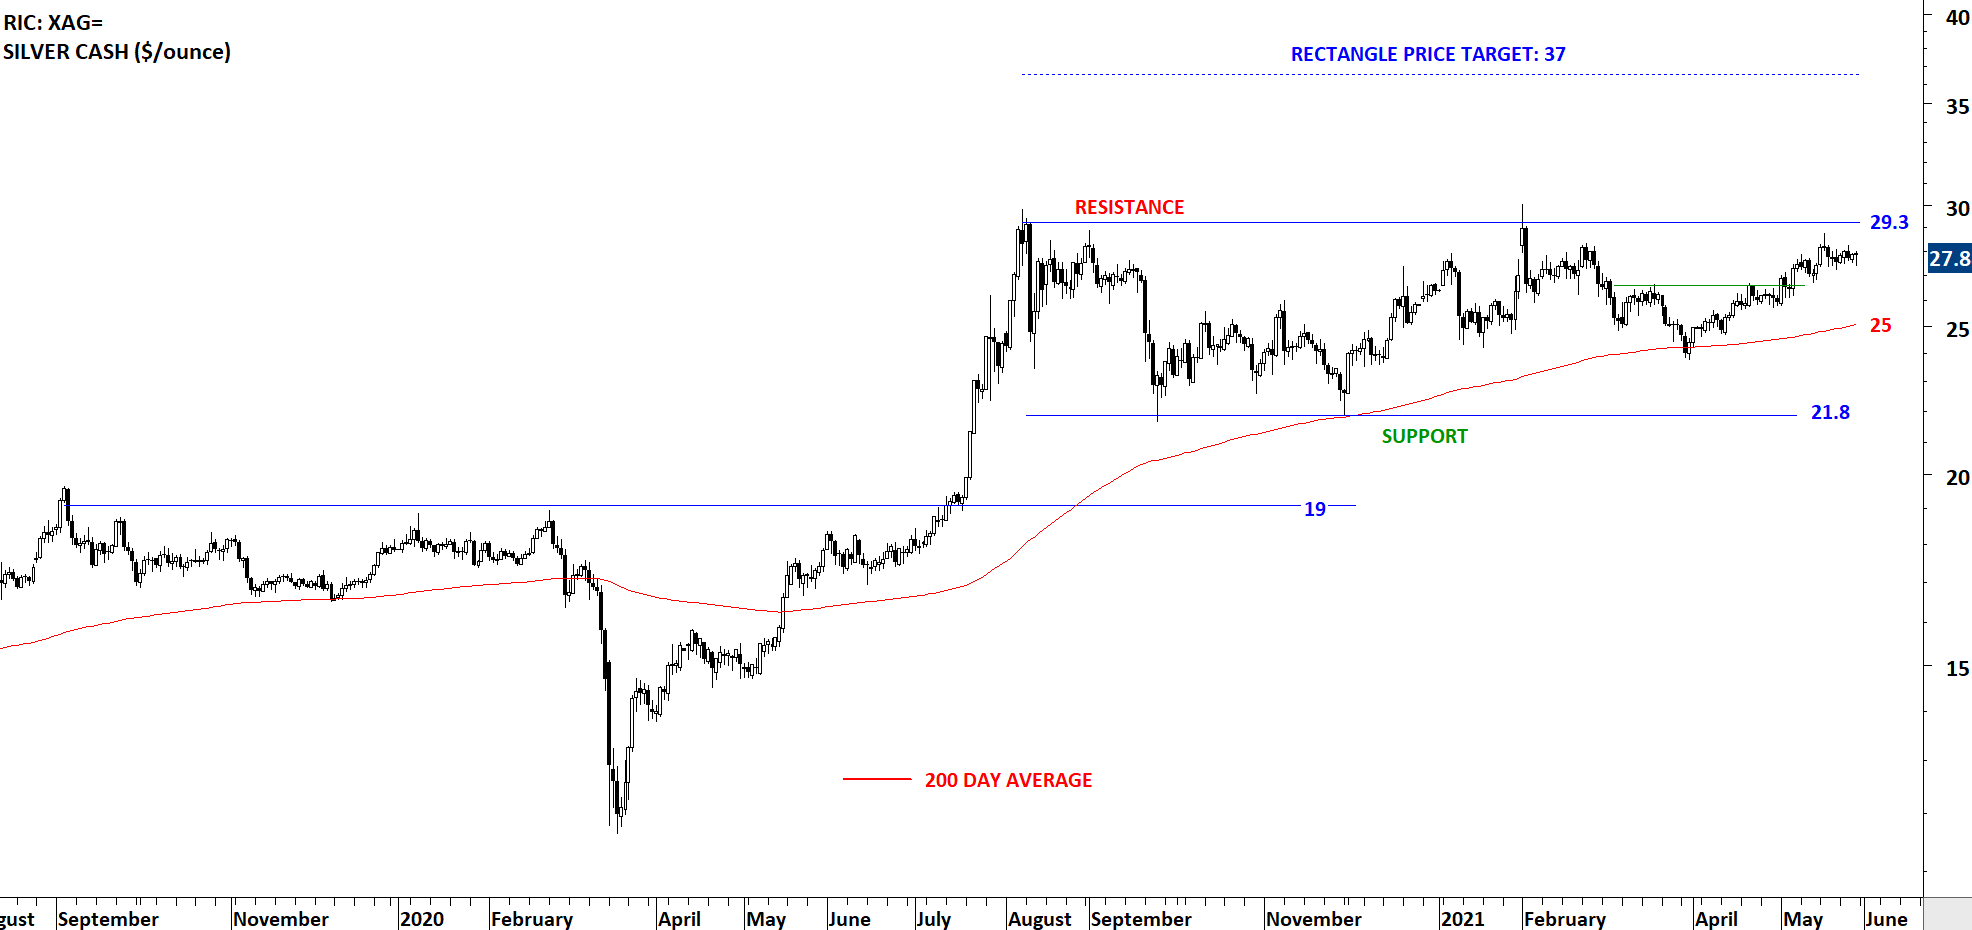
Every week Tech Charts Global Equity Markets report features some of the well-defined, mature classical chart patterns under a lengthy watchlist and the chart pattern breakout signals that took place during that week. Global Equity Markets report covers single stocks from developed, emerging and frontier markets, ETF’s and global equity indices. The report starts with a review section that highlights the important chart developments on global equity benchmarks. This blog post features from the review section SILVER cash price.
After breaking above 19 levels in July 2020, Silver is consolidating and reverting back to its 200-day average. A strong support area can be identified between 21.8 and 25. The boundaries of the consolidation are 21.8 and 29.3. Price remains above the 200-day average and the trend is up. Breakout above the upper boundary at 29.3 can add momentum to the uptrend. If the consolidation completes on the upside, possible price target will be 37 levels. Failure to hold above the 200-day average can result in a re-test of the lower boundary at 21.8 levels. A possible short-term H&S bottom reversal completed above the 200-day average.
By becoming a Premium Member, you’ll be able to improve your knowledge of the principles of classical charting.
With this knowledge, you can merge them with your investing system. In fact, some investors use my analyses to modify their existing style to invest more efficiently and successfully.
You will receive:
For your convenience your membership auto renews each year.

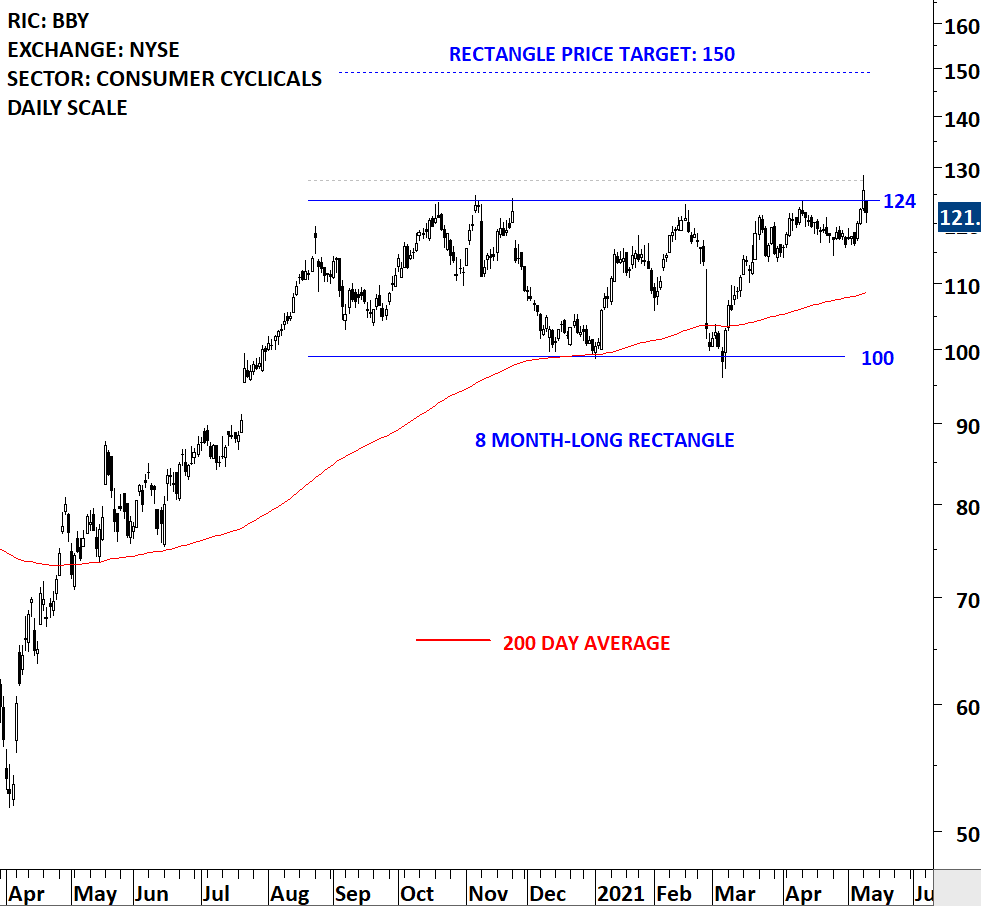
Every week Tech Charts Global Equity Markets report features some of the well-defined, mature classical chart patterns under a lengthy watchlist and the chart pattern breakout signals that took place during that week. Global Equity Markets report covers single stocks from developed, emerging and frontier markets, ETF’s and global equity indices. The report starts with a review section that highlights the important chart developments on global equity benchmarks. This blog post features from the watchlist section BEST BUY CO INC listed on the New York Stock Exchange.
Best Buy Co., Inc. is a provider of technology products, services and solutions. The Company offers products and services to the customers visiting its stores, engaging with Geek Squad agents, or using its Websites or mobile applications. It has operations in the United States, Canada and Mexico. The stock is listed on the New York Stock Exchange. Price chart formed a 8 month-long rectangle with the horizontal boundary acting as strong resistance at 124.00 levels. The horizontal boundary was tested several times over the course of the chart pattern. A daily close above 127.70 levels will confirm the breakout from the 8 month-long rectangle with the possible chart pattern price target of 150.00 levels.
By becoming a Premium Member, you’ll be able to improve your knowledge of the principles of classical charting.
With this knowledge, you can merge them with your investing system. In fact, some investors use my analyses to modify their existing style to invest more efficiently and successfully.
You will receive:
For your convenience your membership auto renews each year.

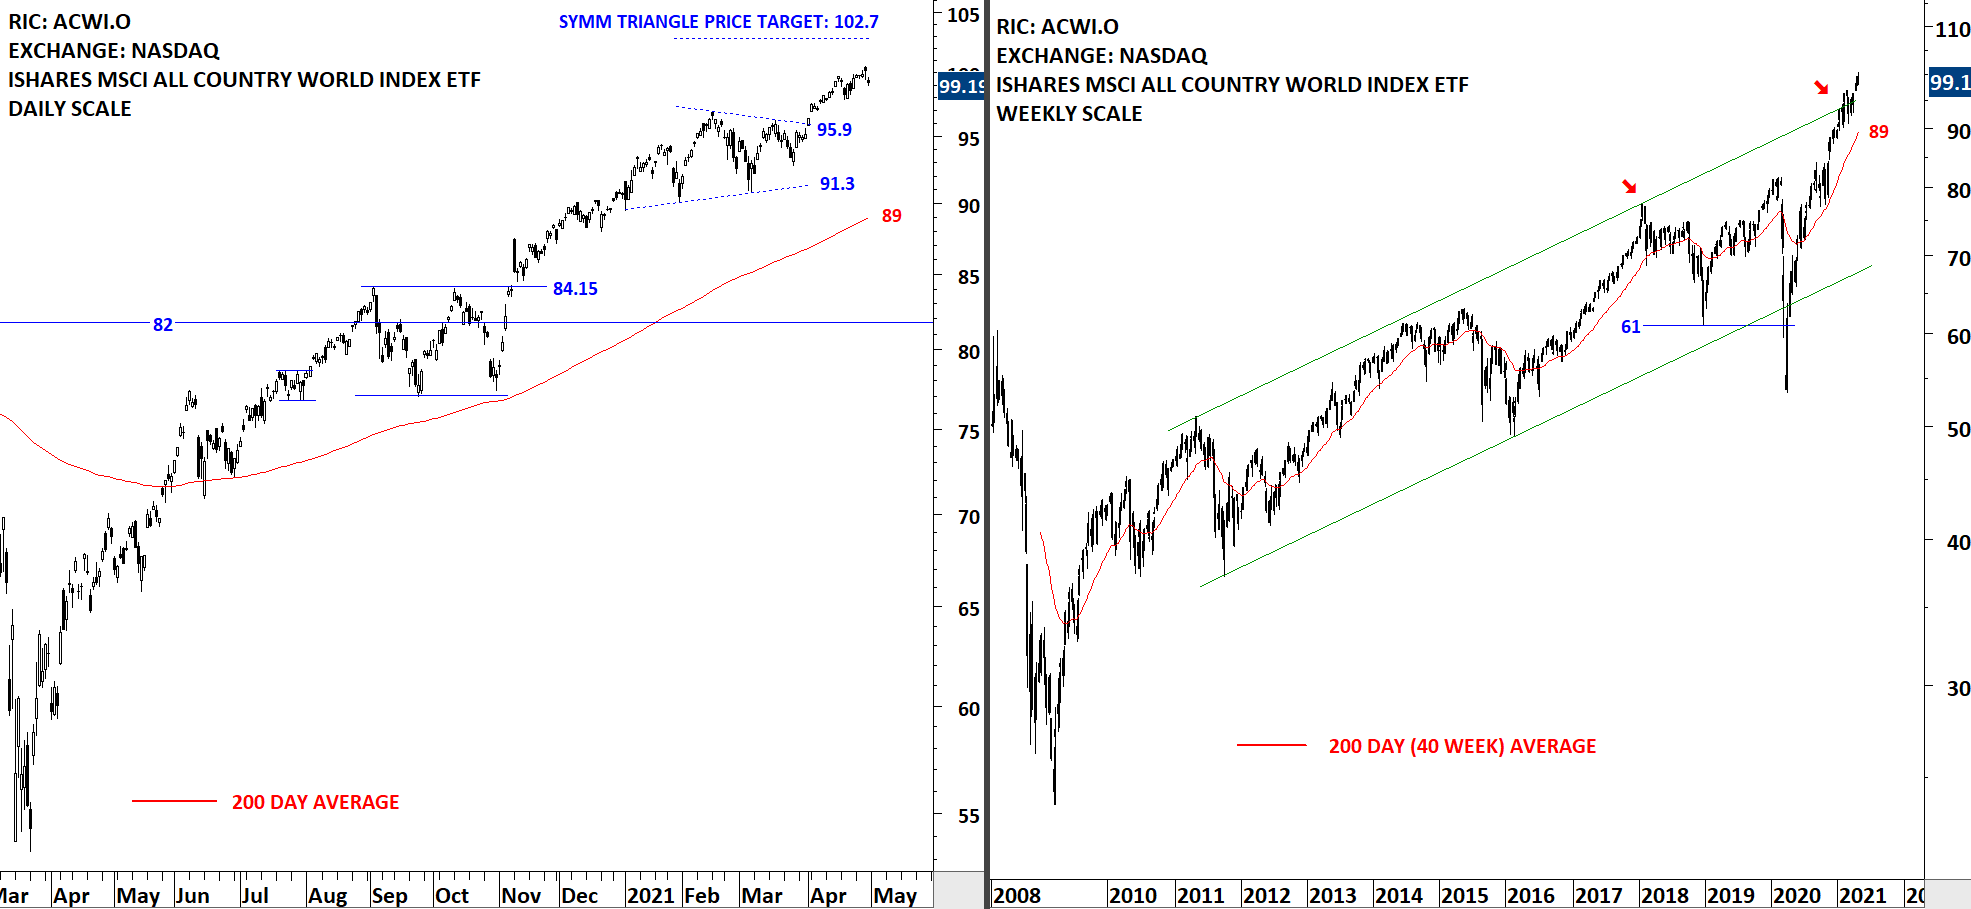
The benchmark for the Global equity markets performance, the iShares MSCI All Country World Index ETF (ACWI.O) is resuming its uptrend after completing the sideways consolidation, a symmetrical triangle. The upper boundary of a possible symmetrical triangle was breached at 95.9 levels. We can conclude that the uptrend is intact. Price objective stands at 102.7 levels. During any pullback 95.9 will act as support.
 Read More
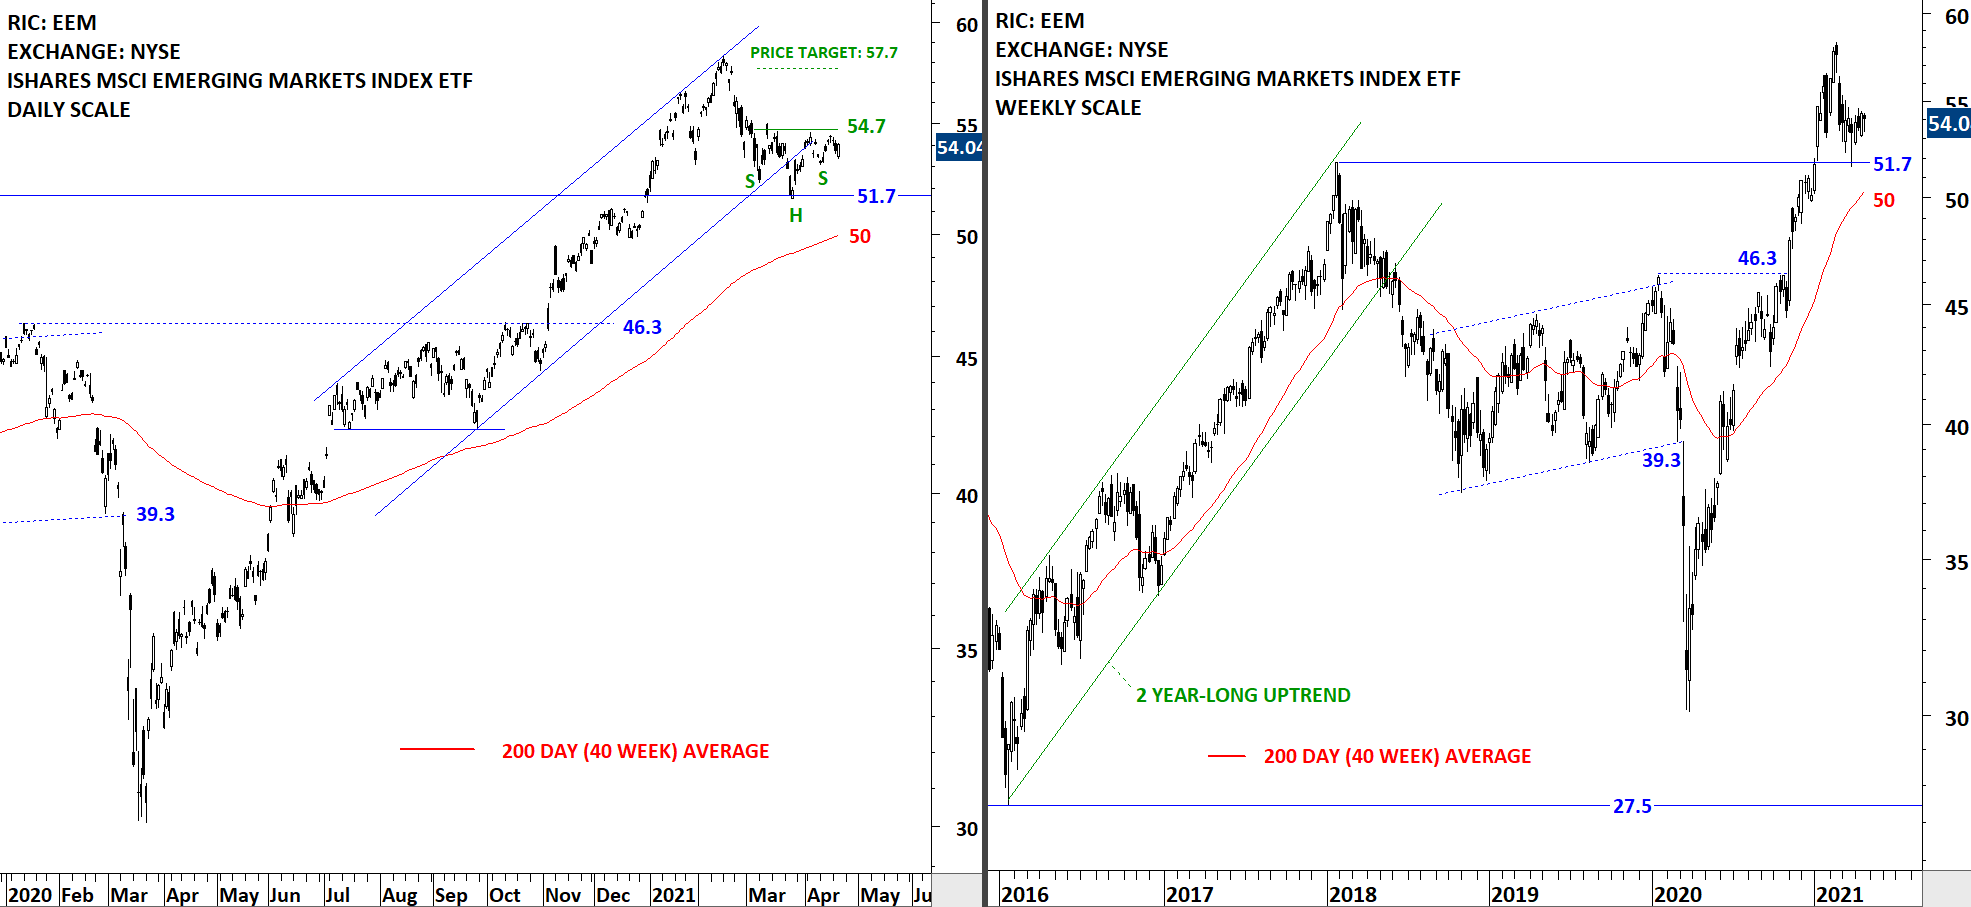
Every week Tech Charts Global Equity Markets report features some of the well-defined, mature classical chart patterns under a lengthy watchlist and the chart pattern breakout signals that took place during that week. Global Equity Markets report covers single stocks from developed, emerging and frontier markets, ETF’s and global equity indices. The report starts with a review section that highlights the important chart developments on global equity benchmarks. This blog post features from the review section IShares MSCI Emerging Markets ETF (EEM) listed on the New York Stock Exchange.
The benchmark for the Emerging Markets performance, the iShares MSCI Emerging Markets Index ETF (EEM) rebounded strongly from support at 51.7. The uptrend is intact with the ETF trading above its 200-day average. Support at 51.7 held and EEM might be forming a medium-term low. I’m monitoring the possibility of a minor H&S bottom reversal with the neckline standing at 54.7 levels. Breakout above 54.7 levels can target 57.7.
By becoming a Premium Member, you’ll be able to improve your knowledge of the principles of classical charting.
With this knowledge, you can merge them with your investing system. In fact, some investors use my analyses to modify their existing style to invest more efficiently and successfully.
You will receive:
For your convenience your membership auto renews each year.

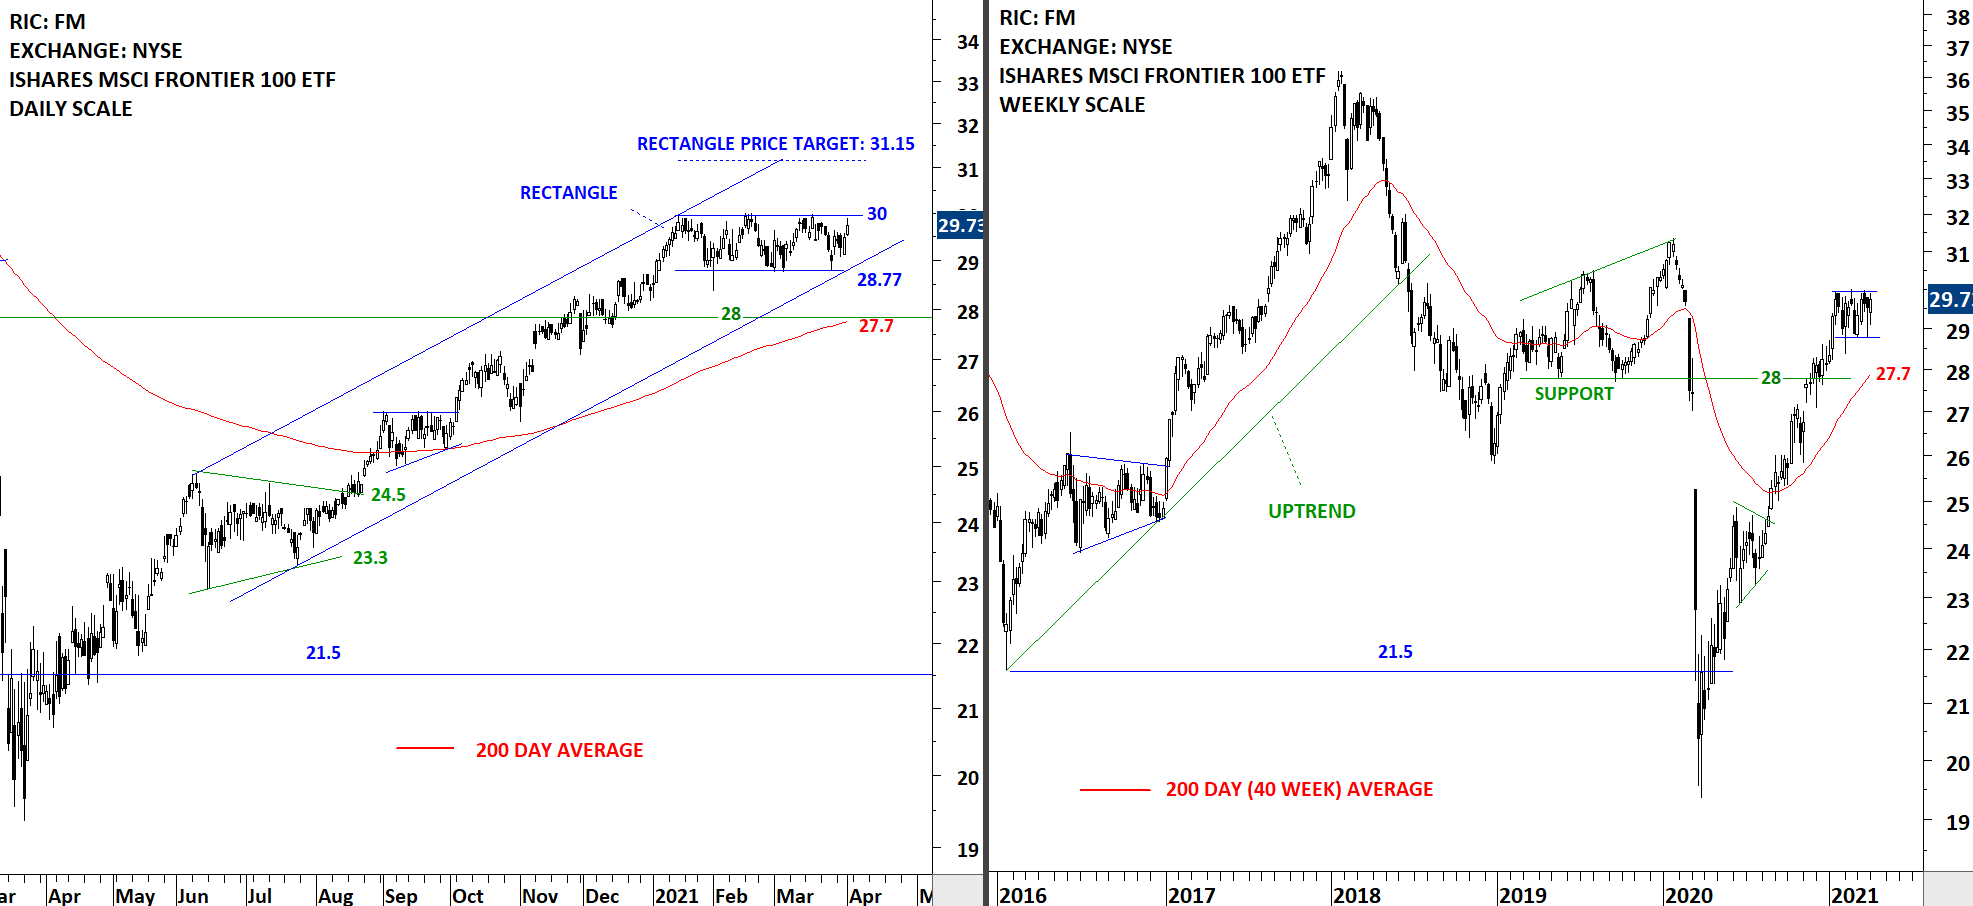
Every week Tech Charts Global Equity Markets report features some of the well-defined, mature classical chart patterns under a lengthy watchlist and the chart pattern breakout signals that took place during that week. Global Equity Markets report covers single stocks from developed, emerging and frontier markets, ETF’s and global equity indices. The report starts with a review section that highlights the important chart developments on global equity benchmarks. This blog post features from the review section IShares MSCI Frontier Markets ETF (FM) listed on the New York Stock Exchange.
Strength in Frontier market equities can be an indication of increasing risk appetite. When it is a risk on environment for equities, the spillover effect is usually from Developed to Emerging and Frontier market equities. Consistent uptrend in Frontier Market equities and the possibility of a fresh breakout can suggest continued positive trend for Global equity markets.
The benchmark for the Frontier equity markets performance, the iShares MSCI Frontier 100 ETF, is consolidating in a range between 28.77 and 30 levels. The well-defined consolidation range can act as a continuation chart pattern. Breakout above 30 levels can renew the strength for Frontier market equities. Several tests of pattern boundary can be followed by a reliable breakout. Possible chart pattern price target stands at 31.15 levels.
By becoming a Premium Member, you’ll be able to improve your knowledge of the principles of classical charting.
With this knowledge, you can merge them with your investing system. In fact, some investors use my analyses to modify their existing style to invest more efficiently and successfully.
You will receive:
For your convenience your membership auto renews each year.

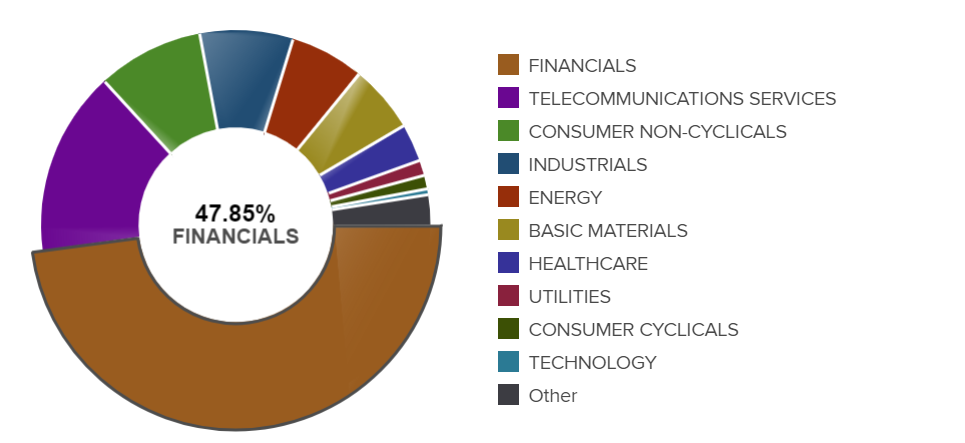
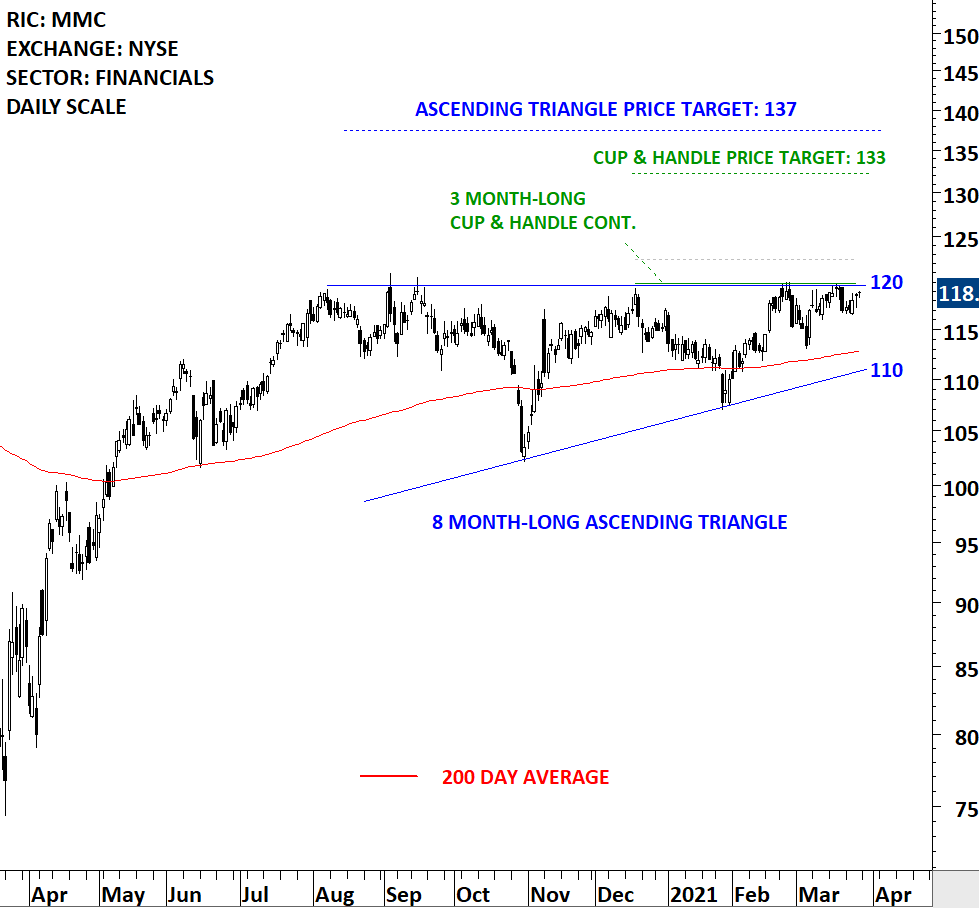
Every week Tech Charts Global Equity Markets report features some of the well-defined, mature classical chart patterns under a lengthy watchlist and the chart pattern breakout signals that took place during that week. Global Equity Markets report covers single stocks from developed, emerging and frontier markets, ETF’s and global equity indices. The report starts with a review section that highlights the important chart developments on global equity benchmarks. This blog post features from the watchlist section Marsh & McLennan Companies, Inc.
Marsh & McLennan Companies, Inc. is a professional services firm offering clients advice and solutions in risk, strategy and people. The Company is the parent company of various risk advisors and specialty consultants, including Marsh, the insurance broker; Guy Carpenter, the risk and reinsurance specialist; Mercer, the provider of human resource and investment related financial advice and services, and Oliver Wyman Group, the management and economic consultancy. The stock is listed on the New York Stock Exchange. Price chart formed a 3 month-long cup & handle continuation with the horizontal boundary acting as strong resistance at 120.00 levels. The horizontal boundary was tested several times over the course of the chart pattern. A daily close above 122.50 levels will confirm the breakout from the 3 month-long cup & handle continuation with the possible chart pattern price target of 133.00 levels. The cup & handle continuation is part of a larger scale ascending triangle that can complete at the same price level. (Data as of 26/03/2021, EST 9:30)
By becoming a Premium Member, you’ll be able to improve your knowledge of the principles of classical charting.
With this knowledge, you can merge them with your investing system. In fact, some investors use my analyses to modify their existing style to invest more efficiently and successfully.
You will receive:
For your convenience your membership auto renews each year.
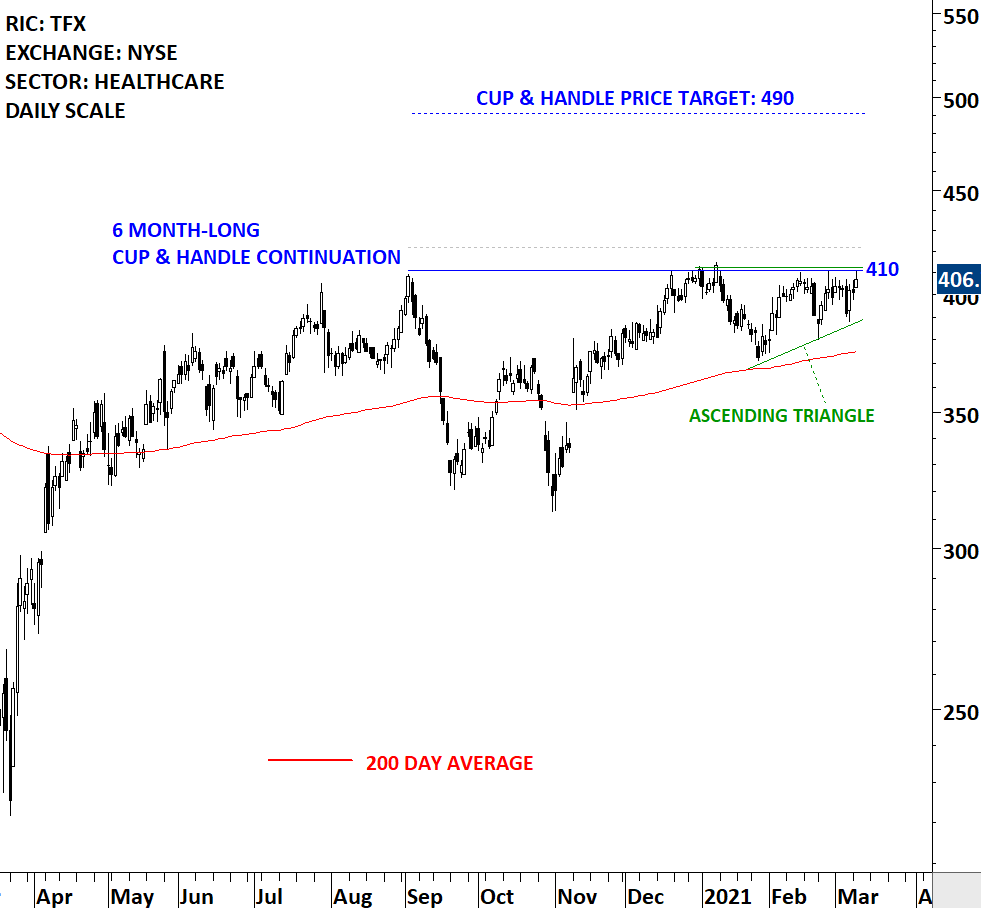
Every week Tech Charts Global Equity Markets report features some of the well-defined, mature classical chart patterns under a lengthy watchlist and the chart pattern breakout signals that took place during that week. Global Equity Markets report covers single stocks from developed, emerging and frontier markets, ETF’s and global equity indices. The report starts with a review section that highlights the important chart developments on global equity benchmarks. This blog post features from the watchlist section Teleflex Incorporated.
Teleflex Incorporated is a provider of medical technology products. The Company designs, develops, manufactures and supplies single-use medical devices used by hospitals and healthcare providers for diagnostic and therapeutic procedures in critical care and surgical applications. The stock is listed on the New York Stock Exchange. Price chart formed a 6 month-long cup & handle continuation with the horizontal boundary acting as strong resistance at 410.00 levels. The horizontal boundary was tested several times over the course of the chart pattern. A daily close above 422.00 levels will confirm the breakout from the 6 month-long cup & handle continuation with the possible chart pattern price target of 490.00 levels. The handle part of the cup & handle continuation can be identified as a possible ascending triangle that can act as a bullish continuation chart pattern. Breakout can push the stock to all-time highs. (Data as of Mar 9, 2021)
By becoming a Premium Member, you’ll be able to improve your knowledge of the principles of classical charting.
With this knowledge, you can merge them with your investing system. In fact, some investors use my analyses to modify their existing style to invest more efficiently and successfully.
You will receive:
For your convenience your membership auto renews each year.


