“Demystifying the world of Classical Charting”
– AKSEL KIBAR
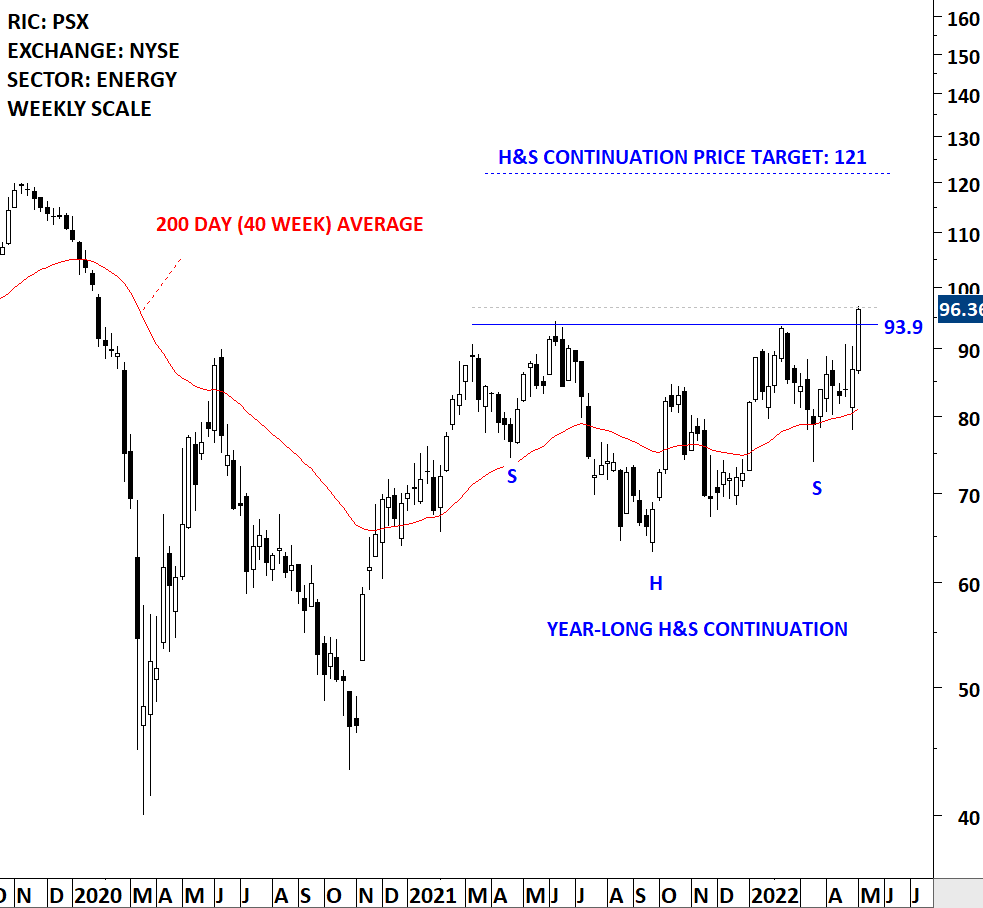
Every week Tech Charts Global Equity Markets report features some of the well-defined, mature classical chart patterns under a lengthy watchlist and the chart pattern breakout signals that took place during that week. Global Equity Markets report covers single stocks from developed, emerging and frontier markets, ETF’s, select commodities, cryptocurrencies and global equity indices. Below chart is from the watchlist section of the weekly report. It is featuring the head and shoulder continuation chart pattern on Phillips 66 listed on the New York Stock Exchange.
Phillips 66 is an energy manufacturing and logistics company with midstream, chemicals, refining, and marketing and specialties businesses. The stock is listed on the New York Stock Exchange. Price chart formed a year-long head and shoulder continuation with the horizontal boundary acting as strong resistance at 93.90 levels. The horizontal boundary was tested several times over the course of the chart pattern. A daily close above 96.70 levels will confirm the breakout from the year-long head and shoulder continuation with the possible chart pattern price target of 121.00 levels. Friday’s price action was borderline breakout. I will monitor this name for another day of strength to confirm the breakout.

By becoming a Premium Member, you’ll be able to improve your knowledge of the principles of classical charting.
With this knowledge, you can merge them with your investing system. In fact, some investors use my analyses to modify their existing style to invest more efficiently and successfully.
You will receive:
For your convenience your membership auto renews each year.
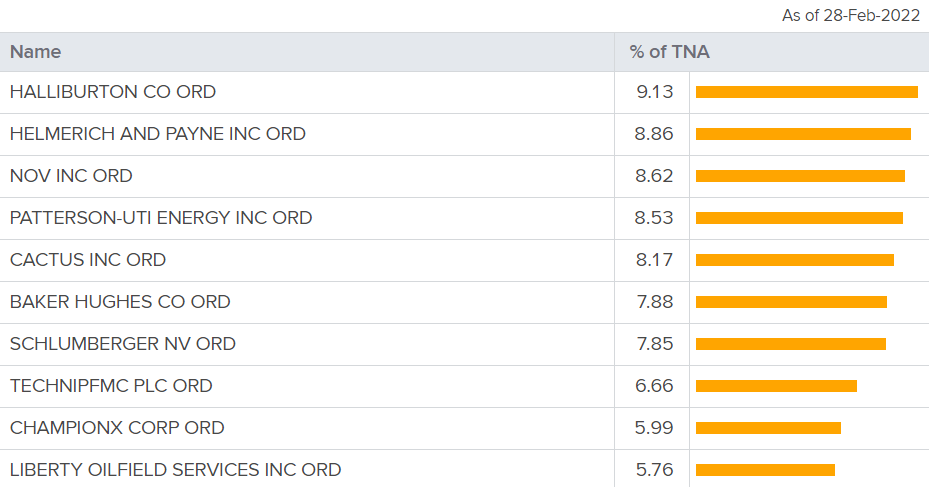
Every week Tech Charts Global Equity Markets report features some of the well-defined, mature classical chart patterns under a lengthy watchlist and the chart pattern breakout signals that took place during that week. Global Equity Markets report covers single stocks from developed, emerging and frontier markets, ETF’s, select commodities, cryptocurrencies and global equity indices. Below chart is from the review section of the weekly report. It is featuring the text-book rectangle on INVESCO DYNAMIC OIL & GAS SERVICES ETF listed on the New York Stock Exchange.
Invesco Dynamic Oil & Gas Services ETF formed an 8 month-long rectangle with the lower boundary acting as support at 2.98 and the upper boundary as resistance at 4.27 levels. The ETF cleared the resistance at 4.27 levels and can target 5.5. levels. During recent pullback previous resistance acted as support (4.27). Price action looks like breakout/pullback and continuation. The chart pattern can be a short-term pennant that can act as a bullish continuation.

By becoming a Premium Member, you’ll be able to improve your knowledge of the principles of classical charting.
With this knowledge, you can merge them with your investing system. In fact, some investors use my analyses to modify their existing style to invest more efficiently and successfully.
You will receive:
For your convenience your membership auto renews each year.
Every week Tech Charts Global Equity Markets report features some of the well-defined, mature classical chart patterns under a lengthy watchlist and the chart pattern breakout signals that took place during that week. Global Equity Markets report covers single stocks from developed, emerging and frontier markets, ETF’s, select commodities, cryptocurrencies and global equity indices. Below chart is from the watchlist section of the weekly report. It is featuring the text-book rectangle on JB Hi-Fi Ltd listed on Australia Stock Exchange.
JB Hi-Fi Ltd is an Australia-based company engaged in the retailing of home consumer products. The stock is listed on the Australia Stock Exchange. Price chart formed an 18 month-long rectangle with the horizontal boundary acting as strong resistance at 53.90 levels. The horizontal boundary was tested several times over the course of the chart pattern. A daily close above 55.50 levels will confirm the breakout from the 18 month-long rectangle with the possible chart pattern price target of 64.00 levels. Until there is a breakout, the stock offers trading opportunity between boundaries.

By becoming a Premium Member, you’ll be able to improve your knowledge of the principles of classical charting.
With this knowledge, you can merge them with your investing system. In fact, some investors use my analyses to modify their existing style to invest more efficiently and successfully.
You will receive:
For your convenience your membership auto renews each year.
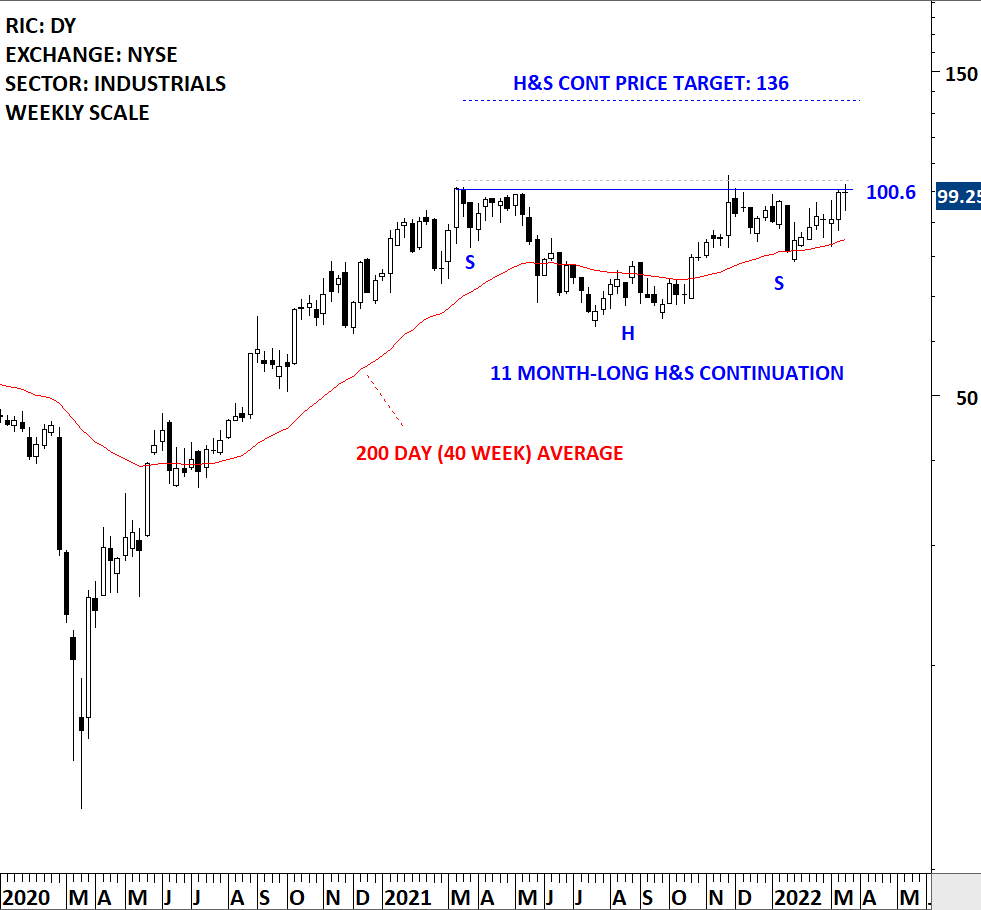
Every week Tech Charts Global Equity Markets report features some of the well-defined, mature classical chart patterns under a lengthy watchlist and the chart pattern breakout signals that took place during that week. Global Equity Markets report covers single stocks from developed, emerging and frontier markets, ETF’s, select commodities, cryptocurrencies and global equity indices. Below chart is from the watchlist section of the weekly report. It is featuring the text-book head and shoulder continuation on Dycom Industries, Inc. listed on NYSE.
Dycom Industries, Inc. is a provider of specialty contracting services throughout the United States. The Company includes engineering services, and construction, maintenance and installation services. It provides engineering services to telecommunications providers, including the planning and design of aerial, underground, buried fiber optic, copper and coaxial cable systems for its consumers. The stock is listed on the New York Stock Exchange. Price chart formed an 11 month-long head and shoulder continuation with the horizontal boundary acting as strong resistance at 100.60 levels. The horizontal boundary was tested several times over the course of the chart pattern. A daily close above 103.60 levels will confirm the breakout from the 11 month-long head and shoulder continuation with the possible chart pattern price target of 136.00 levels. (Learn more: Video Tutorial)

By becoming a Premium Member, you’ll be able to improve your knowledge of the principles of classical charting.
With this knowledge, you can merge them with your investing system. In fact, some investors use my analyses to modify their existing style to invest more efficiently and successfully.
You will receive:
For your convenience your membership auto renews each year.
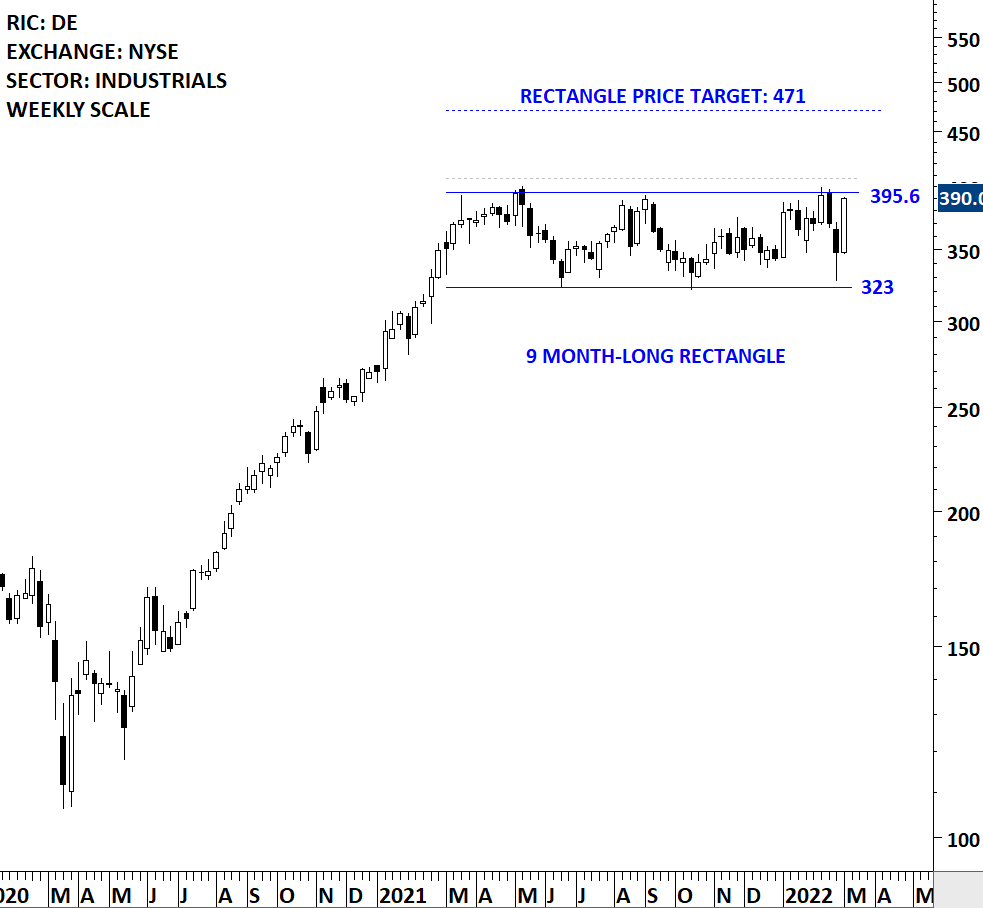
Every week Tech Charts Global Equity Markets report features some of the well-defined, mature classical chart patterns under a lengthy watchlist and the chart pattern breakout signals that took place during that week. Global Equity Markets report covers single stocks from developed, emerging and frontier markets, ETF’s, select commodities, cryptocurrencies and global equity indices. Below chart is from the watchlist section of the weekly report. It is featuring the text-book rectangle on Deere & Company listed on NYSE.
Deere & Company is engaged in equipment operations. The Company is engaged in providing financial services. The Company operates through three business segments: agriculture and turf, construction and forestry, and financial services. The stock is listed on the New York Stock Exchange. Price chart formed a 9 month-long rectangle with the horizontal boundary acting as strong resistance at 395.60 levels. The horizontal boundary was tested several times over the course of the chart pattern. A daily close above 407.50 levels will confirm the breakout from the 9 month-long rectangle with the possible chart pattern price target of 471.00 levels.

By becoming a Premium Member, you’ll be able to improve your knowledge of the principles of classical charting.
With this knowledge, you can merge them with your investing system. In fact, some investors use my analyses to modify their existing style to invest more efficiently and successfully.
You will receive:
For your convenience your membership auto renews each year.
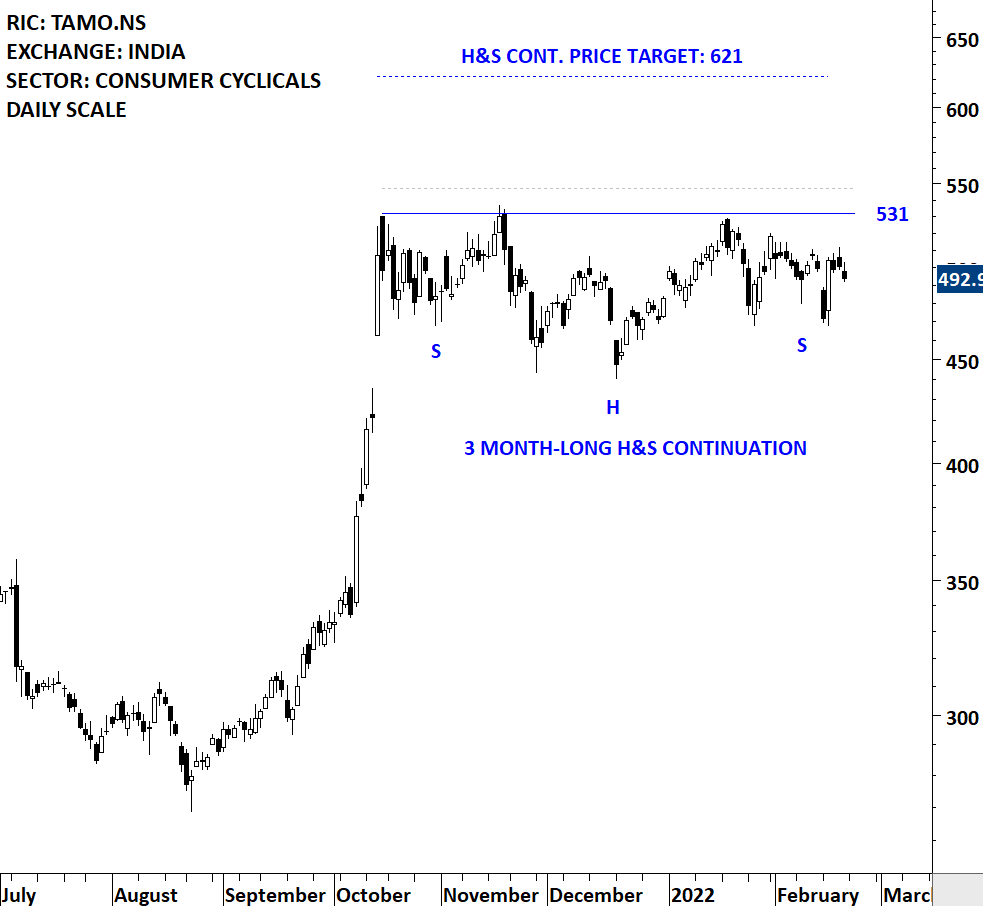
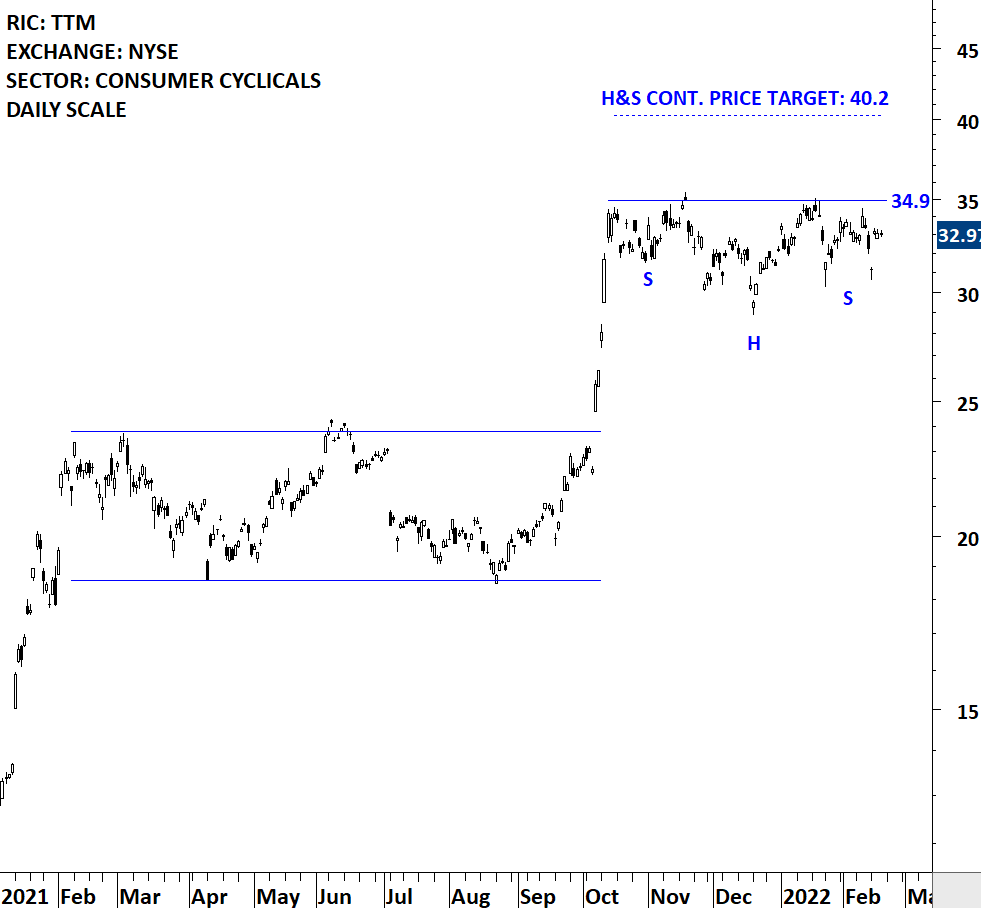
Every week Tech Charts Global Equity Markets report features some of the well-defined, mature classical chart patterns under a lengthy watchlist and the chart pattern breakout signals that took place during that week. Global Equity Markets report covers single stocks from developed, emerging and frontier markets, ETF’s, select commodities, cryptocurrencies and global equity indices. Below chart is from the watchlist section of the weekly report. It is featuring the text-book H&S continuation on Tata Motors listed on National Stock Exchange of India as well as the ADR that is listed on NYSE. Both charts have similar setups.
Tata Motors Limited is an automobile company. The Company is engaged in manufacture of motor vehicles. The Company’s segments include automotive operations and all other operations. The stock is listed on the National Stock Exchange. Price chart formed a 3 month-long head and shoulder continuation with the horizontal boundary acting as strong resistance at 531.00 levels. The horizontal boundary was tested several times over the course of the chart pattern. A daily close above 547.00 levels will confirm the breakout from the 3 month-long consolidation with the possible chart pattern price target of 621.00 levels. Below I added the ADR price chart that is listed on the NYSE.

By becoming a Premium Member, you’ll be able to improve your knowledge of the principles of classical charting.
With this knowledge, you can merge them with your investing system. In fact, some investors use my analyses to modify their existing style to invest more efficiently and successfully.
You will receive:
For your convenience your membership auto renews each year.
Every week Tech Charts Global Equity Markets report features some of the well-defined, mature classical chart patterns under a lengthy watchlist and the chart pattern breakout signals that took place during that week. Global Equity Markets report covers single stocks from developed, emerging and frontier markets, ETF’s, select commodities, cryptocurrencies and global equity indices. Below chart is from the review section of the weekly report. It is featuring the text-book H&S top reversal on Netherlands AEX Index.
As Global equities came under pressure a text-book H&S top reversal can be identified on Netherlands AEX Index. 5 month-long H&S top has a neckline at 754 levels. The neckline is also overlapping with the 200-day average. I call these inflection points where a chart pattern boundary overlaps with a long-term average (200-day). They are high conviction setups for me. A breakdown of the chart pattern horizontal boundary will also push the price below the long-term average, confirming the downtrend. H&S top has a price target of 694 levels. It is important to note that there has been several cases where H&S top reversals failed. Those failures can offer tradable long opportunities. Below video explains how to take advantage of a H&S top failure.

By becoming a Premium Member, you’ll be able to improve your knowledge of the principles of classical charting.
With this knowledge, you can merge them with your investing system. In fact, some investors use my analyses to modify their existing style to invest more efficiently and successfully.
You will receive:
For your convenience your membership auto renews each year.
Every week Tech Charts Global Equity Markets report features some of the well-defined, mature classical chart patterns under a lengthy watchlist and the chart pattern breakout signals that took place during that week. Global Equity Markets report covers single stocks from developed, emerging and frontier markets, ETF’s, select commodities, cryptocurrencies and global equity indices.
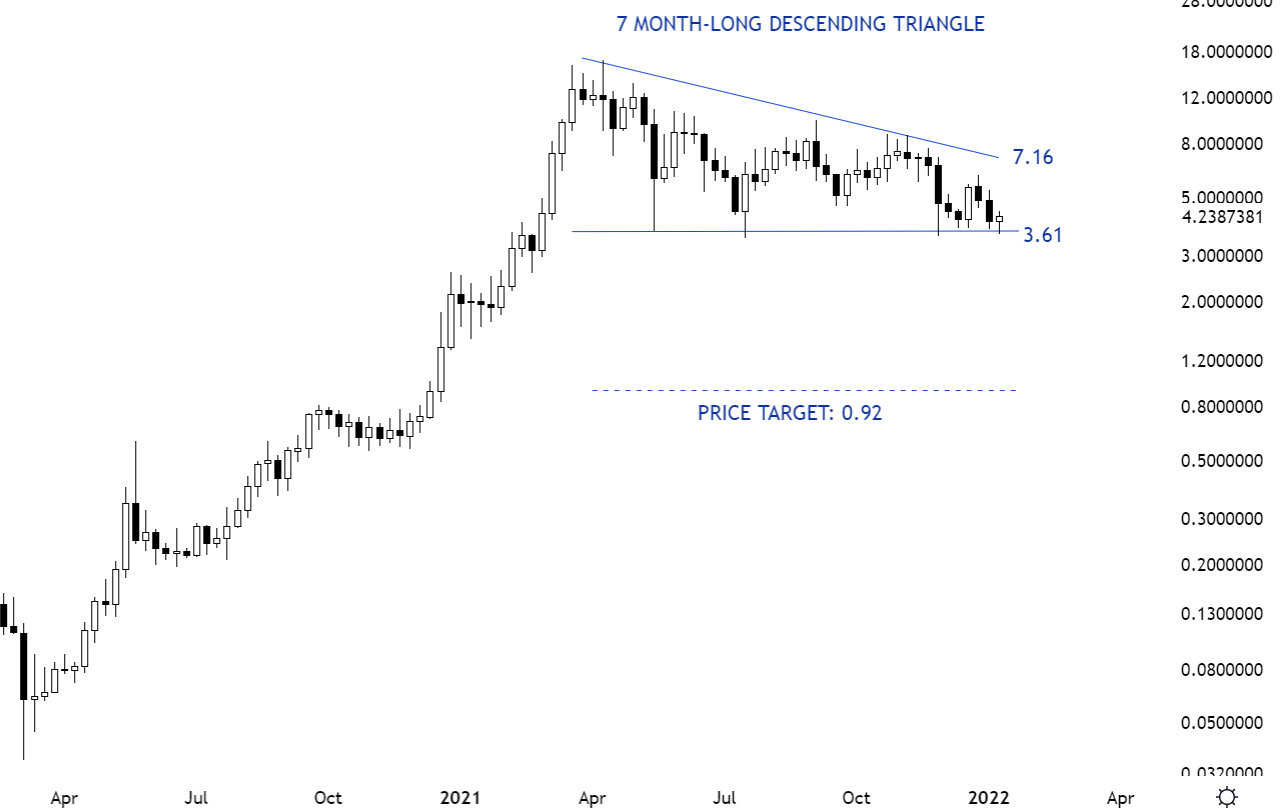
Tech Charts membership started including a new addition to our research offering, the special cryptocurrency report where I continue to find classical chart pattern opportunities on different cryptocurrency pairs. Below is a chart on THETAUSD from the latest special cryptocurrency report.
Descending triangle is a bearish chart pattern. Its downward sloping upper boundary gives the pattern the bearish bias. It shows sellers impatience to sell at lower levels every time price rebounds from the horizontal support. Breakdown below the horizontal support after several tests can complete the chart pattern.
THETAUSD is another pair that has possibly formed a descending triangle chart pattern. The lower boundary is well defined with several tests. The upper boundary is clearly downward sloping showing lower highs. Breakdown below 3.61 levels can target 0.92 levels. This is another pair I will play the short side if cryptocurrencies in general come under selling pressure.

By becoming a Premium Member, you’ll be able to improve your knowledge of the principles of classical charting.
With this knowledge, you can merge them with your investing system. In fact, some investors use my analyses to modify their existing style to invest more efficiently and successfully.
You will receive:
For your convenience your membership auto renews each year.
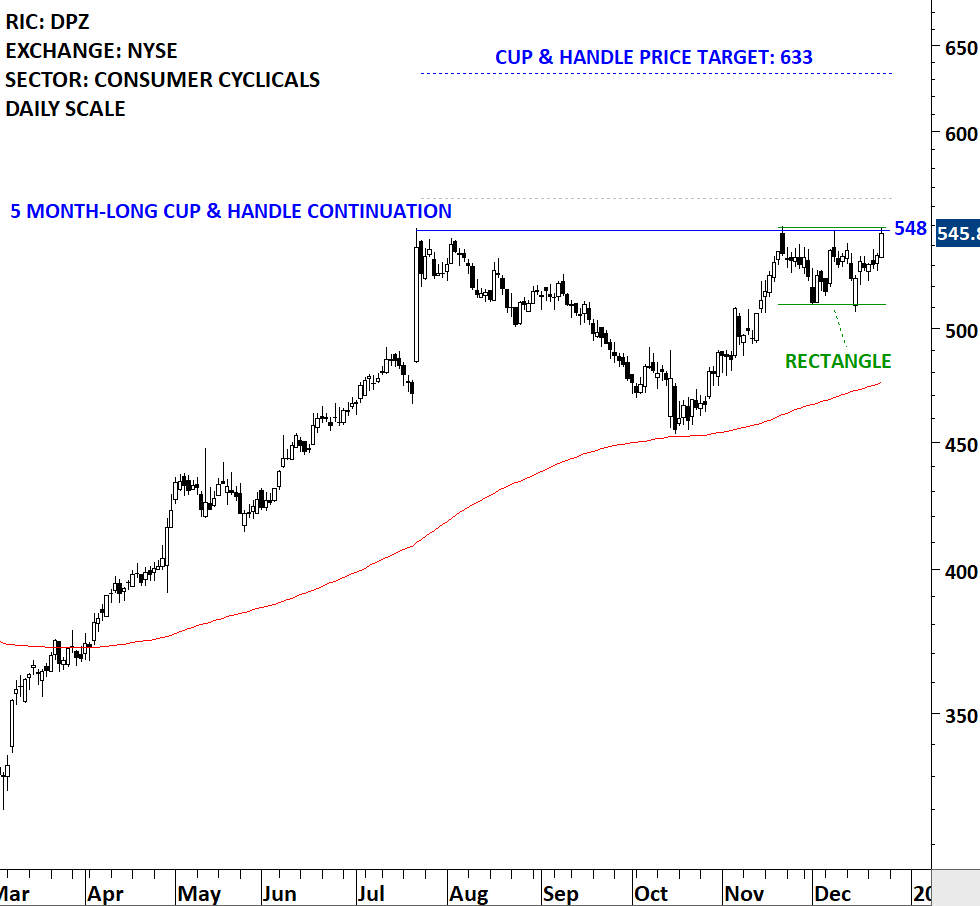
Every week Tech Charts Global Equity Markets report features some of the well-defined, mature classical chart patterns under a lengthy watchlist and the chart pattern breakout signals that took place during that week. Global Equity Markets report covers single stocks from developed, emerging and frontier markets, ETF’s, select commodities, cryptocurrencies and global equity indices. Below chart is from the watchlist section of the weekly report. It is featuring Domino’s Pizza, Inc. listed on the New York Stock Exchange.
Domino’s Pizza, Inc. is a pizza restaurant chain company. As of January 1, 2017, the Company operated in over 13,800 locations in over 85 markets around the world. The stock is listed on the New York Stock Exchange. Price chart formed a 5 month-long cup & handle continuation with the horizontal boundary acting as strong resistance at 548.00 levels. The horizontal boundary was tested several times over the course of the chart pattern. A daily close above 564.00 levels will confirm the breakout from the 5 month-long cup & handle continuation with the possible chart pattern price target of 633.00 levels. The handle can be identified as a rectangle.

By becoming a Premium Member, you’ll be able to improve your knowledge of the principles of classical charting.
With this knowledge, you can merge them with your investing system. In fact, some investors use my analyses to modify their existing style to invest more efficiently and successfully.
You will receive:
For your convenience your membership auto renews each year.
Every week Tech Charts Global Equity Markets report features some of the well-defined, mature classical chart patterns under a lengthy watchlist and the chart pattern breakout signals that took place during that week. Global Equity Markets report covers single stocks from developed, emerging and frontier markets, ETF’s, select commodities, cryptocurrencies and global equity indices. Below chart is from the watchlist section of the weekly report. It is featuring Berkshire Hathaway Inc. listed on the New York Stock Exchange.
Berkshire Hathaway Inc. is a holding company owning subsidiaries engaged in various business activities, including insurance and reinsurance, utilities and energy, freight rail transportation, manufacturing and retailing. The stock is listed on the New York Stock Exchange. Price chart formed a 5 month-long rectangle with the horizontal boundary acting as strong resistance at 293.00 levels. The horizontal boundary was tested several times over the course of the chart pattern. A daily close above 296.00 levels will confirm the breakout from the 5 month-long rectangle with the possible chart pattern price target of 314.00 levels. Until there is a breakout or a breakdown from the lengthy sideways consolidation, the stock offers trading opportunity between boundaries.

By becoming a Premium Member, you’ll be able to improve your knowledge of the principles of classical charting.
With this knowledge, you can merge them with your investing system. In fact, some investors use my analyses to modify their existing style to invest more efficiently and successfully.
You will receive:
For your convenience your membership auto renews each year.

