“Demystifying the world of Classical Charting”
– AKSEL KIBAR

Every week Tech Charts Global Equity Markets report features some of the well-defined, mature classical chart patterns under a lengthy watchlist and the chart pattern breakout signals that took place during that week. Global Equity Markets report covers single stocks from developed, emerging and frontier markets, ETF’s and global equity indices. The report starts with a review section that highlights the important chart developments on global equity benchmarks. This blog post features from the watchlist section a symmetrical triangle chart pattern opportunity, listed on the Nasdaq Stock Exchange.
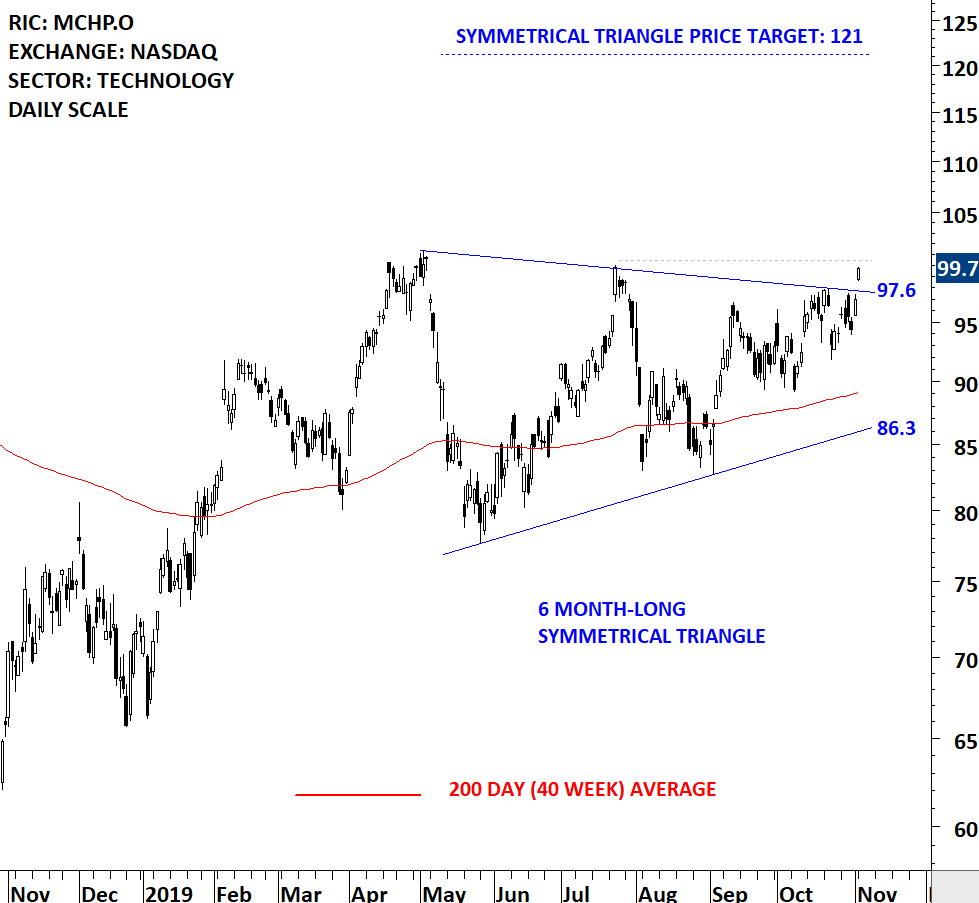
Microchip Technology Incorporated is engaged in developing, manufacturing and selling specialized semiconductor products used by its customers for a range of embedded control applications. The stock is listed on the Nasdaq Stock Exchange. Price chart formed a 6 month-long symmetrical triangle with the upper boundary acting as strong resistance at 97.60 levels. The upper boundary was tested several times over the course of the chart pattern. A daily close above 100.50 levels will confirm the breakout from the 6 month-long symmetrical triangle with the possible chart pattern price target of 121.0 levels. (Data as of November 4, 2019)

By becoming a Premium Member, you’ll be able to improve your knowledge of the principles of classical charting.
With this knowledge, you can merge them with your investing system. In fact, some investors use my analyses to modify their existing style to invest more efficiently and successfully.
You will receive:
For your convenience your membership auto renews each year.

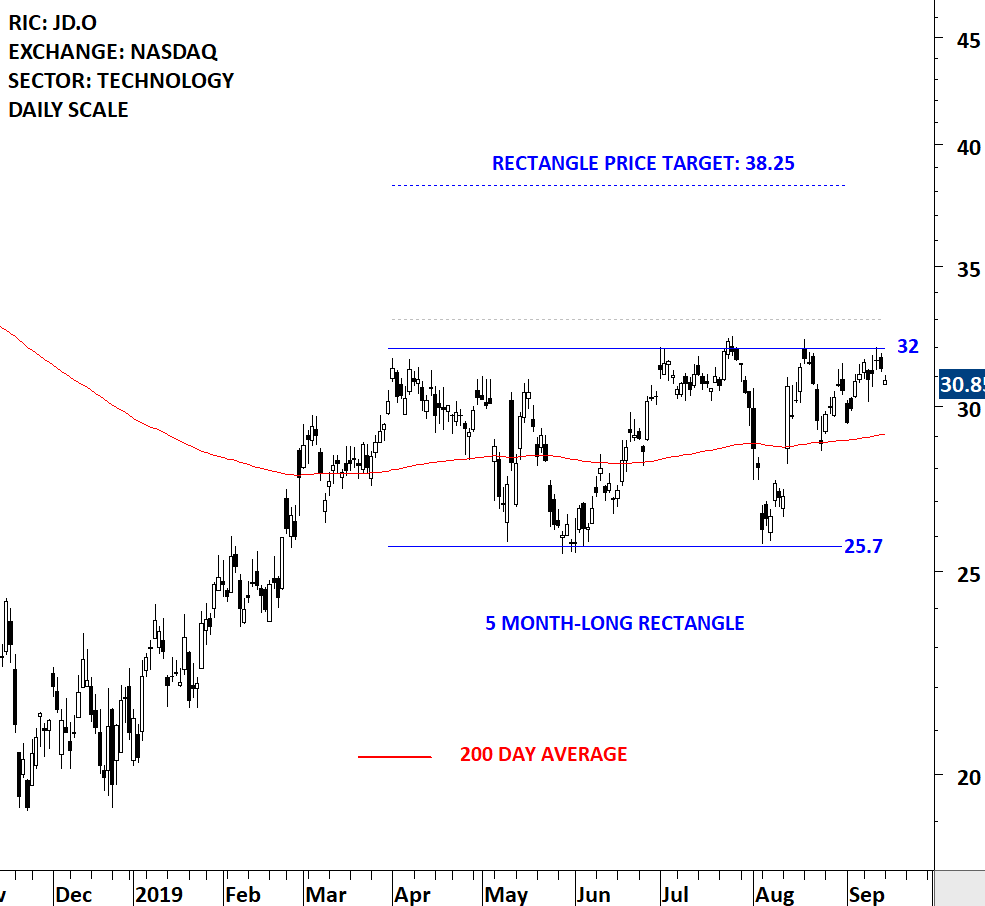
Every week Tech Charts Global Equity Markets report features some of the well-defined, mature classical chart patterns under a lengthy watchlist and the chart pattern breakout signals that took place during that week. Global Equity Markets report covers single stocks from developed, emerging and frontier markets, ETF’s and global equity indices. The report starts with a review section that highlights the important chart developments on global equity benchmarks. This blog post features from the watchlist section a rectangle chart pattern opportunity, listed on the Nasdaq Stock Exchange.
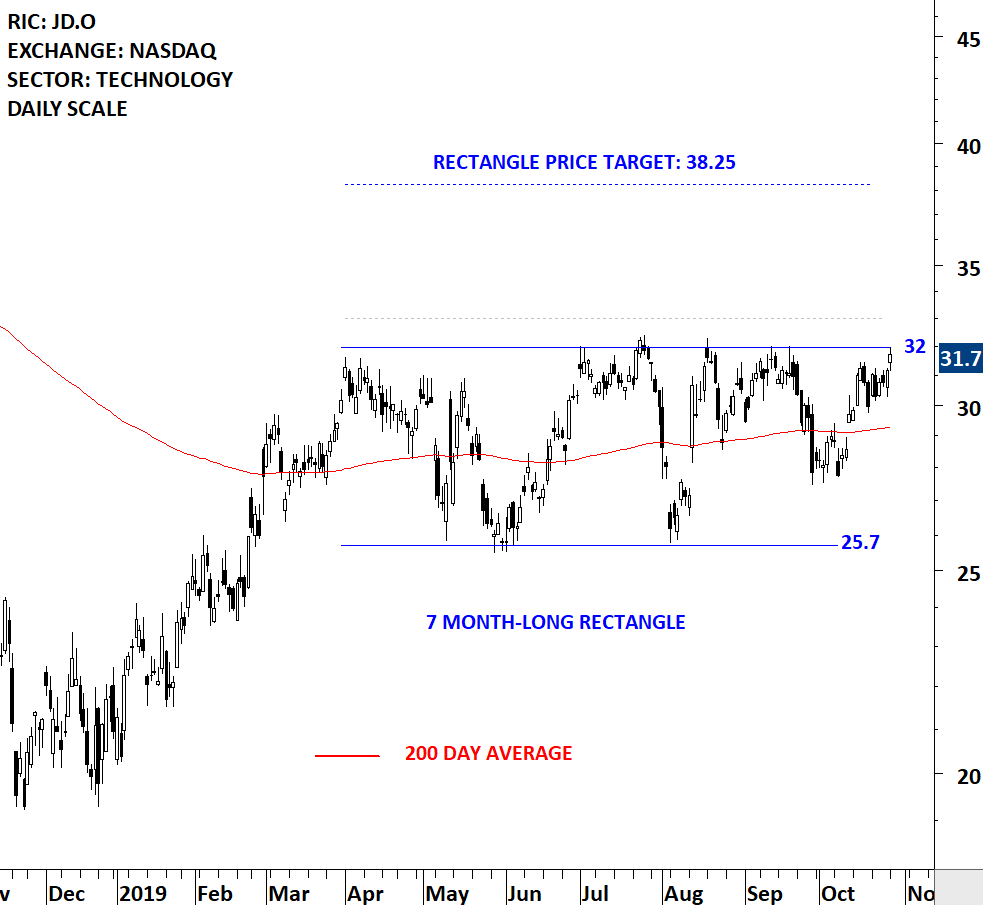
JD.com, Inc. is an online direct sales company. The Company engages in the sale of electronics and home appliance products and general merchandise products (including audio, video products and books) sourced from manufacturers, distributors and publishers in China on the Internet through its Website, www.jd.com. The stock is listed on the Nasdaq Stock Exchange. Price chart formed a 7 month-long rectangle with the horizontal boundary acting as strong resistance at 32.00 levels. The horizontal boundary was tested several times over the course of the chart pattern. A daily close above 33.00 levels will confirm the breakout from the 7 month-long rectangle with the possible chart pattern price target of 38.25 levels. (Data as of October 28, 2019)
By becoming a Premium Member, you’ll be able to improve your knowledge of the principles of classical charting.
With this knowledge, you can merge them with your investing system. In fact, some investors use my analyses to modify their existing style to invest more efficiently and successfully.
You will receive:
For your convenience your membership auto renews each year.

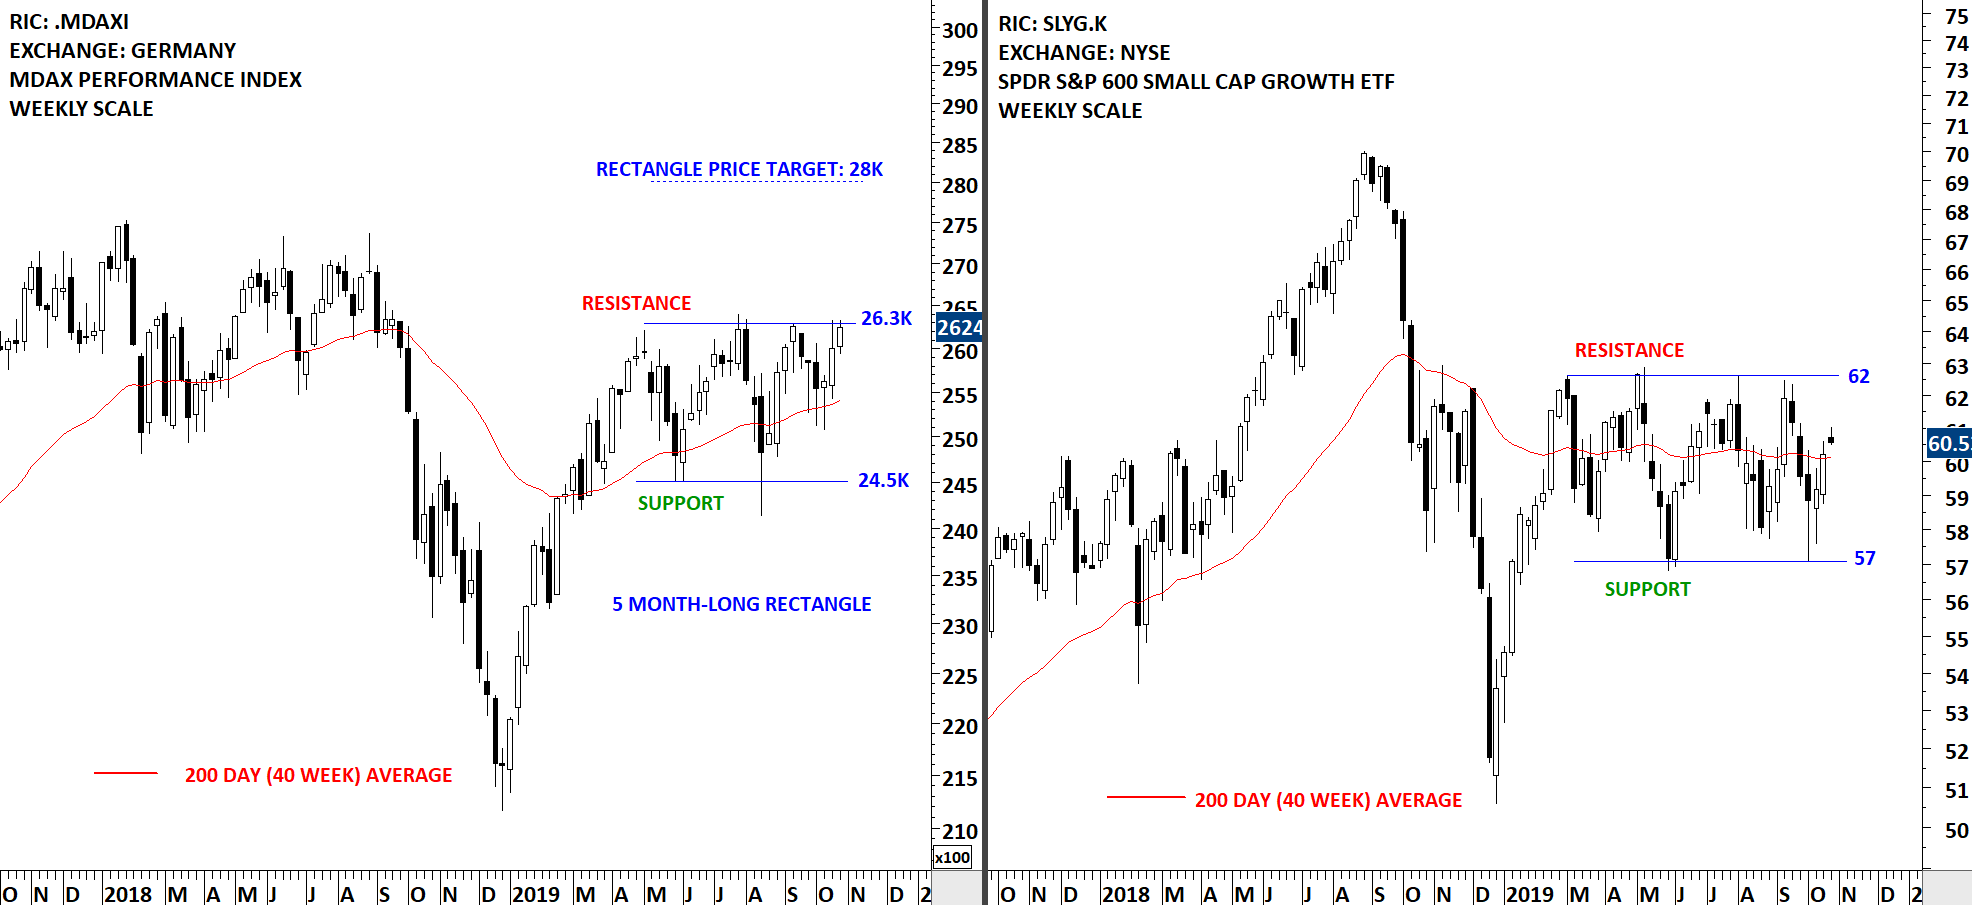
Every week Tech Charts Global Equity Markets report features some of the well-defined, mature classical chart patterns under a lengthy watchlist and the chart pattern breakout signals that took place during that week. Global Equity Markets report covers single stocks from developed, emerging and frontier markets, ETF’s and global equity indices. The report starts with a review section that highlights the important chart developments on global equity benchmarks. This blog post features from the review section two rectangle consolidations on Germany’s MDAX Index and S&P SPDR 600 Small Cap Growth ETF. Both chart patterns can act as bullish continuations.
Over the past few weeks I featured the tight consolidation that was taking place on Ishares MSCI Belgium ETF (EWK). The breakout took place with a strong weekly candlestick. There are several Global benchmarks that are stuck in a range and looking for direction. In this update I added the Germany’s mid-cap equities benchmark MDAX as well as S&P 600 Small Cap Growth ETF.
Both charts show the past few months well-defined consolidations. MDAX is now closer to the upper boundary of its consolidation. There has been several tests of the chart pattern boundaries. I monitor 26.3K resistance for a possible breakout from the 6 month-long rectangle chart pattern. (Data as of October 22, 2019, 4:35 pm). It is important to note that price charts are shown on weekly scale and the last candlestick only contains two days of trading data.
By becoming a Premium Member, you’ll be able to improve your knowledge of the principles of classical charting.
With this knowledge, you can merge them with your investing system. In fact, some investors use my analyses to modify their existing style to invest more efficiently and successfully.
You will receive:
For your convenience your membership auto renews each year.
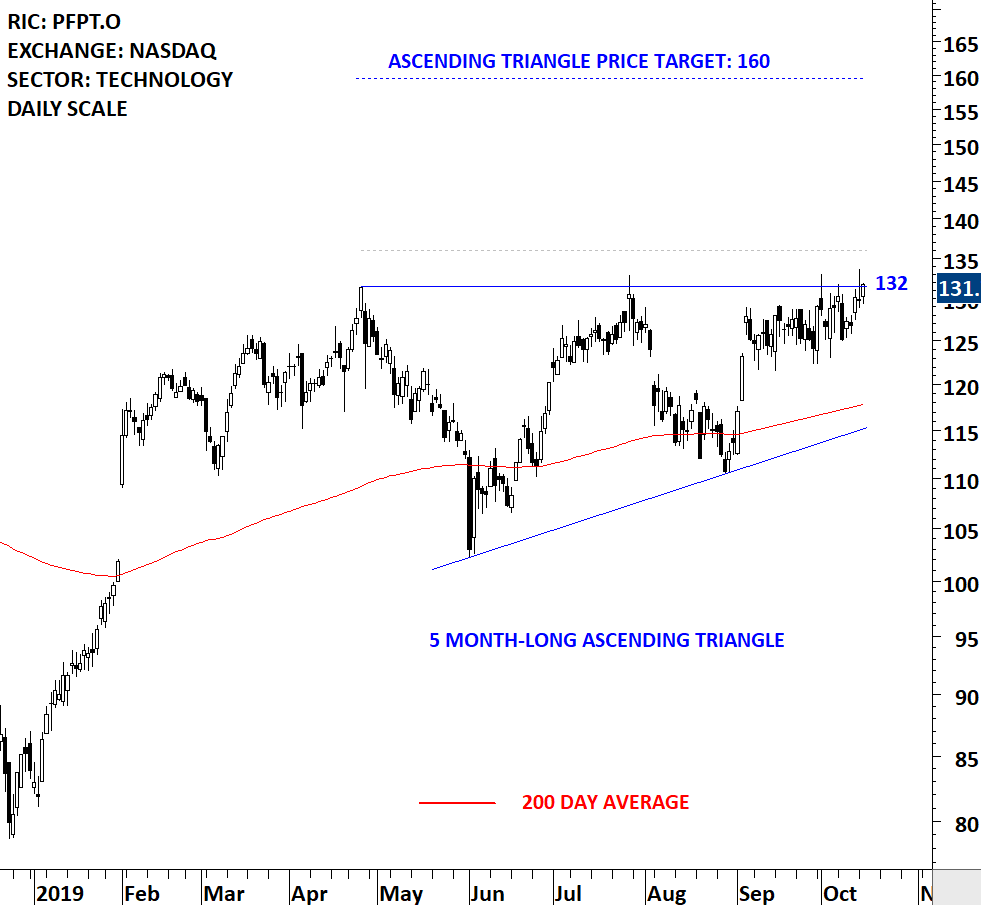
Every week Tech Charts Global Equity Markets report features some of the well-defined, mature classical chart patterns under a lengthy watchlist and the chart pattern breakout signals that took place during that week. Global Equity Markets report covers single stocks from developed, emerging and frontier markets, ETF’s and global equity indices. The report starts with a review section that highlights the important chart developments on global equity benchmarks. This blog post features from the watchlist section a bullish ascending triangle chart pattern opportunity, listed on the Nasdaq Stock Exchange.
Proofpoint, Inc. is a security-as-a-service provider that enables large and mid-sized organizations to defend, protect, archive and govern their sensitive data. The stock is listed on the Nasdaq Stock Exchange. Price chart formed a 5 month-long ascending triangle with the horizontal boundary acting as strong resistance at 132.00 levels. The horizontal boundary was tested several times over the course of the chart pattern. A daily close above 136.00 levels will confirm the breakout from the 5 month-long ascending triangle with the possible chart pattern price target of 160.00 levels. Data as of October 15, 2019
By becoming a Premium Member, you’ll be able to improve your knowledge of the principles of classical charting.
With this knowledge, you can merge them with your investing system. In fact, some investors use my analyses to modify their existing style to invest more efficiently and successfully.
You will receive:
For your convenience your membership auto renews each year.
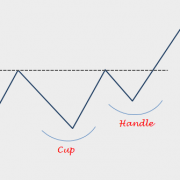
Every week Tech Charts Global Equity Markets report features some of the well-defined, mature classical chart patterns under a lengthy watchlist and the chart pattern breakout signals that took place during that week. Global Equity Markets report covers single stocks from developed, emerging and frontier markets, ETF’s and global equity indices. The report starts with a review section that highlights the important chart developments on global equity benchmarks. This blog post features from the watchlist section a bullish continuation cup & handle chart pattern opportunity, listed on the Nasdaq Stock Exchange.
GCI Liberty, Inc., formerly General Communication, Inc., is a holding company. The Company, together with its subsidiaries, is a communications provider with operations primarily in the State of Alaska. The Company provides a range of wireless, data, video, voice and managed services to residential customers, businesses, governmental entities, and educational and medical institutions primarily in Alaska under its GCI brand. The stock is listed on the Nasdaq Stock Exchange. Price chart formed a 3 month-long cup & handle continuation with the horizontal boundary acting as strong resistance at 65.00 levels. The horizontal boundary was tested several times over the course of the chart pattern. A daily close above 66.00 levels will confirm the breakout from the 3 month-long cup & handle continuation with the possible chart pattern price target of 72.75 levels. Breakout can push the stock to all-time highs. Data as of 10:30 am October 9, 2019
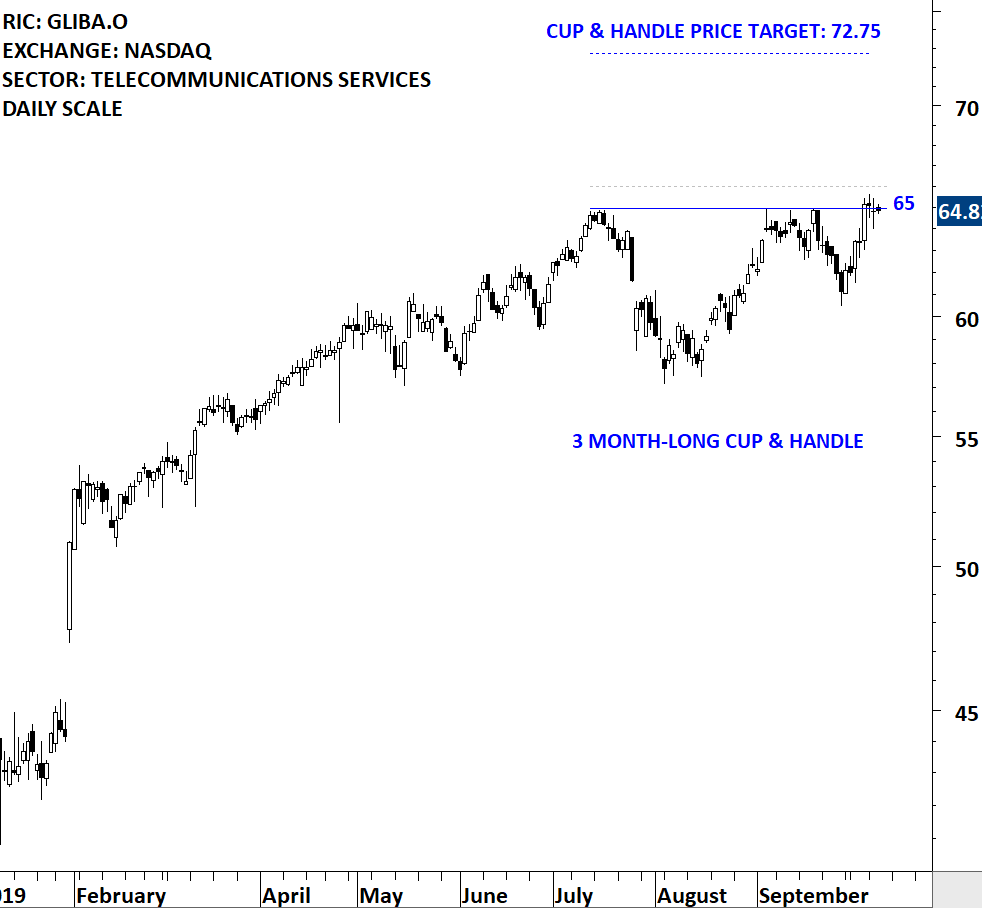
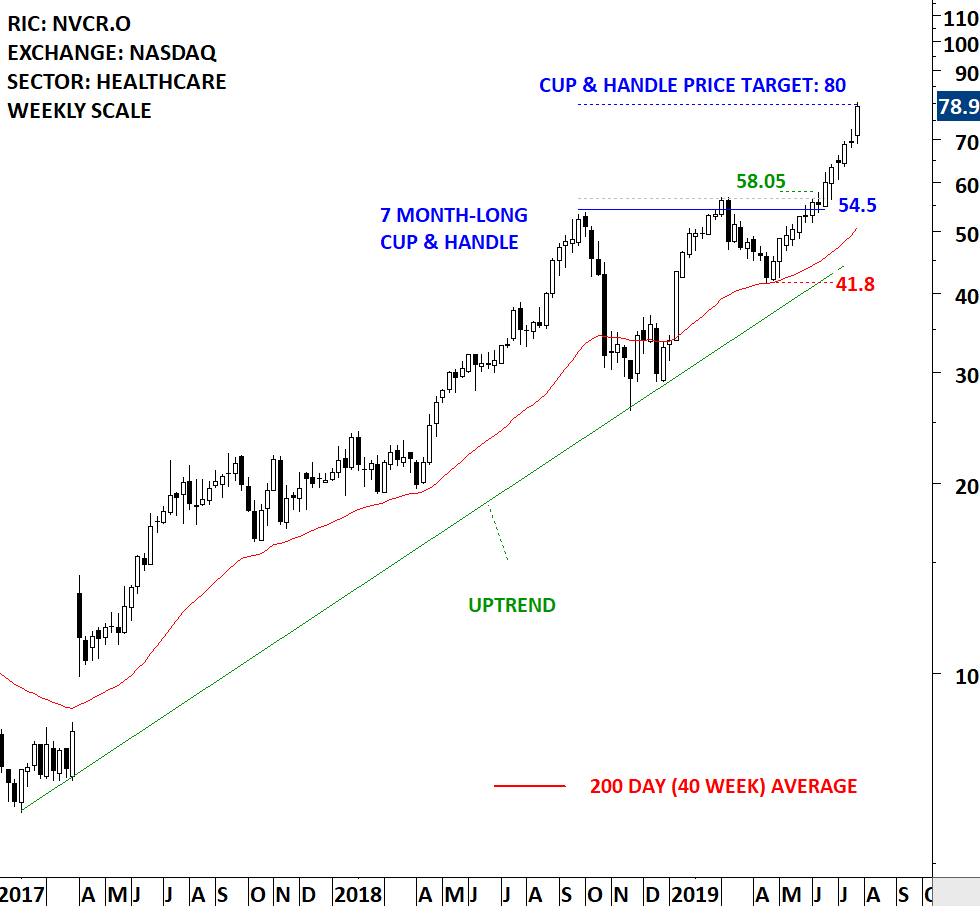
A recent breakout alert was issued in the Global Equity Markets report covering a similar cup & handle breakout opportunity on Novocure. The weekly scale price chart featured a 7 month-long cup & handle that broke out to all-time highs. Breakout to all-time highs from bullish continuation chart patterns is the path of least resistance. Similar chart patterns can form on daily, weekly and monthly scale price charts. The underlying dynamics are the same. Though it is important to note that the shorter the time frame the higher the probability of failure. My default time frame for research is weekly scale. I also look at chart patterns on daily scale.
By becoming a Premium Member, you’ll be able to improve your knowledge of the principles of classical charting.
With this knowledge, you can merge them with your investing system. In fact, some investors use my analyses to modify their existing style to invest more efficiently and successfully.
You will receive:
For your convenience your membership auto renews each year.

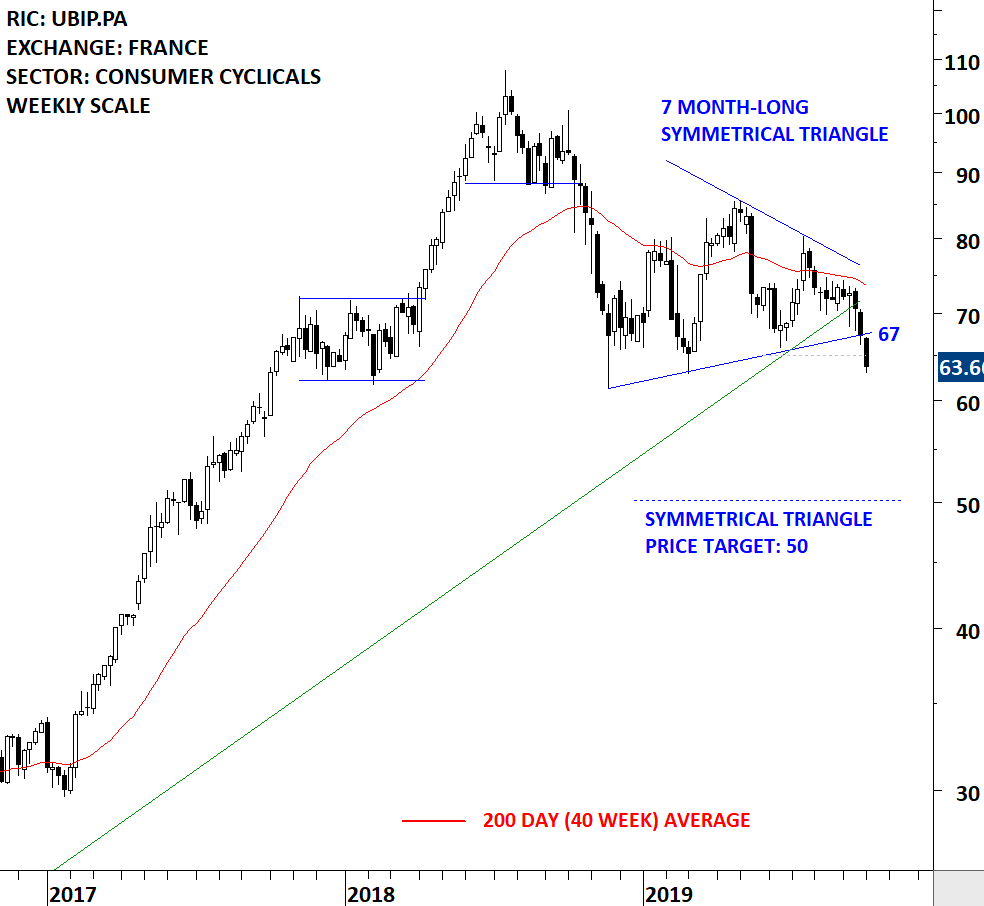
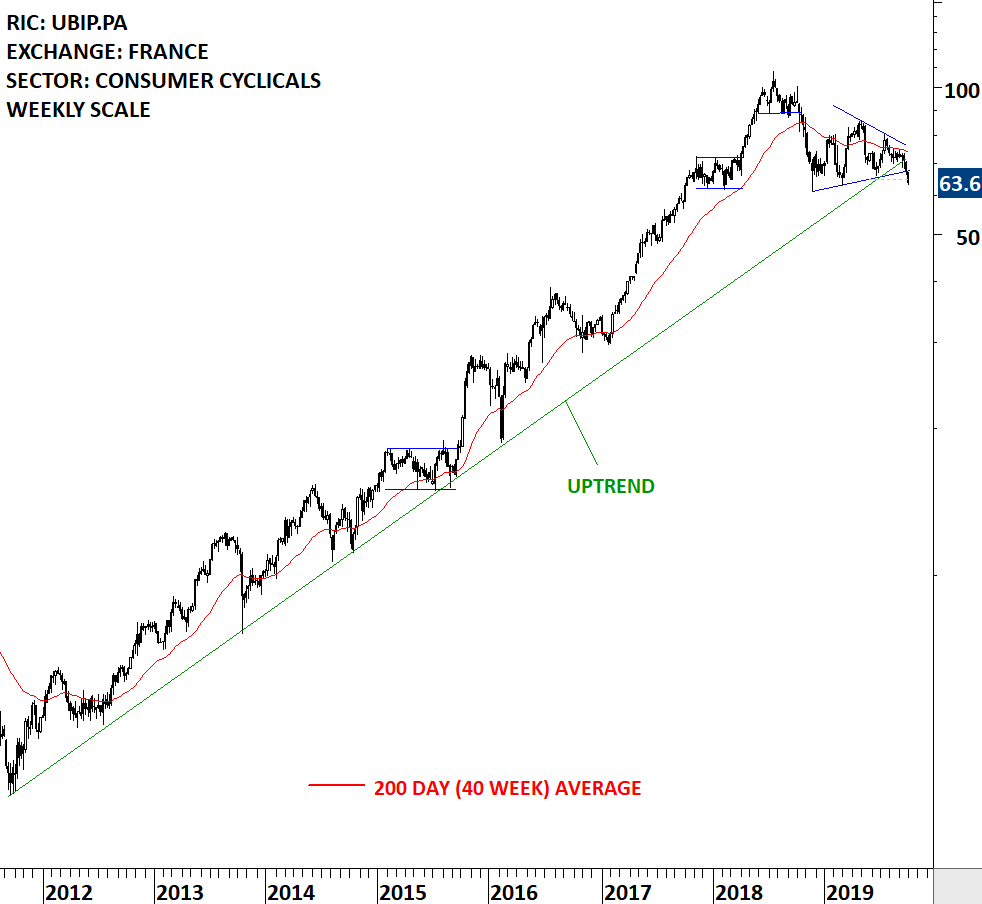
Every week Tech Charts Global Equity Markets report features some of the well-defined, mature classical chart patterns under a lengthy watchlist and the chart pattern breakout signals that took place during that week. Global Equity Markets report covers single stocks from developed, emerging and frontier markets, ETF’s and global equity indices. The report starts with a review section that highlights the important chart developments on global equity benchmarks. This blog post features from the watchlist section a bearish continuation symmetrical triangle chart pattern opportunity, listed on the Paris Stock Exchange.
Ubisoft Entertainment SA is a France-based company that is engaged in the development, publishing and distribution of video games. The stock is listed on the Paris Stock Exchange. Price chart formed a 7 month-long symmetrical triangle with the lower boundary acting as strong support at 67 levels. The lower boundary was tested several times over the course of the chart pattern. The daily close below 65 levels confirmed the breakdown from the 7 month-long symmetrical triangle with the possible chart pattern price target of 50 levels. The long-term price chart below shows the critical support level the stock is breaching. The breakdown from the symmetrical triangle breached the long-term uptrend line. (Learn more: Video Tutorial) (Data as of Oct 1, 2019) Important note: The weekly scale price chart shows the first 2 days of trading (Monday & Tuesday) on the last candlestick)
By becoming a Premium Member, you’ll be able to improve your knowledge of the principles of classical charting.
With this knowledge, you can merge them with your investing system. In fact, some investors use my analyses to modify their existing style to invest more efficiently and successfully.
You will receive:
For your convenience your membership auto renews each year.

A review of the most reliable chart patterns Tech Charts Global Equity Markets report featured over the past two years – September 2019 Tech Charts Webinar
Webinar Outline
Live questions from Members
Recorded live 9.15.2019

Every week Tech Charts Global Equity Markets report features some of the well-defined, mature classical chart patterns under a lengthy watchlist and the chart pattern breakout signals that took place during that week. Global Equity Markets report covers single stocks from developed, emerging and frontier markets, ETF’s and global equity indices. The report starts with a review section that highlights the important chart developments on global equity benchmarks. This blog post features from the watchlist section a rectangle chart pattern opportunity, listed on the Nasdaq Stock Exchange.
JD.com, Inc. is an online direct sales company. The Company engages in the sale of electronics and home appliance products and general merchandise products (including audio, video products and books) sourced from manufacturers, distributors and publishers in China on the Internet through its Website, www.jd.com. The stock is listed on the Nasdaq Stock Exchange. Price chart formed a 5 month-long rectangle with the horizontal boundary acting as strong resistance at 32.00 levels. The horizontal boundary was tested several times over the course of the chart pattern. A daily close above 33.00 levels will confirm the breakout from the 5 month-long rectangle with the possible chart pattern price target of 38.25 levels. (Data as of September 16, 2019)
By becoming a Premium Member, you’ll be able to improve your knowledge of the principles of classical charting.
With this knowledge, you can merge them with your investing system. In fact, some investors use my analyses to modify their existing style to invest more efficiently and successfully.
You will receive:
For your convenience your membership auto renews each year.

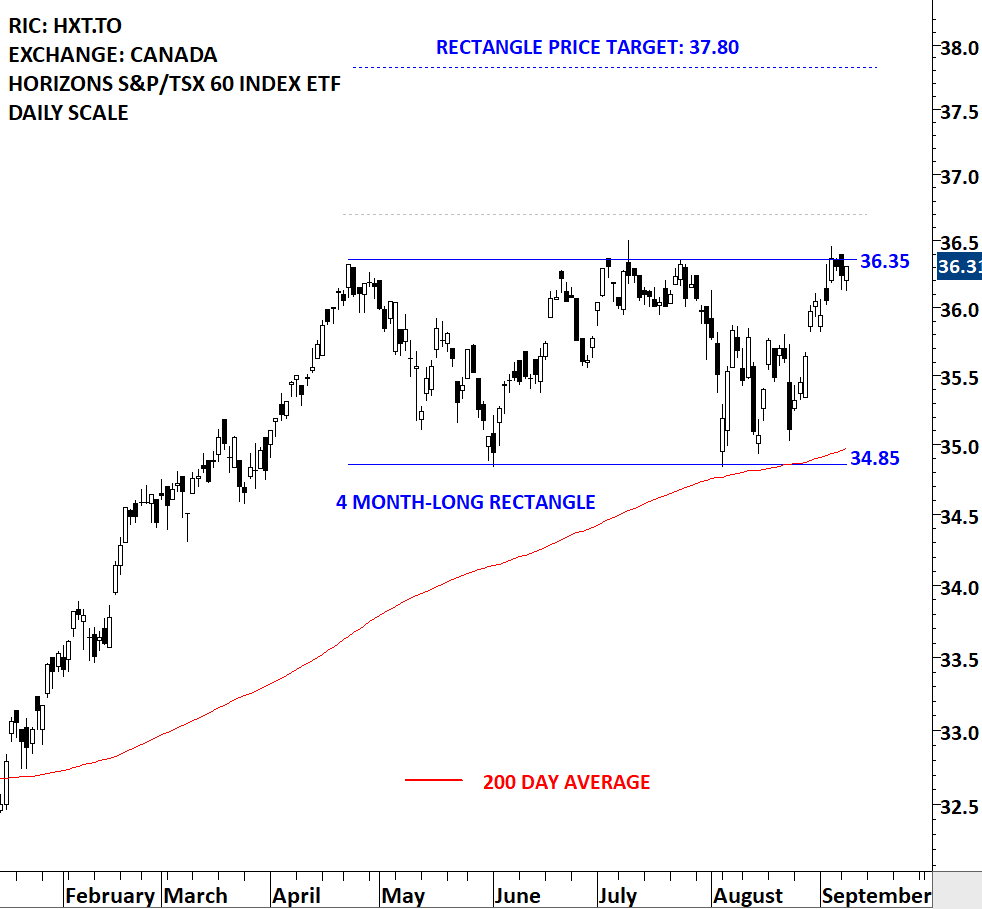
Every week Tech Charts Global Equity Markets report features some of the well-defined, mature classical chart patterns under a lengthy watchlist and the chart pattern breakout signals that took place during that week. Global Equity Markets report covers single stocks from developed, emerging and frontier markets, ETF’s and global equity indices. The report starts with a review section that highlights the important chart developments on global equity benchmarks. This blog post features from the watchlist section a rectangle chart pattern opportunity, listed on the Toronto Stock Exchange.
The Fund seeks to replicate, to the extent possible, the performance of the S&P/TSX 60 Index (Total Return), net of expenses. The S&P/TSX 60 Index (Total Return) is designed to measure the performance of the large-cap market segment of the Canadian equity market. The ETF is listed on the Toronto Stock Exchange. Price chart formed a 4 month-long rectangle with the horizontal boundary acting as strong resistance at 36.35 levels. The horizontal boundary was tested several times over the course of the chart pattern. A daily close above 36.70 levels will confirm the breakout from the 4 month-long rectangle with the possible chart pattern price target of 37.8 levels. (Data as of Sept 10, 2019)
By becoming a Premium Member, you’ll be able to improve your knowledge of the principles of classical charting.
With this knowledge, you can merge them with your investing system. In fact, some investors use my analyses to modify their existing style to invest more efficiently and successfully.
You will receive:
For your convenience your membership auto renews each year.

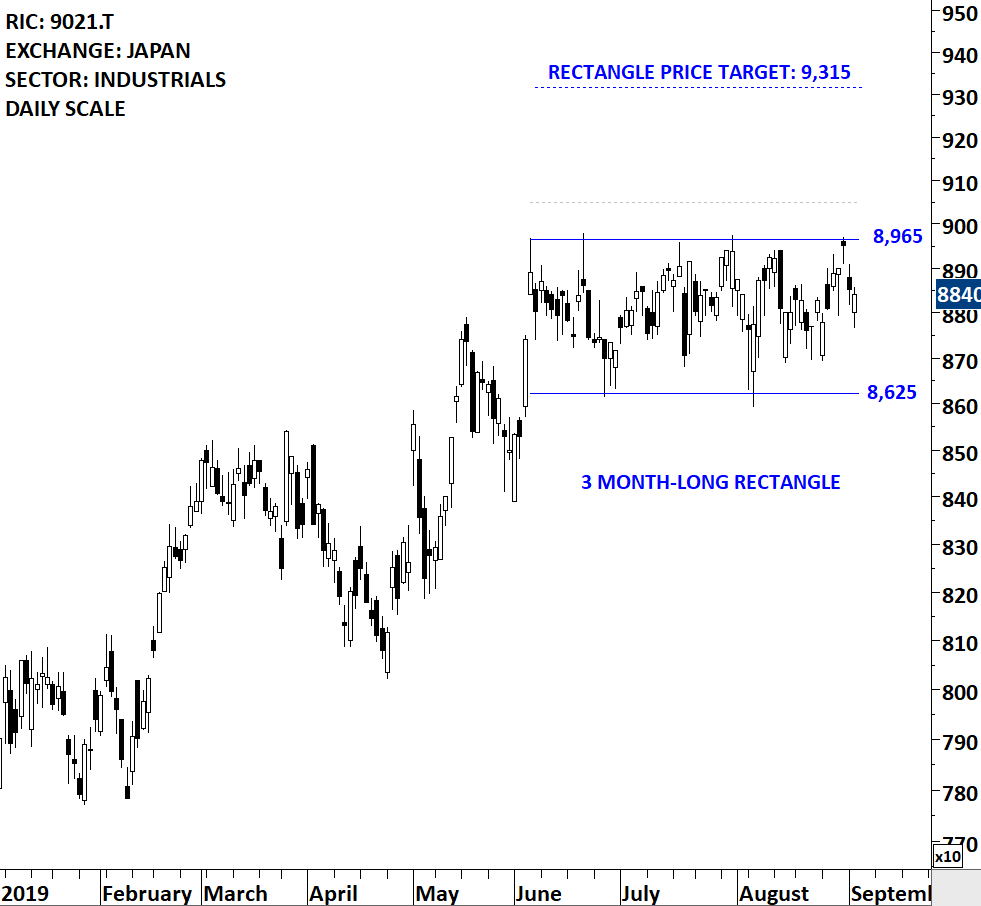
Long-time Tech Charts followers know that the Global Equity Markets report and blog posts feature well-defined classical chart patterns in duration between 4 months and 24 months on weekly scale price charts. I have been focusing on capturing long-term breakut opportunities. Going forward I will start adding classical chart patterns in shorter-term duration and cover those well-defined horizontal chart patterns in duration between 2 months and 4 months on daily scale. I hope this new addition to the weekly reports will offer more opportunities to those who trade classical chart pattern breakouts on Global equities. This blog post features from the watchlist section a rectangle chart pattern opportunity, listed on the Tokyo Stock Exchange.
West Japan Railway Company is mainly engaged in the provision of passenger railway transportation services. The stock is listed on the Tokyo Stock Exchange. Price chart formed a 3 month-long rectangle with the horizontal boundary acting as strong resistance at 8,965.00 levels. The horizontal boundary was tested several times over the course of the chart pattern. A daily close above 9,050.00 levels will confirm the breakout from the 3 month-long rectangle with the possible chart pattern price target of 9,315.00 levels. (Data as of Sep 3, 2019)
By becoming a Premium Member, you’ll be able to improve your knowledge of the principles of classical charting.
With this knowledge, you can merge them with your investing system. In fact, some investors use my analyses to modify their existing style to invest more efficiently and successfully.
You will receive:
For your convenience your membership auto renews each year.


