“Demystifying the world of Classical Charting”
– AKSEL KIBAR
Every week Tech Charts Global Equity Markets report features some of the well-defined, mature classical chart patterns under a lengthy watchlist and the chart pattern breakout signals that took place during that week. Global Equity Markets report covers single stocks from developed, emerging and frontier markets, ETF’s and global equity indices. The report starts with a review section that highlights the important chart developments on global equity benchmarks. This blog post features from the watchlist section Independence Realty Trust, Inc. listed on the New York Stock Exchange.
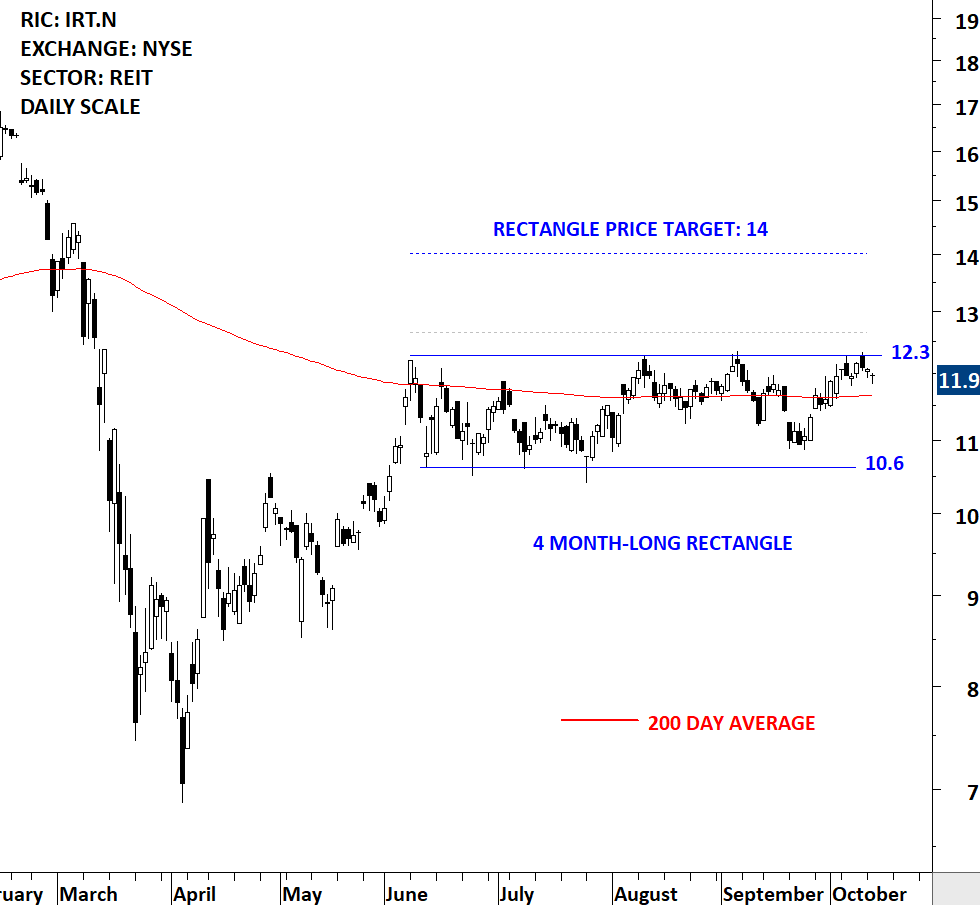
Independence Realty Trust, Inc. is an internally-managed real estate investment trust (REIT). The Company is engaged in the business of owning, managing, operating, leasing, acquiring, developing, investing in, and disposing of real estate assets. The stock is listed on the New York Stock Exchange. Price chart formed a 4 month-long rectangle with the horizontal boundary acting as strong resistance at 12.30 levels. The horizontal boundary was tested several times over the course of the chart pattern. A daily close above 12.65 levels will confirm the breakout from the 4 month-long rectangle with the possible chart pattern price target of 14.0 levels.

By becoming a Premium Member, you’ll be able to improve your knowledge of the principles of classical charting.
With this knowledge, you can merge them with your investing system. In fact, some investors use my analyses to modify their existing style to invest more efficiently and successfully.
You will receive:
For your convenience your membership auto renews each year.
Every week Tech Charts Global Equity Markets report features some of the well-defined, mature classical chart patterns under a lengthy watchlist and the chart pattern breakout signals that took place during that week. Global Equity Markets report covers single stocks from developed, emerging and frontier markets, ETF’s and global equity indices. The report starts with a review section that highlights the important chart developments on global equity benchmarks. This blog post features from the review section the China SSE Composite Index.
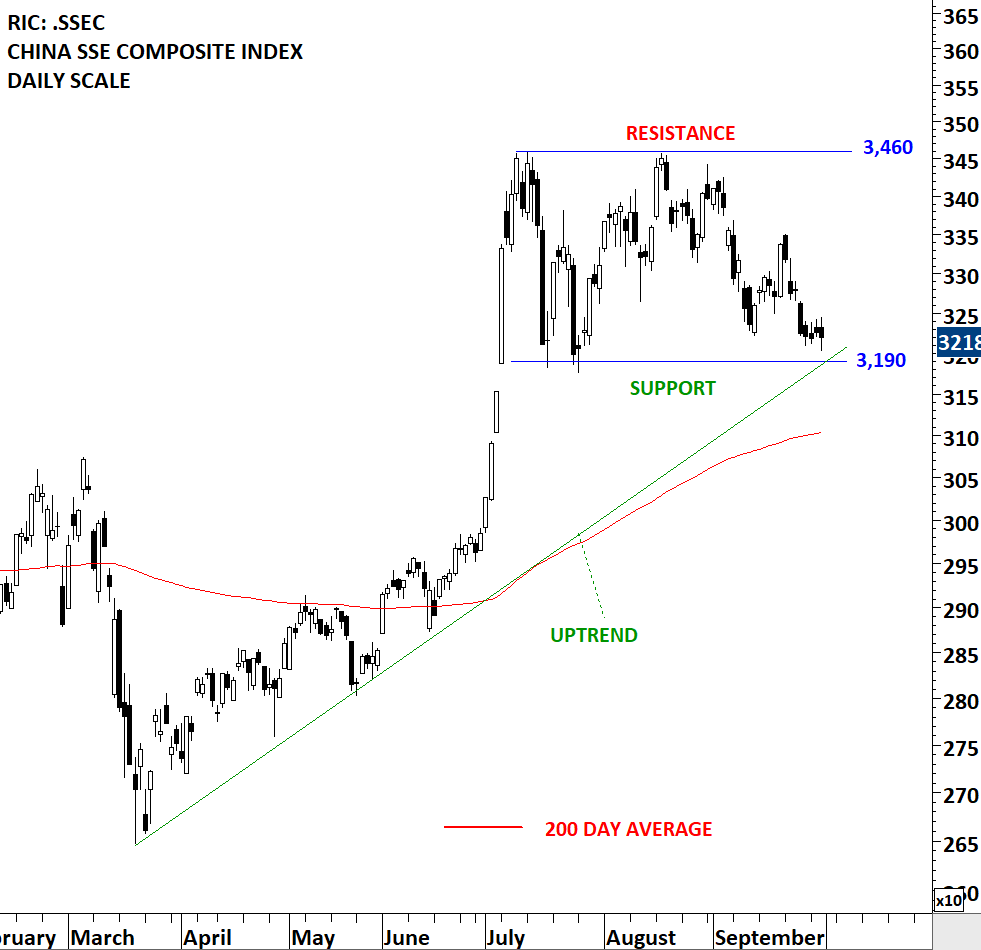
The chart below shows the China SSE Composite Index (larger universe for China equities). Following the strong rally during June-July period the index entered into a sideways consolidation. The Chinese benchmark is now at an important inflection point. If the support at 3,190 levels holds, given the price testing the uptrend line and holding above the 200-day average, we can expect a rebound and strong quarter for Chinese equities. Last 3 month’s price action can form a well-defined rectangle chart pattern. After a long holiday, China equities start trading on the 9th of October.

By becoming a Premium Member, you’ll be able to improve your knowledge of the principles of classical charting.
With this knowledge, you can merge them with your investing system. In fact, some investors use my analyses to modify their existing style to invest more efficiently and successfully.
You will receive:
For your convenience your membership auto renews each year.
Every week Tech Charts Global Equity Markets report features some of the well-defined, mature classical chart patterns under a lengthy watchlist and the chart pattern breakout signals that took place during that week. Global Equity Markets report covers single stocks from developed, emerging and frontier markets, ETF’s and global equity indices. The report starts with a review section that highlights the important chart developments on global equity benchmarks. This blog post features from the watchlist section Gubre Fabrikalari TAS (Gubretas) listed on the Istanbul Stock Exchange.
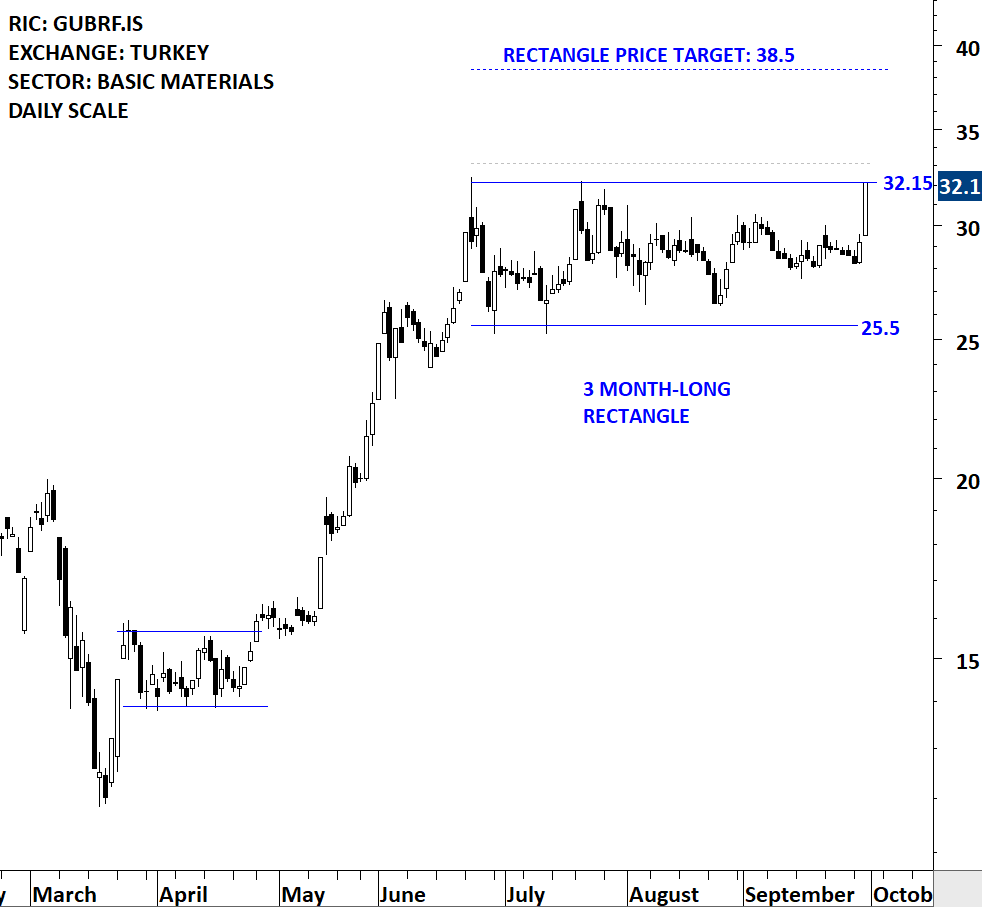
Gubre Fabrikalari TAS (Gubretas) is a Turkey-based company engaged in the production and marketing of chemical fertilizers, including solid fertilizers, liquid fertilizers, powder-based fertilizers and organic fertilizers. The stock is listed on the Istanbul Stock Exchange. Price chart formed a 3 month-long rectangle with the horizontal boundary acting as strong resistance at 32.15 levels. The horizontal boundary was tested several times over the course of the chart pattern. A daily close above 33.15 levels will confirm the breakout from the 3 month long rectangle with the possible chart pattern price target of 38.50 levels. Breakout will push the stock to all-time highs.

By becoming a Premium Member, you’ll be able to improve your knowledge of the principles of classical charting.
With this knowledge, you can merge them with your investing system. In fact, some investors use my analyses to modify their existing style to invest more efficiently and successfully.
You will receive:
For your convenience your membership auto renews each year.
Every week Tech Charts Global Equity Markets report features some of the well-defined, mature classical chart patterns under a lengthy watchlist and the chart pattern breakout signals that took place during that week. Global Equity Markets report covers single stocks from developed, emerging and frontier markets, ETF’s and global equity indices. The report starts with a review section that highlights the important chart developments on global equity benchmarks. This blog post features from the watchlist section SBA Communications Corporation listed on the Nasdaq Stock Exchange.
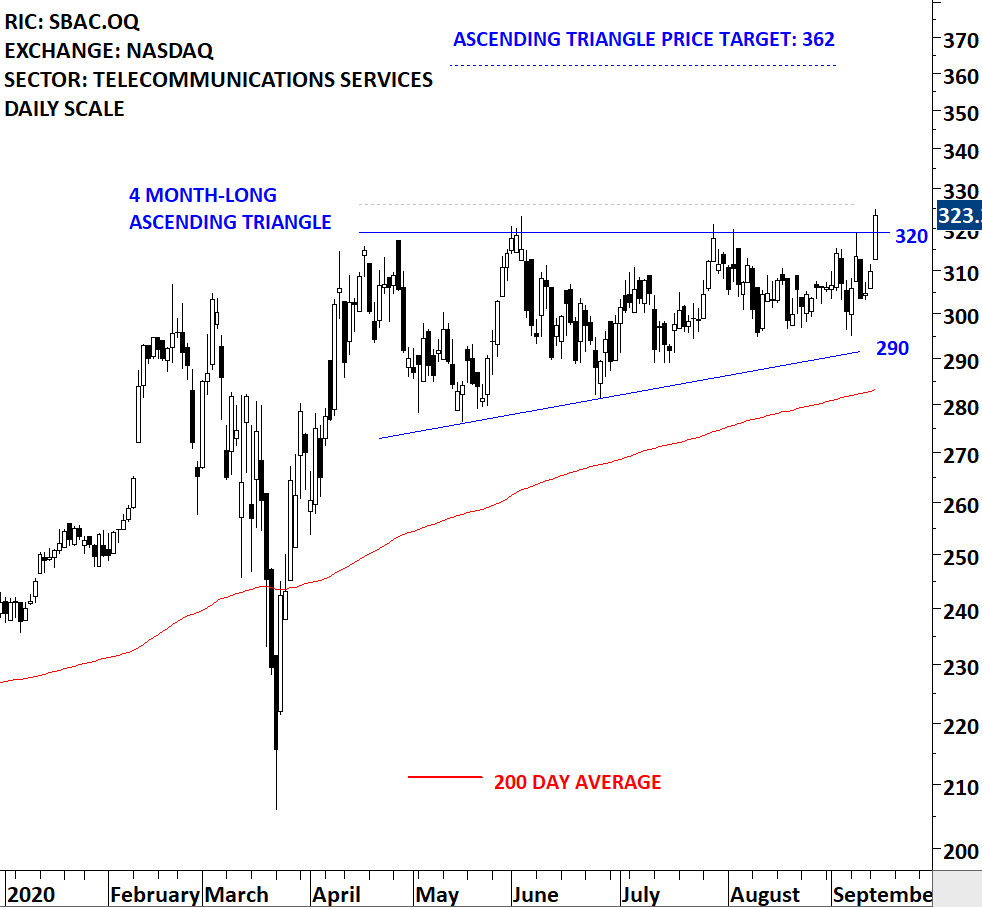
SBA Communications Corporation is an independent owner and operator of wireless communications tower structures, rooftops and other structures that support antennas used for wireless communications. The stock is listed on the Nasdaq Stock Exchange. Price chart formed a 4 month-long ascending triangle with the horizontal boundary acting as strong resistance at 320.00 levels. The horizontal boundary was tested several times over the course of the chart pattern. A daily close above 326.00 levels will confirm the breakout from the 4 month-long ascending triangle with the possible chart pattern price target of 362.00 levels. Breakout can push the stock to all-time highs.

By becoming a Premium Member, you’ll be able to improve your knowledge of the principles of classical charting.
With this knowledge, you can merge them with your investing system. In fact, some investors use my analyses to modify their existing style to invest more efficiently and successfully.
You will receive:
For your convenience your membership auto renews each year.
Every week Tech Charts Global Equity Markets report features some of the well-defined, mature classical chart patterns under a lengthy watchlist and the chart pattern breakout signals that took place during that week. Global Equity Markets report covers single stocks from developed, emerging and frontier markets, ETF’s and global equity indices. The report starts with a review section that highlights the important chart developments on global equity benchmarks. This blog post features from the watchlist section PUMA SE listed on the Frankfurt Stock Exchange.
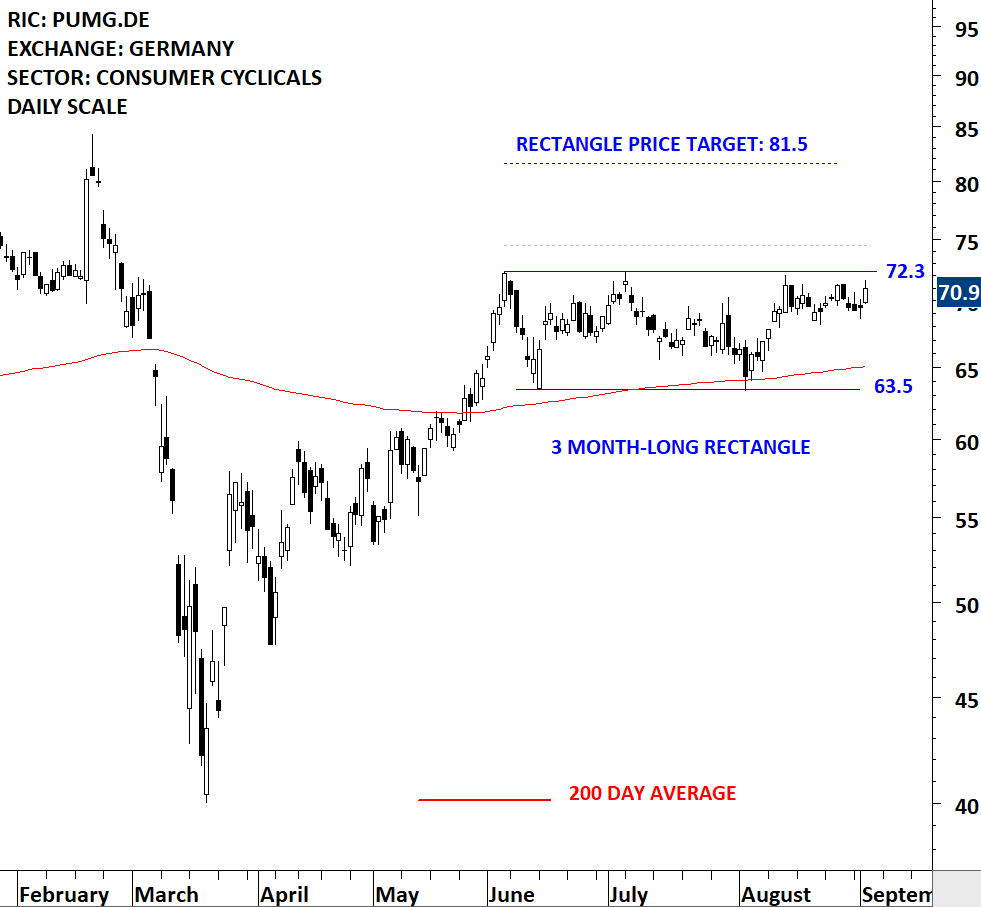
PUMA SE is engaged in designing, developing, selling and marketing footwear, apparel and accessories. The Company’s segments include Europe, Middle East and Africa (EMEA), Americas (North and Latin America) and Asia/Pacific. The stock is listed on the Frankfurt Stock Exchange. Price chart formed a 3 month-long rectangle with the horizontal boundary acting as strong resistance at 72.30 levels. The horizontal boundary was tested several times over the course of the chart pattern. A daily close above 74.50 levels will confirm the breakout from the 3 month-long rectangle with the possible chart pattern price target of 81.50 levels. (Data as of 02/08/2020 CET 13:50)

By becoming a Premium Member, you’ll be able to improve your knowledge of the principles of classical charting.
With this knowledge, you can merge them with your investing system. In fact, some investors use my analyses to modify their existing style to invest more efficiently and successfully.
You will receive:
For your convenience your membership auto renews each year.
Every week Tech Charts Global Equity Markets report features some of the well-defined, mature classical chart patterns under a lengthy watchlist and the chart pattern breakout signals that took place during that week. Global Equity Markets report covers single stocks from developed, emerging and frontier markets, ETF’s and global equity indices. The report starts with a review section that highlights the important chart developments on global equity benchmarks. This blog post features from the watchlist section Fuchs Petrolub SE listed on the Frankfurt Stock Exchange.
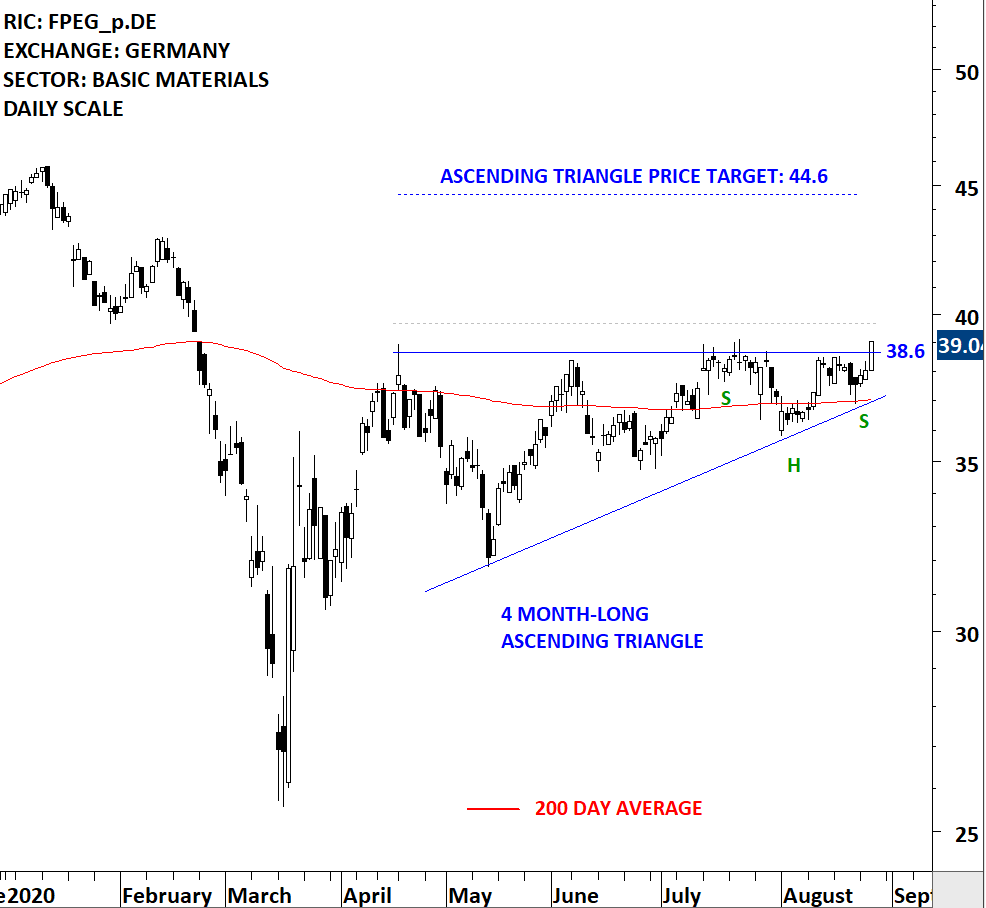
Fuchs Petrolub SE is a Germany-based company engaged in the development, production and supply of lubricants and related products for industry. The stock is listed on the Frankfurt Stock Exchange. Price chart formed a 4 month-long ascending triangle with the horizontal boundary acting as strong resistance at 38.60 levels. The horizontal boundary was tested several times over the course of the chart pattern. A daily close above 39.70 levels will confirm the breakout from the 4 month-long ascending triangle with the possible chart pattern price target of 44.60 levels. (Data as of 26/08/2020)

By becoming a Premium Member, you’ll be able to improve your knowledge of the principles of classical charting.
With this knowledge, you can merge them with your investing system. In fact, some investors use my analyses to modify their existing style to invest more efficiently and successfully.
You will receive:
For your convenience your membership auto renews each year.
Every week Tech Charts Global Equity Markets report features some of the well-defined, mature classical chart patterns under a lengthy watchlist and the chart pattern breakout signals that took place during that week. Global Equity Markets report covers single stocks from developed, emerging and frontier markets, ETF’s and global equity indices. The report starts with a review section that highlights the important chart developments on global equity benchmarks. This blog post features from the watchlist section FANCL CORP listed on the Tokyo Stock Exchange.
There is a common belief between finance professionals that Technical Analysis and charting is for short-term “timing” of entries and exits. I have written in different platforms that I think this is underestimating the power of charting and its uses in portfolio management and asset allocation. Portfolios/Funds hold different securities with different motivations. A fund manager can have a strong positive view on a company but if the stock is not being bought by the market, in other words the value not “yet” recognized by the market participants, it can remain in the portfolio resulting in opportunity cost.
Stocks go through consolidation periods followed by trends. It is during those trend periods that a fund or position traders will make money. Unless the fund manager/trader recognizes a well-defined trading range at its early stages and starts buying and selling in that range (selling at the resistance and buying at support), it is best to patiently wait for the breakout to take place from the lengthy consolidation.
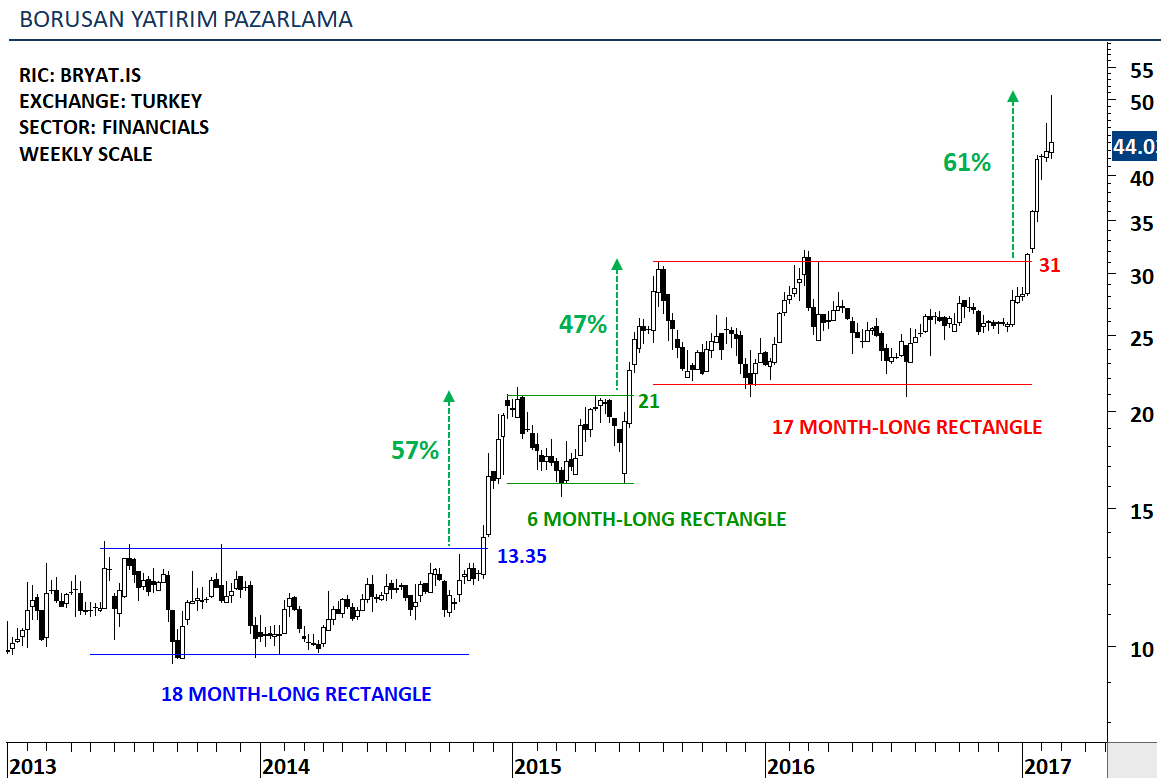
Price can remain in a well-defined range for several months. Once the stock breaks out, it can take few weeks/months for the strong price appreciation to take place. I like to focus on chart patterns with horizontal boundaries. They are easier to identify on price charts and focusing on horizontal boundaries will remove the bias from your analysis. It is much easier to think that there is a diagonal trend line somewhere (seeing trend lines that are not valid) on the price chart. But it is relatively difficult to come up with a well-defined horizontal consolidation with price having several touches on the boundaries.
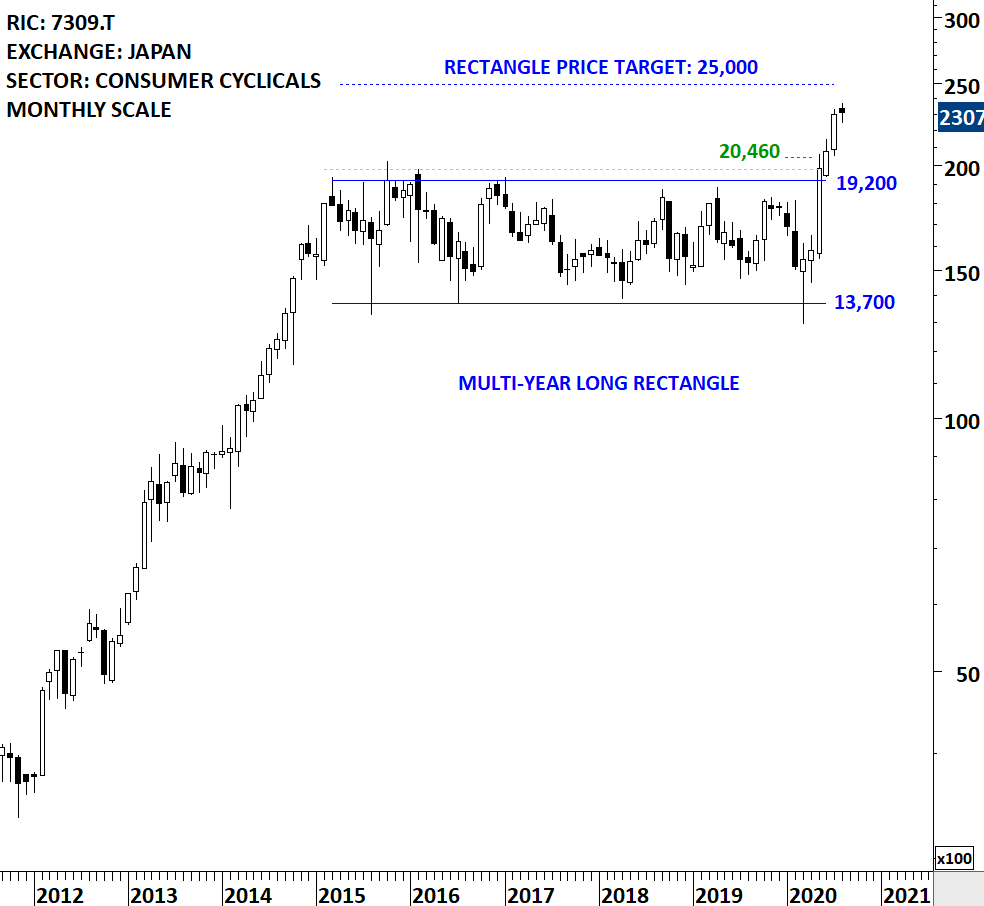
Earlier reports covered SHIMANO INC from Japan/Asia Equities as one of the breakout alerts. After remaining in a range for more than 5 years, SHIMANO INC completed its multi-year long consolidation on the upside. The chart pattern helped many long-term investors to position themselves in this name. Breakout took place to all-time highs, which I call it as the path of least resistance. SHIMANO INC is on its way towards the chart pattern price objective at 25,000 levels.
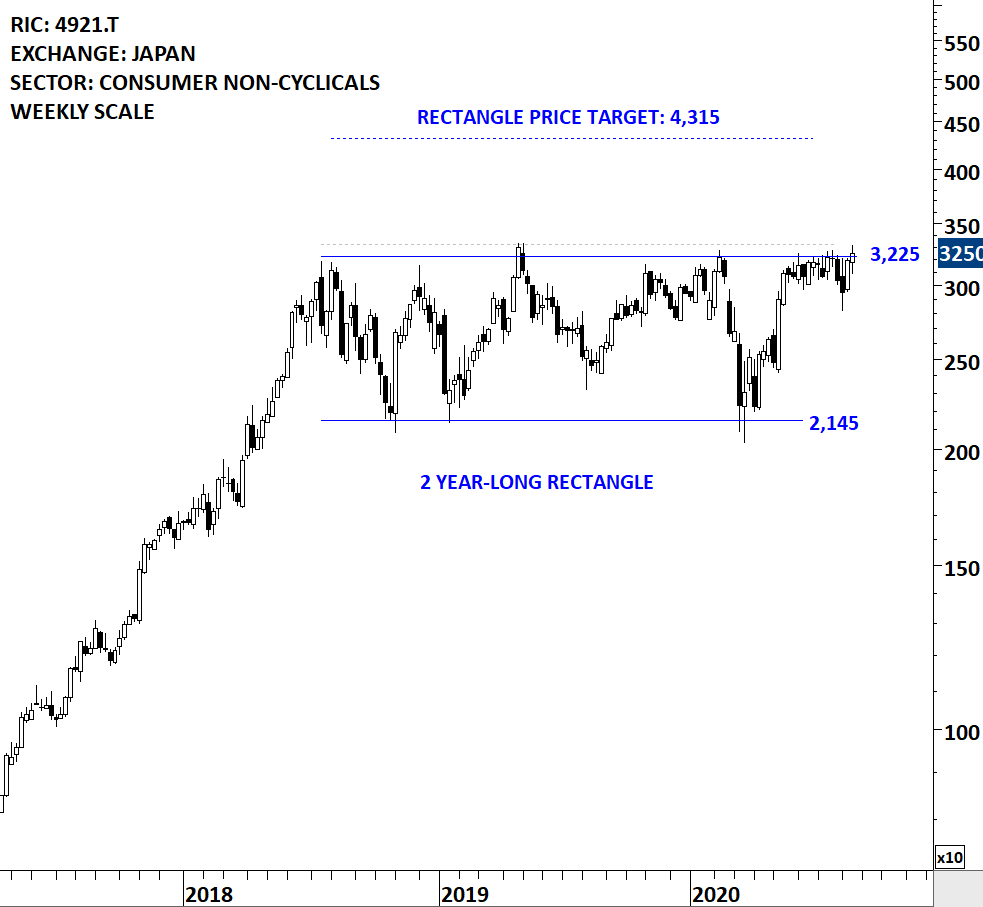
Another long-term breakout opportunity is discussed from Japan/ASIA equities in the Global Equity Markets report. FANCL CORP has a similar well-defined long-term consolidation that can complete soon. I’m monitoring this name for a confirmed breakout.
FANCL CORPORATION is a Japan-based company principally engaged in the research, development, manufacture and sale of cosmetics and dietary supplements. The stock is listed on the Tokyo Stock Exchange. Price chart formed a 2 year-long rectangle with the horizontal boundary acting as strong resistance at 3,225.0 levels. The horizontal boundary was tested several times over the course of the chart pattern. A daily close above 3,320.0 levels will confirm the breakout from the 2 year-long rectangle with the possible chart pattern price target of 4,315.0 levels. (Data as of 20/08/2020)

By becoming a Premium Member, you’ll be able to improve your knowledge of the principles of classical charting.
With this knowledge, you can merge them with your investing system. In fact, some investors use my analyses to modify their existing style to invest more efficiently and successfully.
You will receive:
For your convenience your membership auto renews each year.
Every week Tech Charts Global Equity Markets report features some of the well-defined, mature classical chart patterns under a lengthy watchlist and the chart pattern breakout signals that took place during that week. Global Equity Markets report covers single stocks from developed, emerging and frontier markets, ETF’s and global equity indices. The report starts with a review section that highlights the important chart developments on global equity benchmarks. This blog post features from the watchlist section NYFOSA AB listed on the Stockholm Stock Exchange.
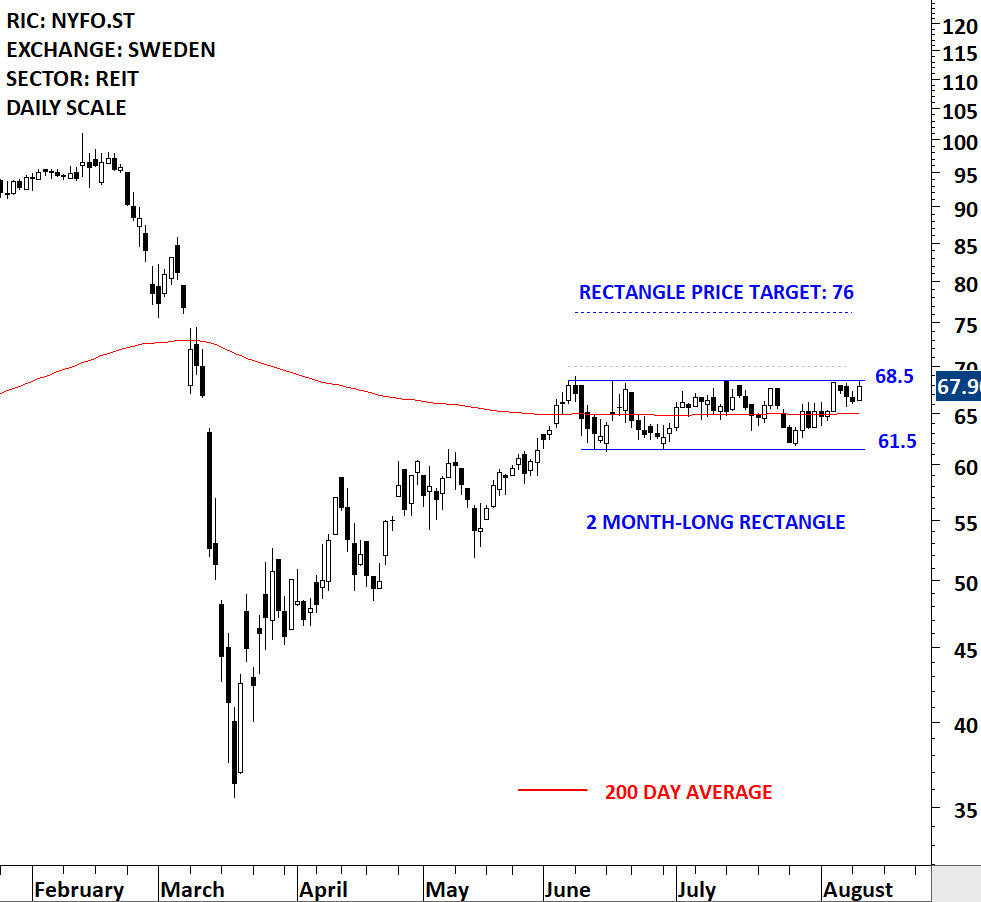
Nyfosa AB is a Sweden-based real estate investment company. The stock is listed on the Stockholm Stock Exchange. Price chart formed a 2 month-long rectangle with the horizontal boundary acting as strong resistance at 68.50 levels. The horizontal boundary was tested several times over the course of the chart pattern. A daily close above 70.00 levels will confirm the breakout from the 2 month-long rectangle with the possible chart pattern price target of 76.00 levels. (Data as of 12/08/2020)

By becoming a Premium Member, you’ll be able to improve your knowledge of the principles of classical charting.
With this knowledge, you can merge them with your investing system. In fact, some investors use my analyses to modify their existing style to invest more efficiently and successfully.
You will receive:
For your convenience your membership auto renews each year.
Every week Tech Charts Global Equity Markets report features some of the well-defined, mature classical chart patterns under a lengthy watchlist and the chart pattern breakout signals that took place during that week. Global Equity Markets report covers single stocks from developed, emerging and frontier markets, ETF’s and global equity indices. The report starts with a review section that highlights the important chart developments on global equity benchmarks. This blog post features from the watchlist section Dr. Reddy’s Laboratories Limited listed on the National Stock Exchange of India.
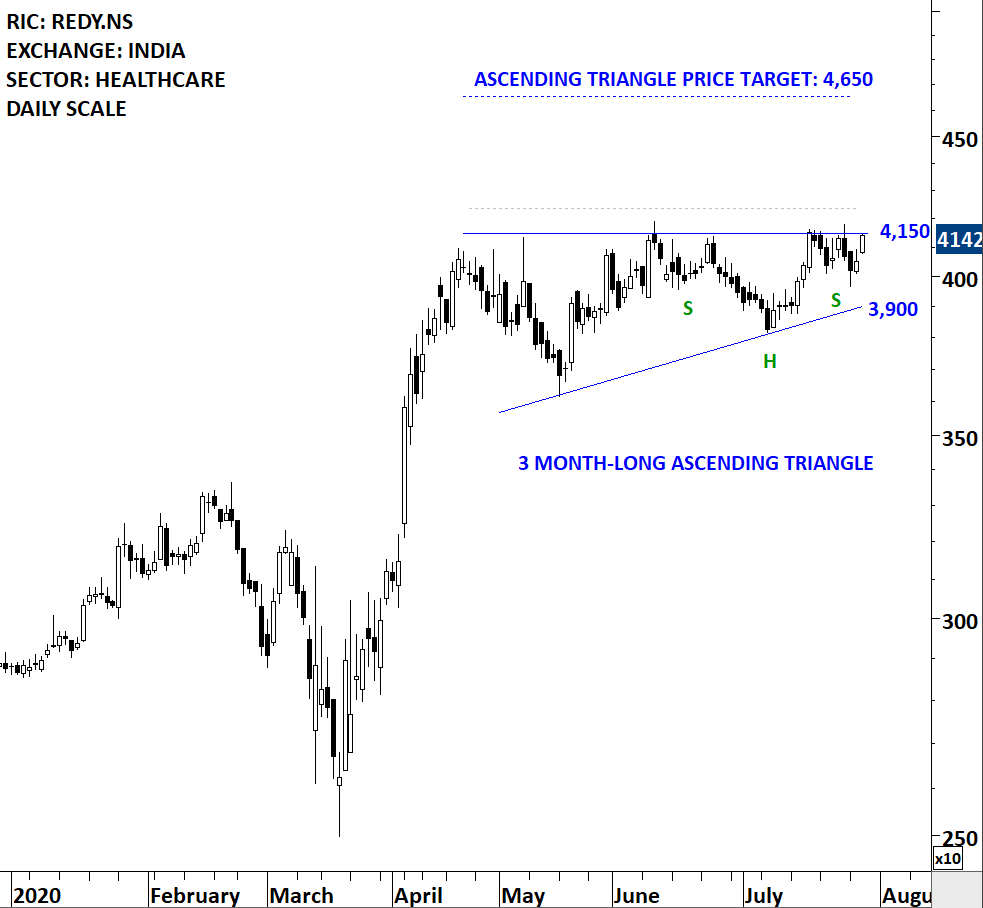
Dr. Reddy’s Laboratories Limited is a pharmaceutical company that is engaged in providing medicines. The Company operates in three segments: Global Generics, Pharmaceutical Services and Active Ingredients (PSAI), and Proprietary Products. The stock is listed on the National Stock Exchange of India. Price chart formed a 3 month-long ascending triangle with the horizontal boundary acting as strong resistance at 4,150.00 levels. The horizontal boundary was tested several times over the course of the chart pattern. A daily close above 4,235.00 levels will confirm the breakout from the 3 month-long ascending triangle with the possible chart pattern price target of 4,650.00 levels. A possible H&S continuation chart pattern can act as launching pattern and complete at the same time as the ascending triangle. (Data as of 20/07/2020, 7:45 AM CET)

By becoming a Premium Member, you’ll be able to improve your knowledge of the principles of classical charting.
With this knowledge, you can merge them with your investing system. In fact, some investors use my analyses to modify their existing style to invest more efficiently and successfully.
You will receive:
For your convenience your membership auto renews each year.
Every week Tech Charts Global Equity Markets report features some of the well-defined, mature classical chart patterns under a lengthy watchlist and the chart pattern breakout signals that took place during that week. Global Equity Markets report covers single stocks from developed, emerging and frontier markets, ETF’s and global equity indices. The report starts with a review section that highlights the important chart developments on global equity benchmarks. This blog post features from the watchlist section SANOFI SA listed on the Paris Stock Exchange.
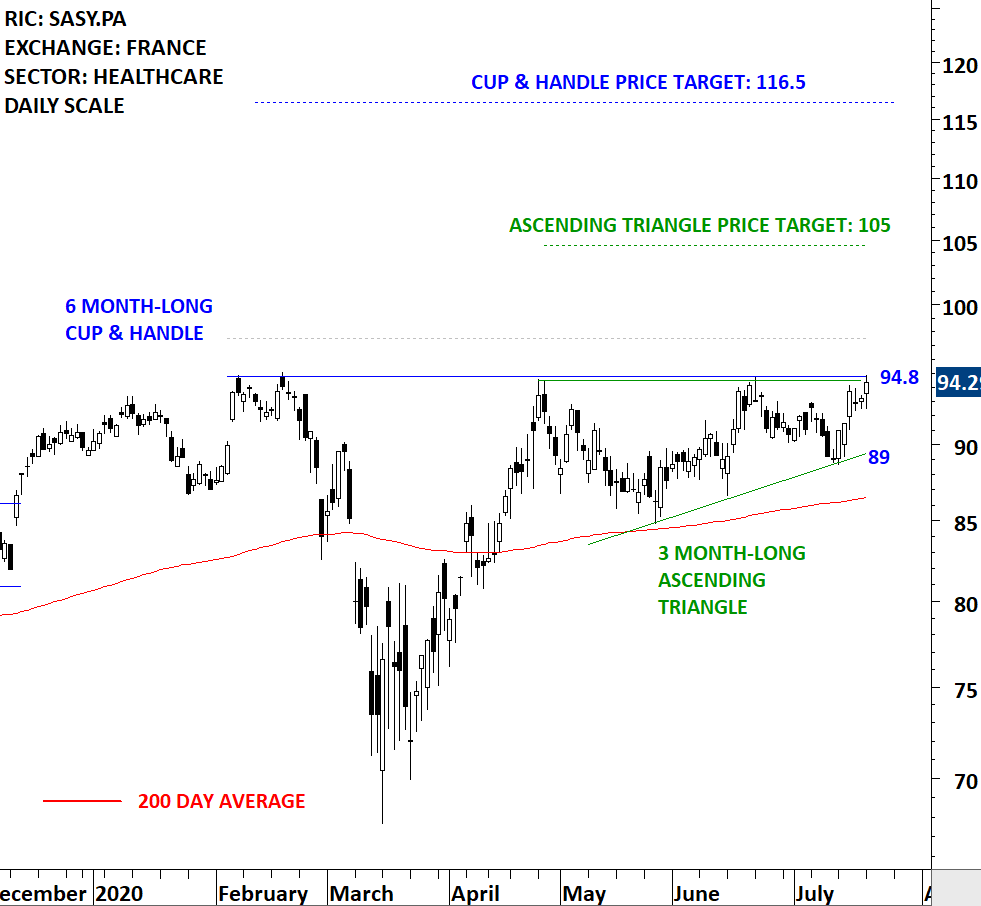
Sanofi is a healthcare company, focused on patient needs and engaged in the research, development, manufacture and marketing of therapeutic solutions. The stock is listed on the Paris Stock Exchange. Price chart formed a 6 month-long cup & handle continuation with the horizontal boundary acting as strong resistance at 94.80 levels. The horizontal boundary was tested several times over the course of the chart pattern. A daily close above 97.50 levels will confirm the breakout from the 6 month-long cup & handle continuation with the possible chart pattern price target of 116.50 levels. The handle part of the cup & handle chart pattern can be identified as a possible ascending triangle with the chart pattern price target of 105 levels. (Data as of 20/07/2020)

By becoming a Premium Member, you’ll be able to improve your knowledge of the principles of classical charting.
With this knowledge, you can merge them with your investing system. In fact, some investors use my analyses to modify their existing style to invest more efficiently and successfully.
You will receive:
For your convenience your membership auto renews each year.

