GLOBAL EQUITY MARKETS – September 3, 2022
REVIEW
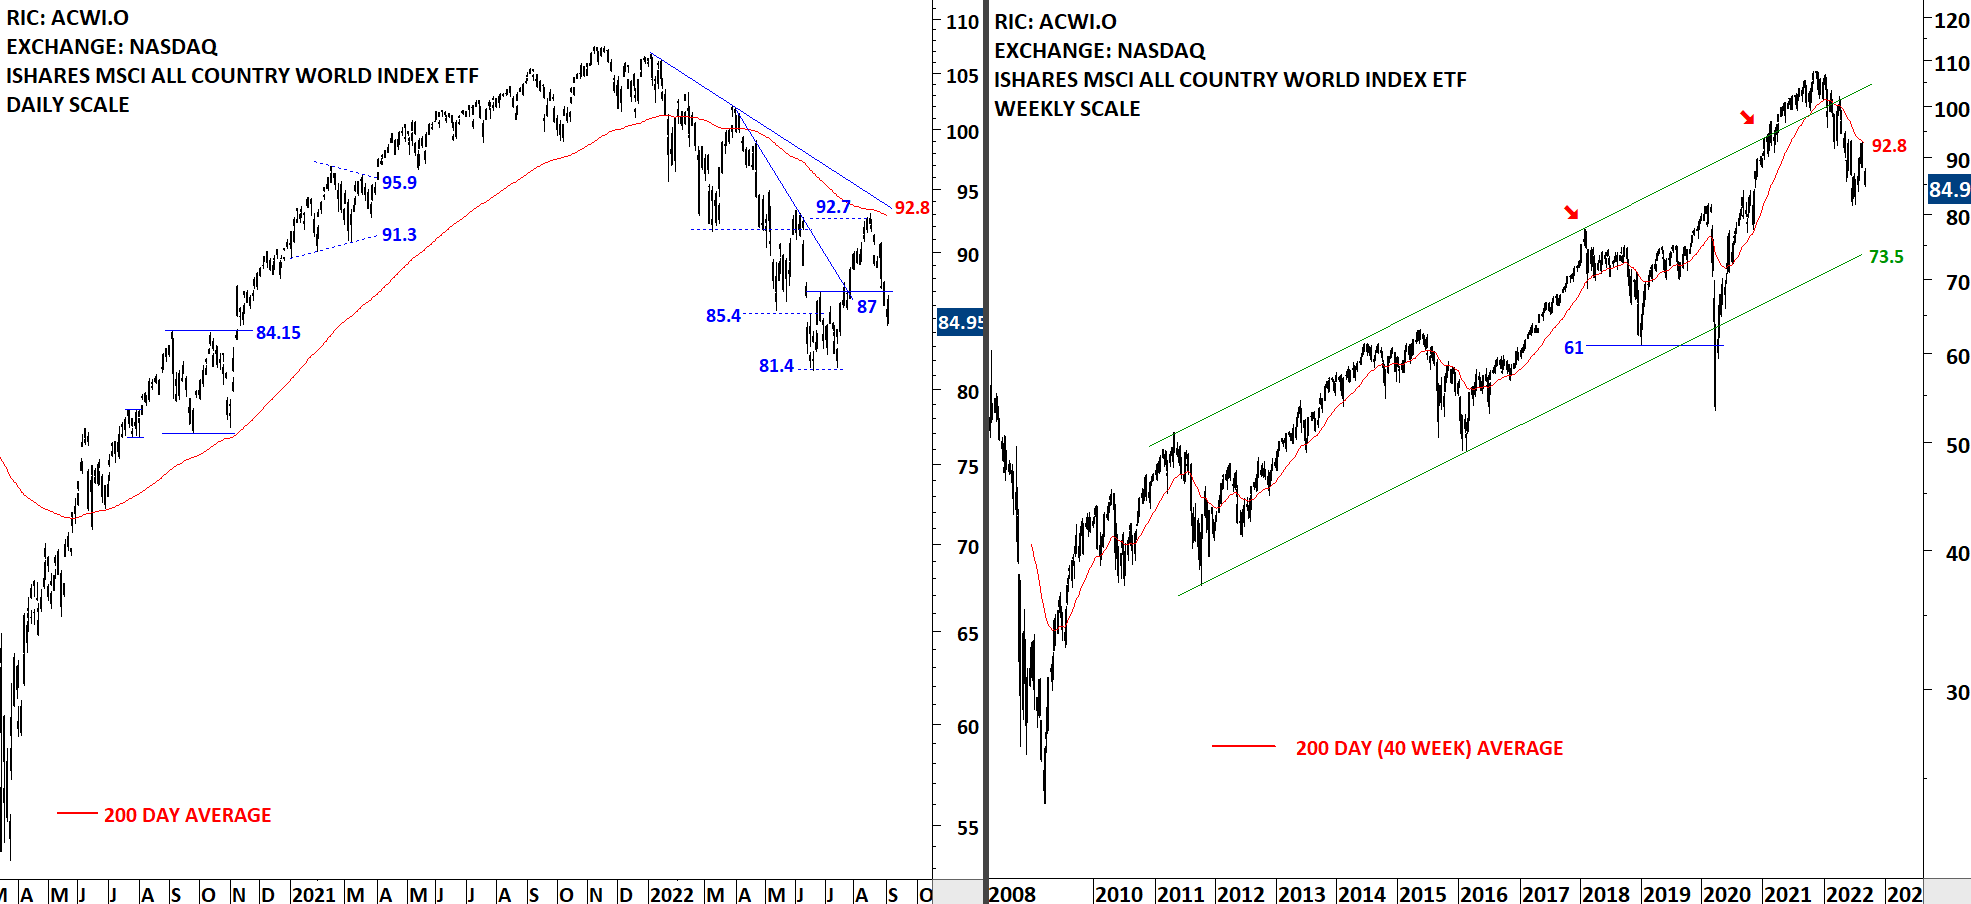
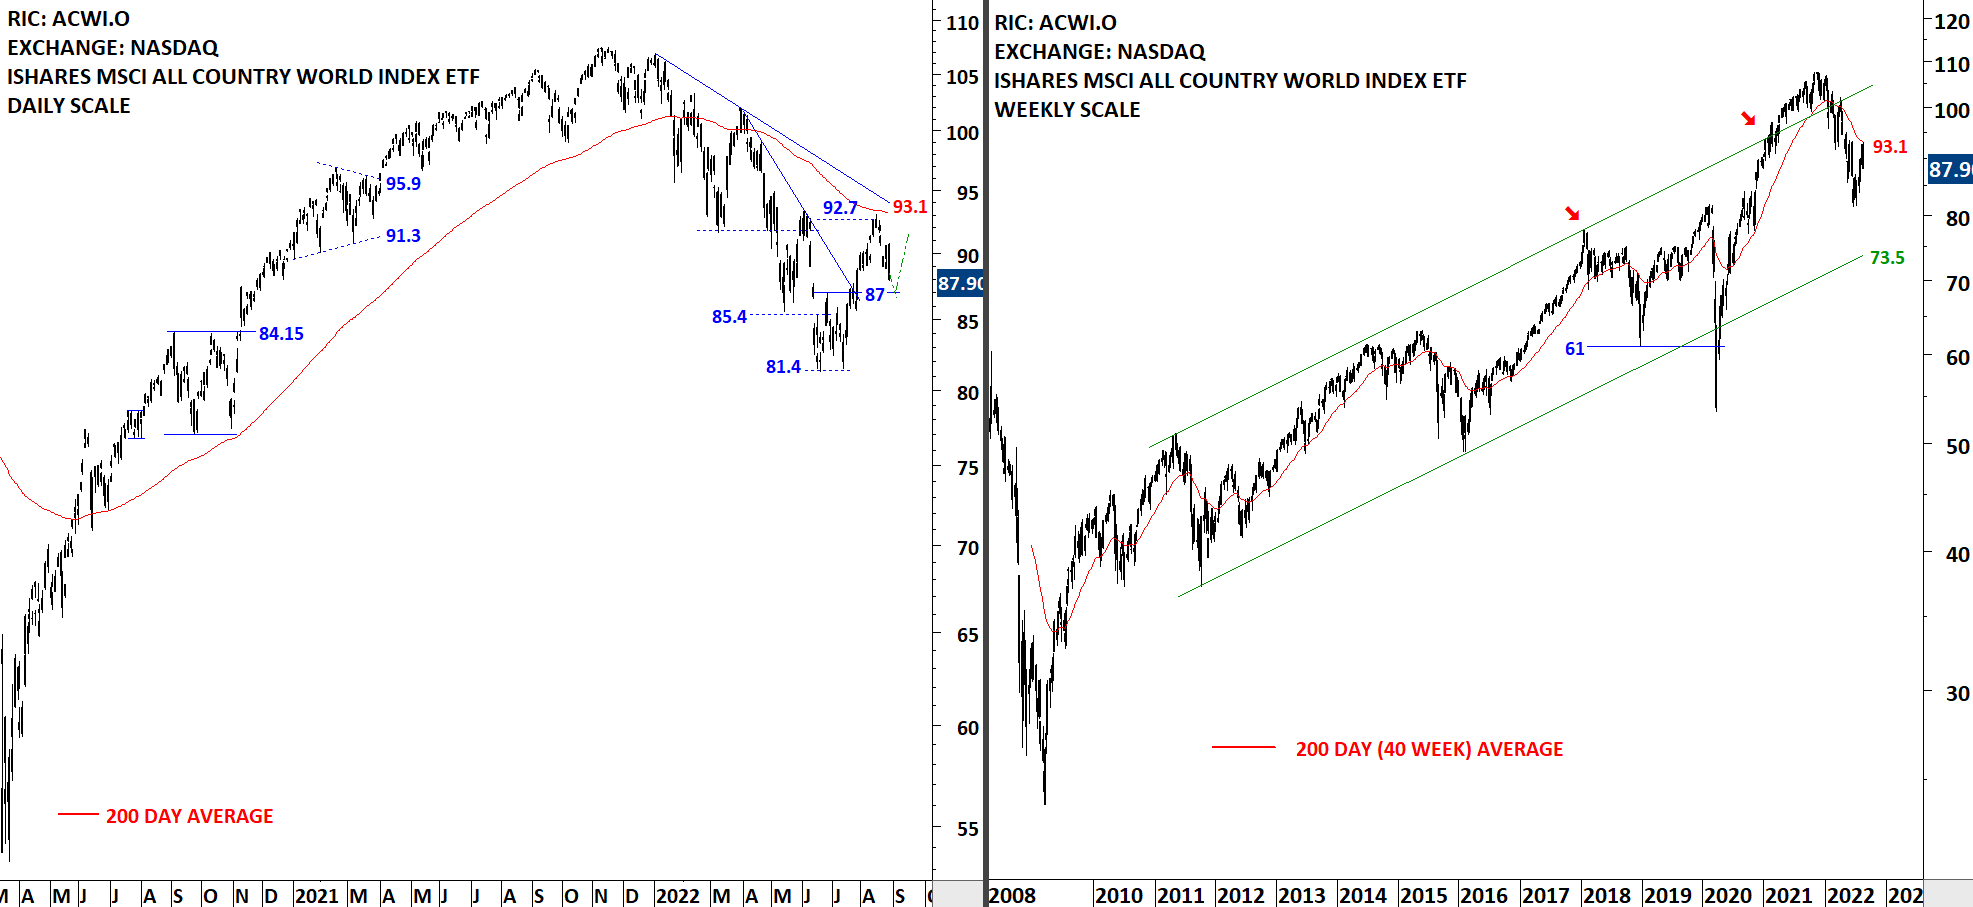
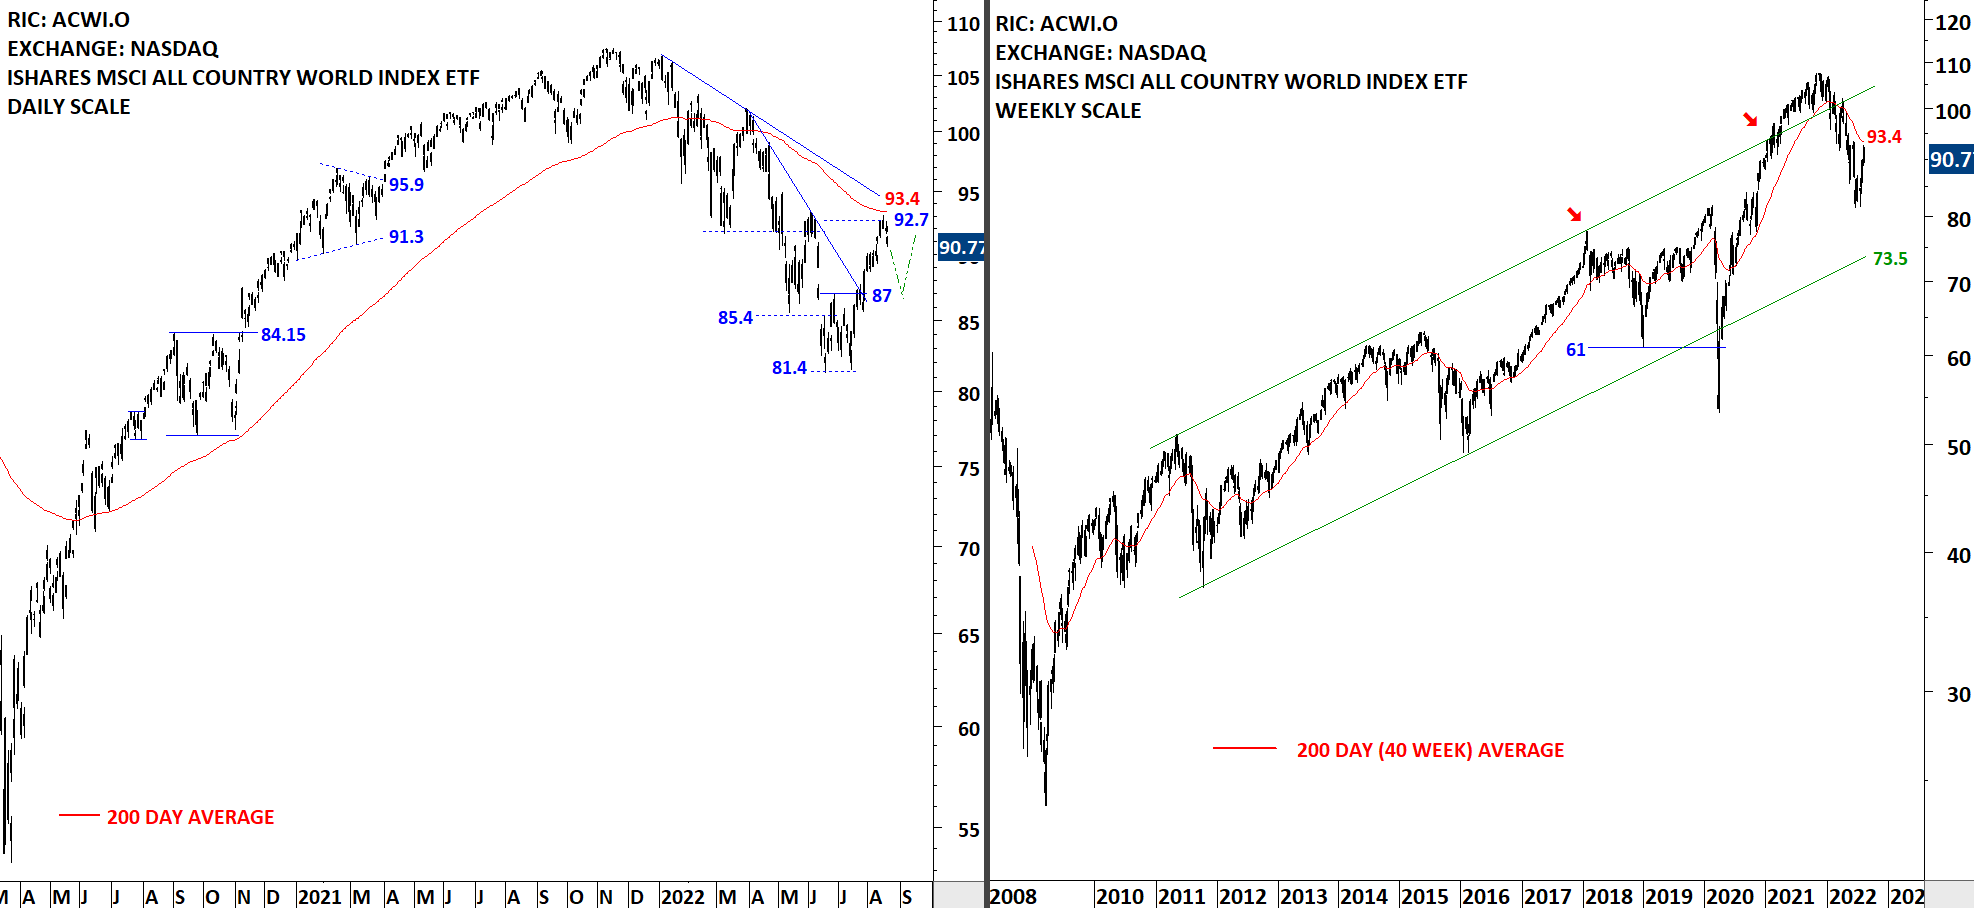
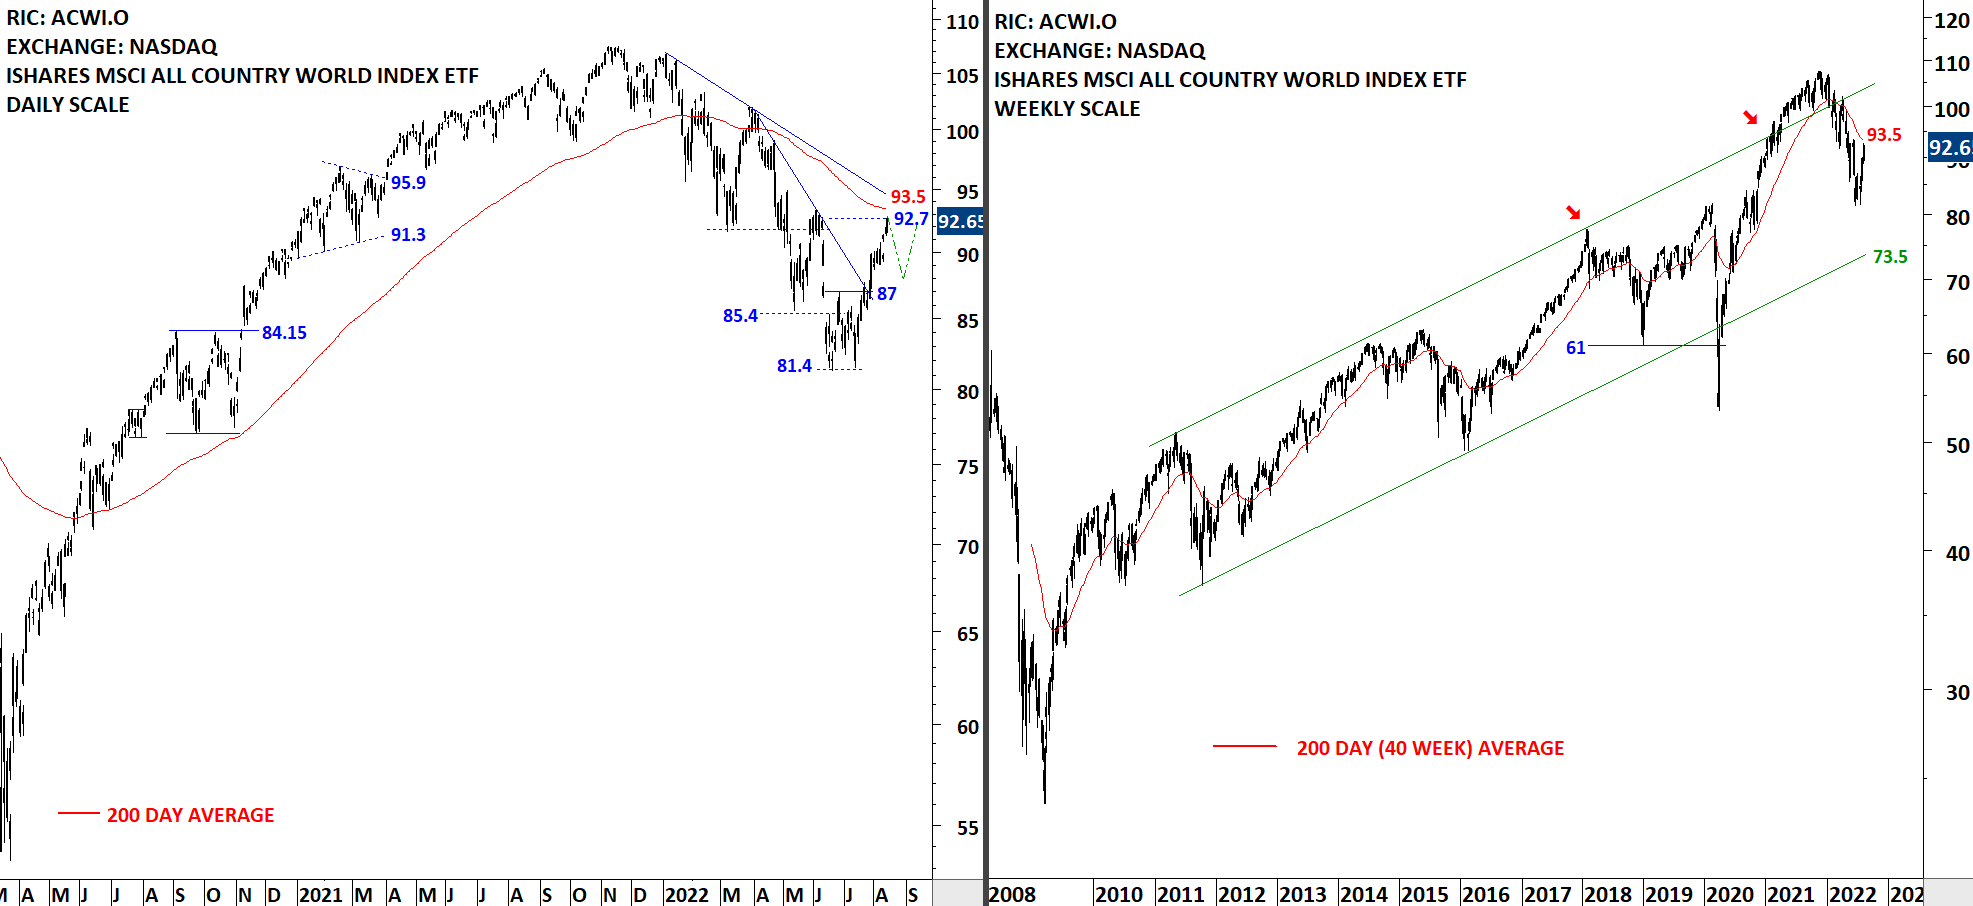
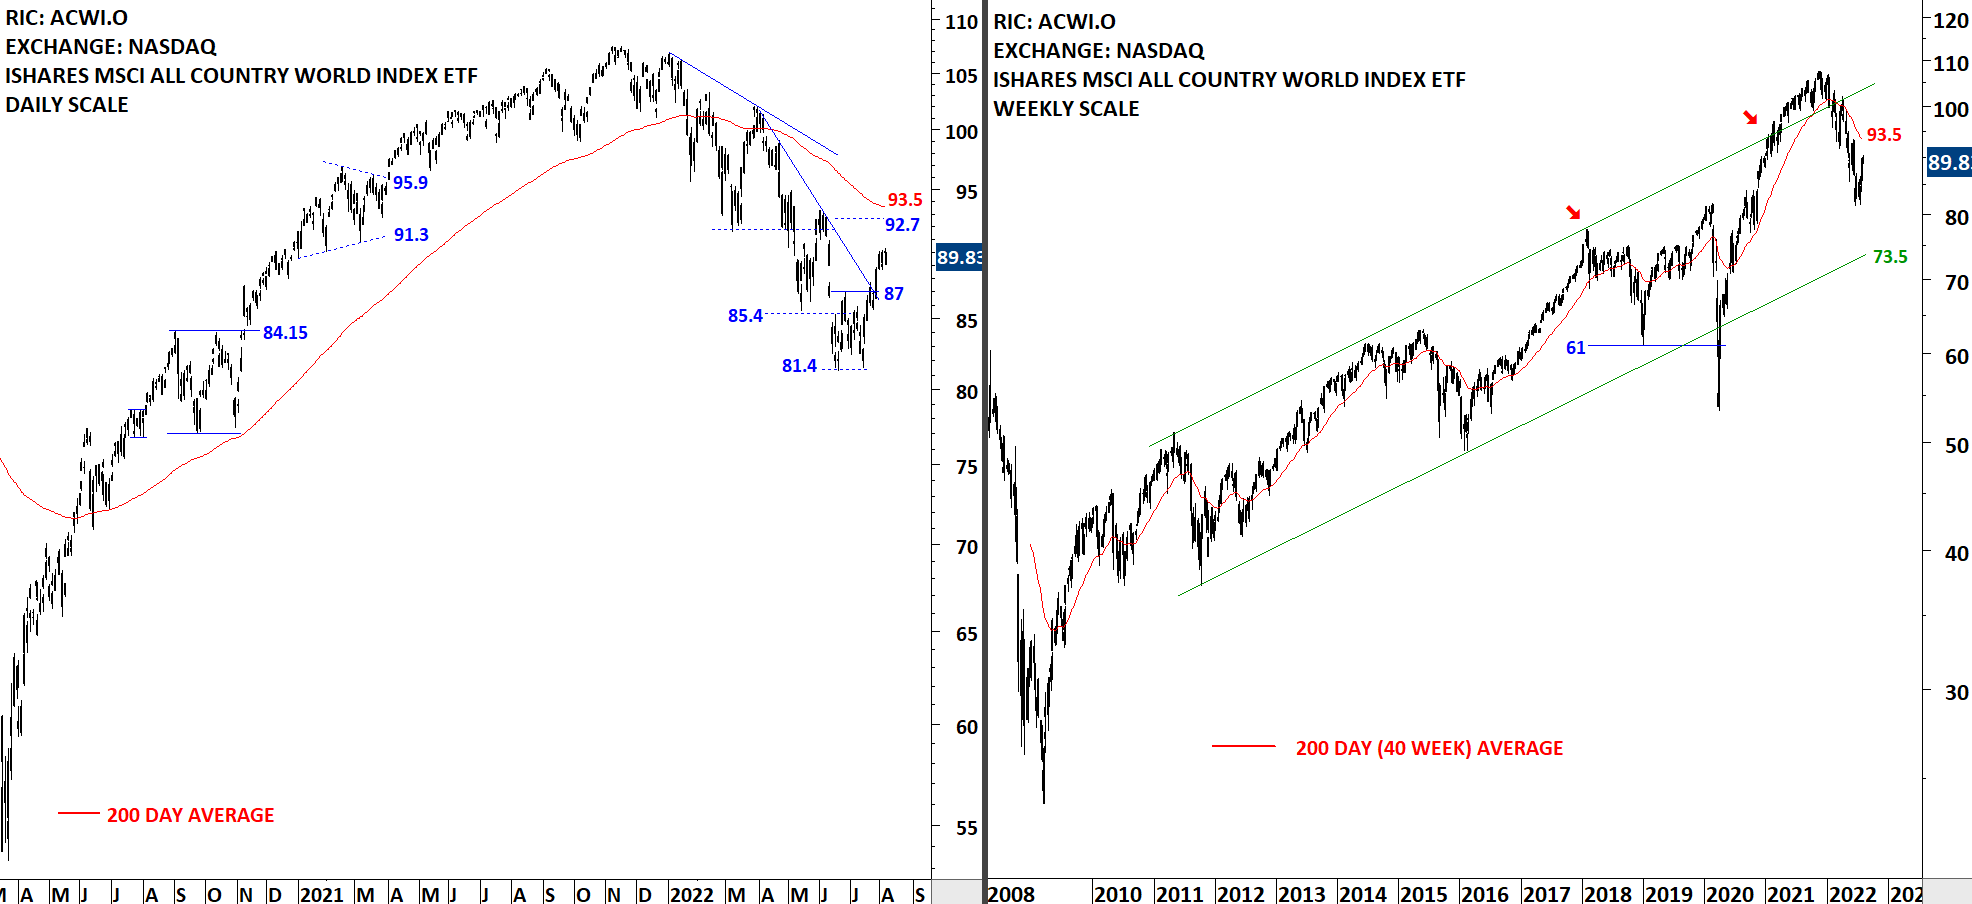
The benchmark for the Global equity markets performance, the iShares MSCI All Country World Index ETF (ACWI.O) remains below its 200-day average. Breakout above 87 levels completed a short-term double bottom and the ETF reached the price target of 92.7 levels. The 200-day average acted as resistance at 93.1 levels. The ETF failed to hold above the neckline at 87 levels. There is still the possibility of a H&S bottom reversal, though not with the symmetry between shoulders. Given the weakness below 87 levels, I view the H&S bottom as a lower probability. Price can test the previous low around 81.4 levels. Downtrend is intact below the 200-day average.