INTERIM UPDATE – November 12, 2025
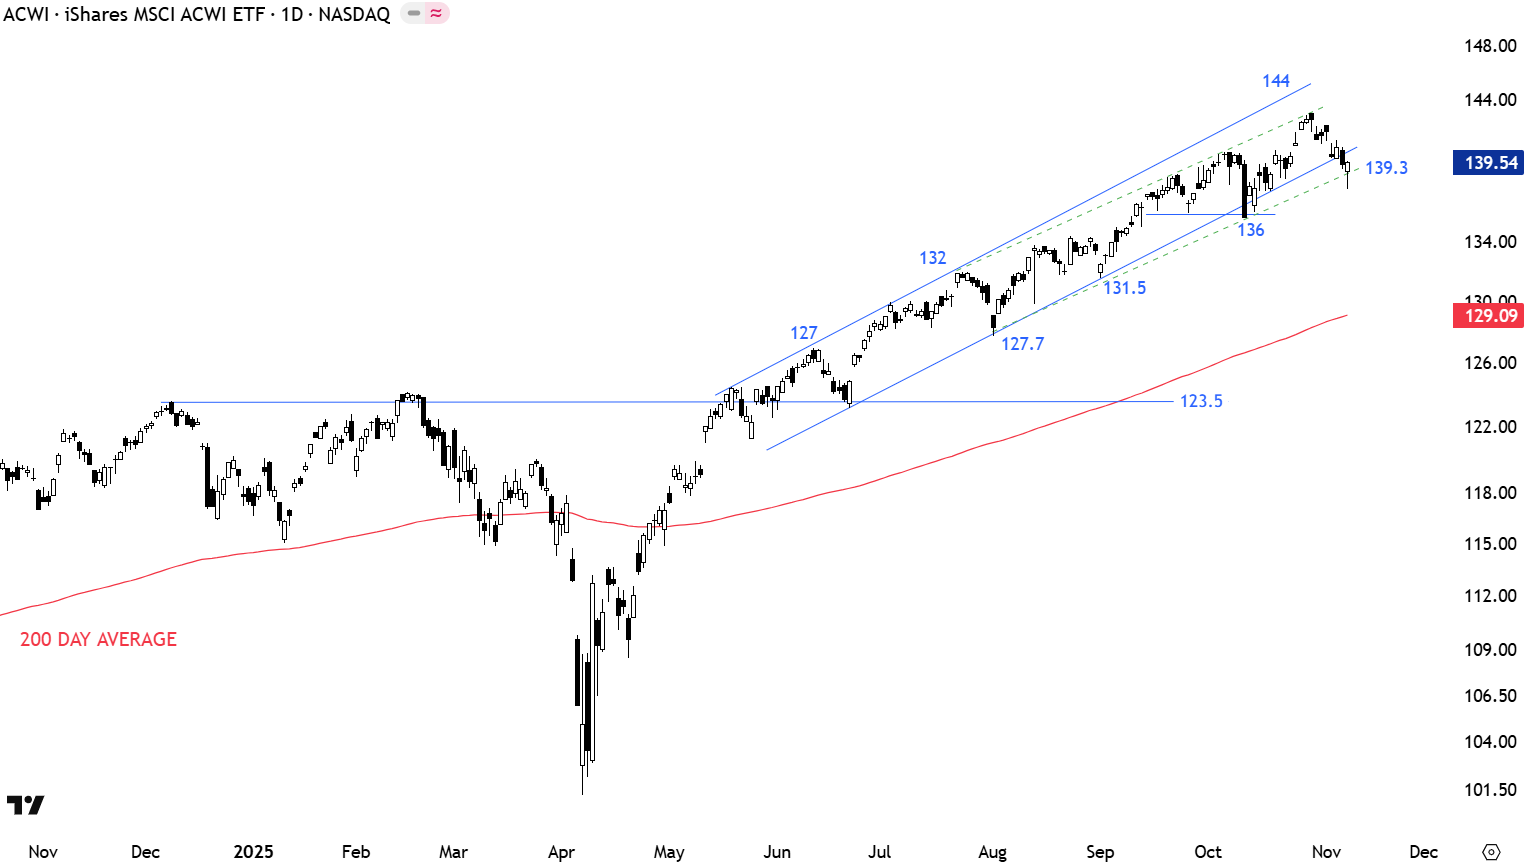
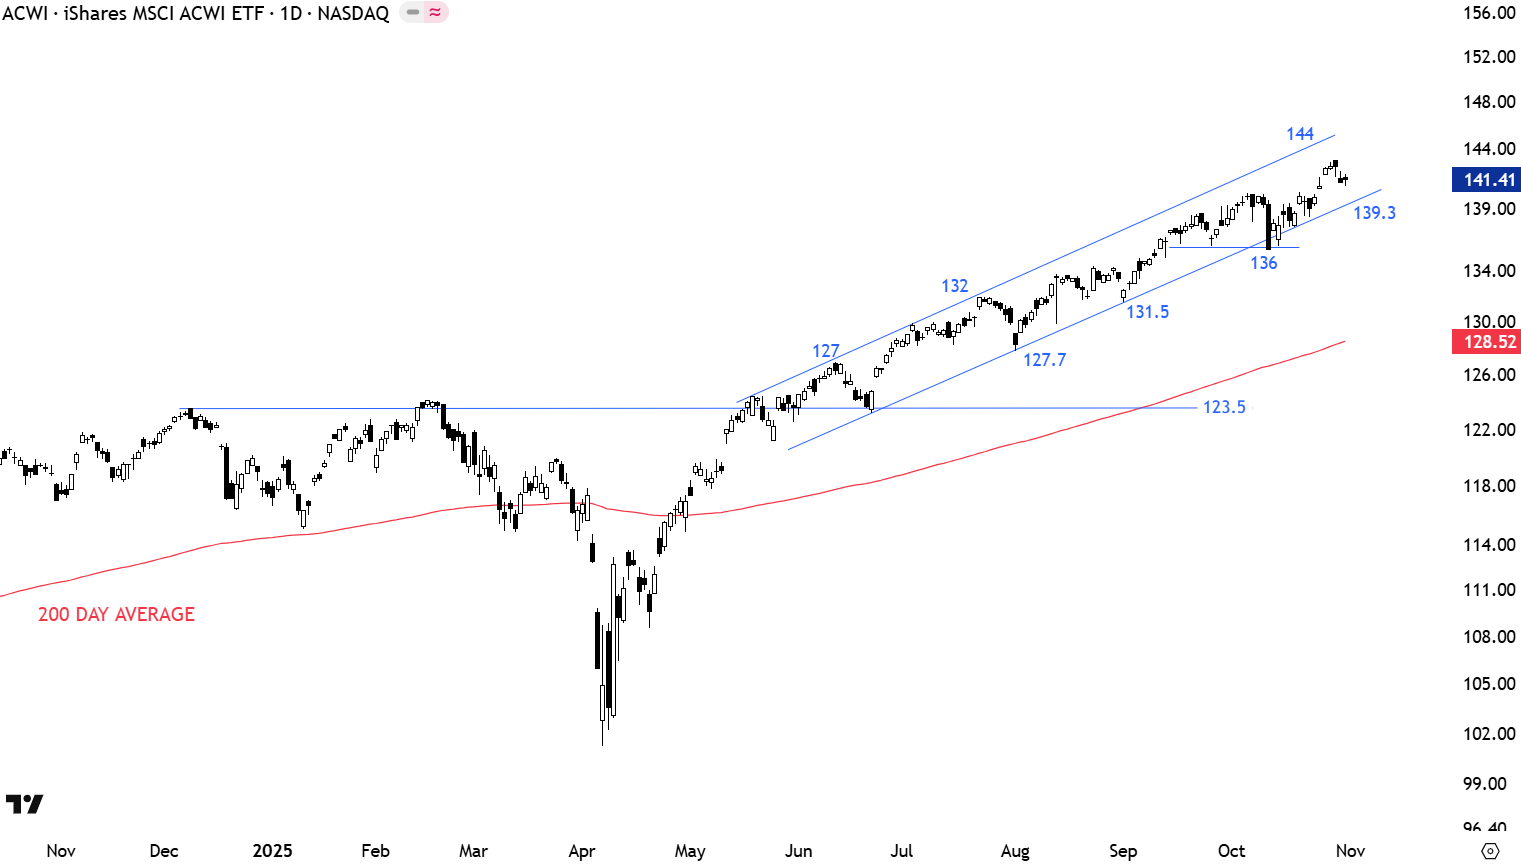
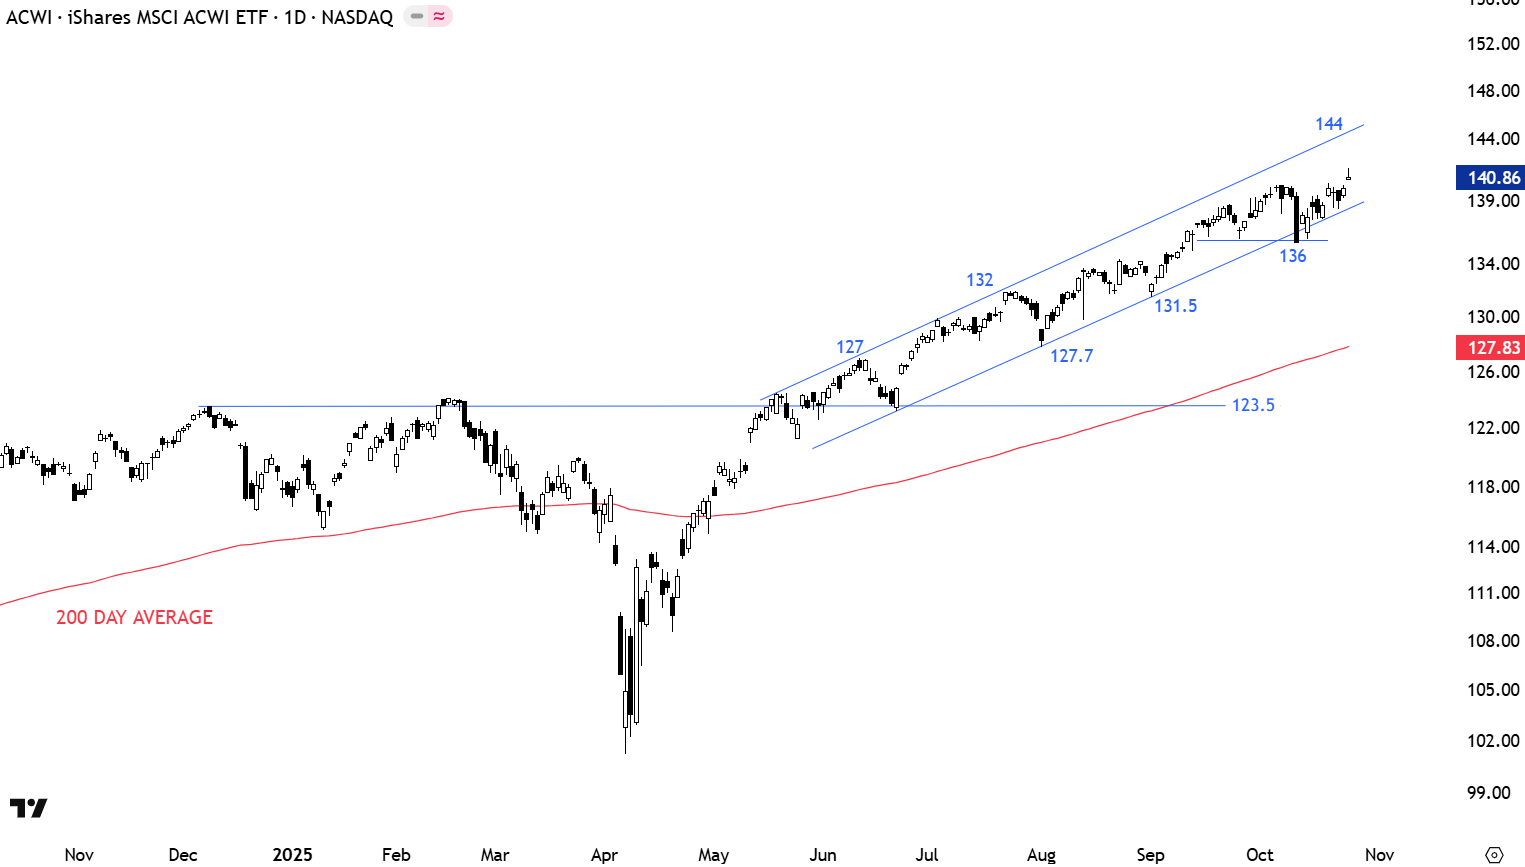
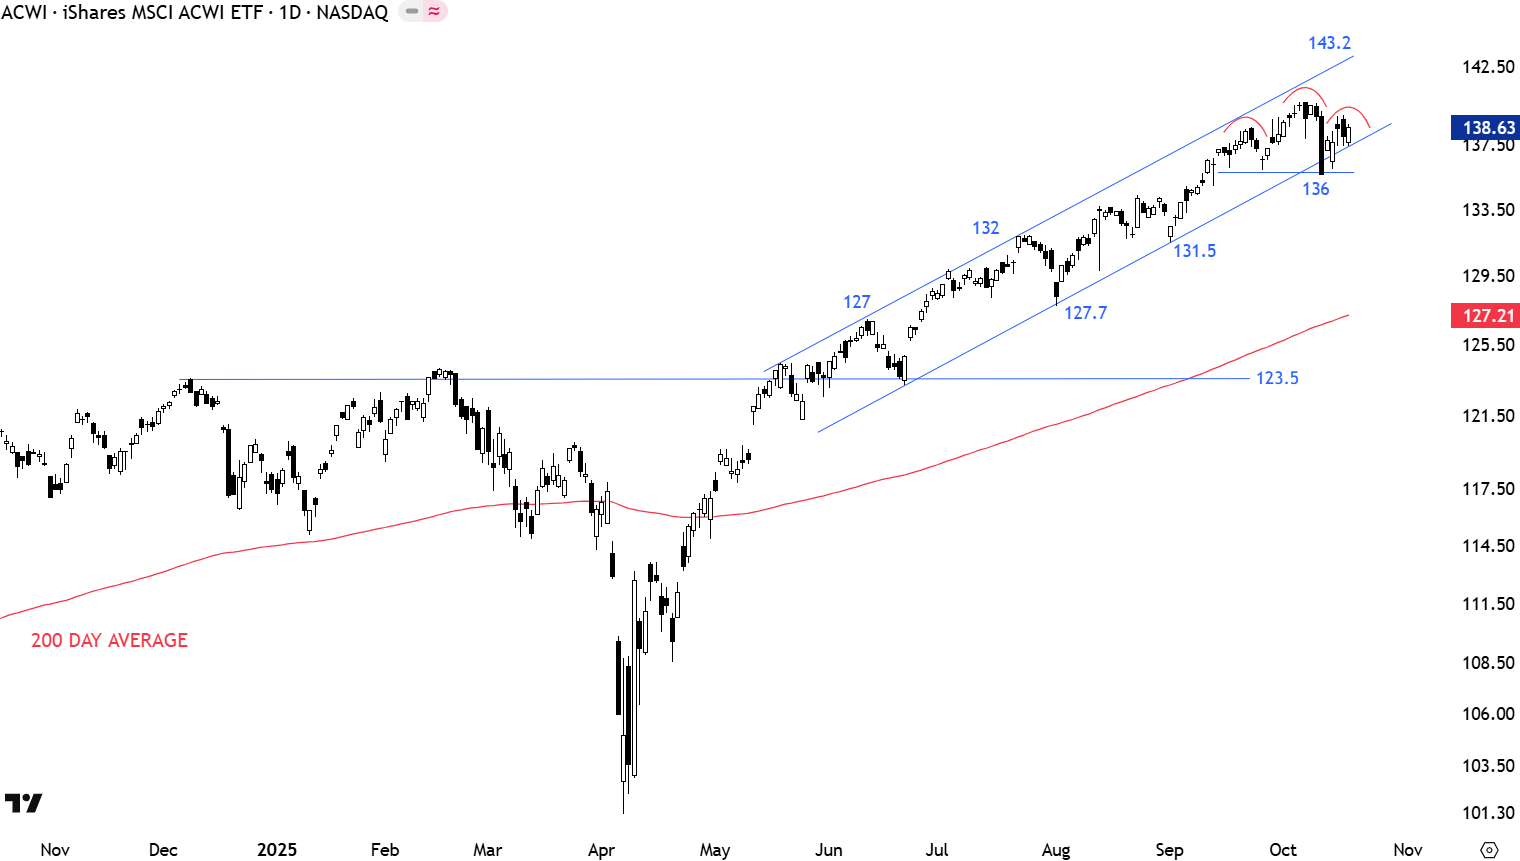
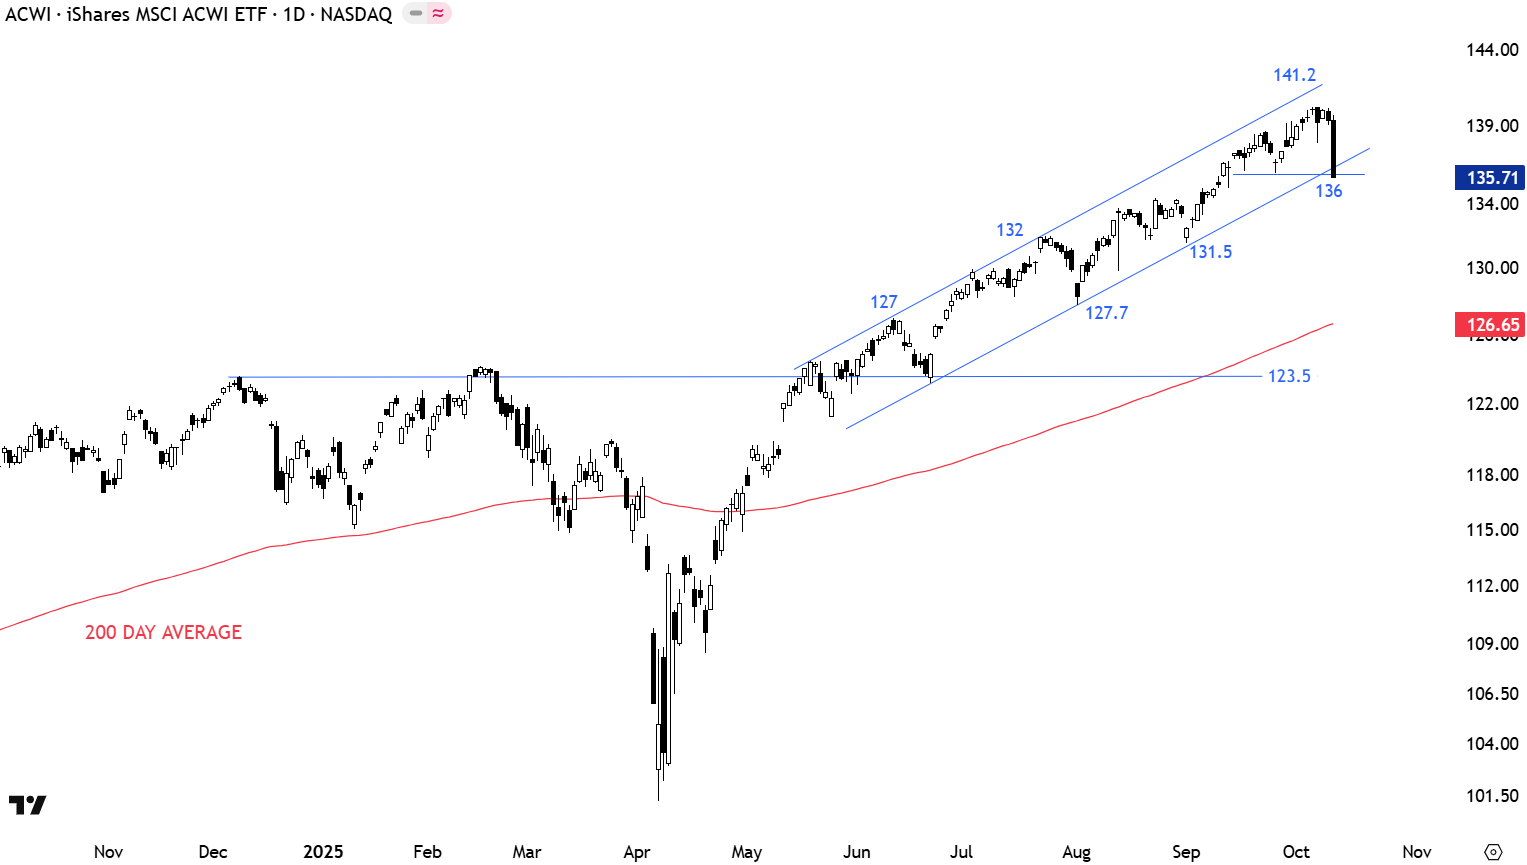
After reviewing several daily end of day charts and weekly charts from the weekend research these opportunities from Global Equities are worth bringing to your attention as they get closer to breakout levels and can confirm chart pattern setups mid-week. These charts will be discussed in the weekend report as well.