CRYPTOCURRENCIES – September 17, 2023
Bullish outlook on BTCUSD remains intact. Important support level at 25K level. ETHUSD chart is possibly morphing with not a clear chart pattern development at this stage.
Read More
Bullish outlook on BTCUSD remains intact. Important support level at 25K level. ETHUSD chart is possibly morphing with not a clear chart pattern development at this stage.
Read More
Dear Tech Charts Members,
Join Peter Brandt and Aksel Kibar as they answer the question - Is classical charting still valid?
Scheduled for: Wednesday, September 20, 2023, at 8:30 am mountain (register below)
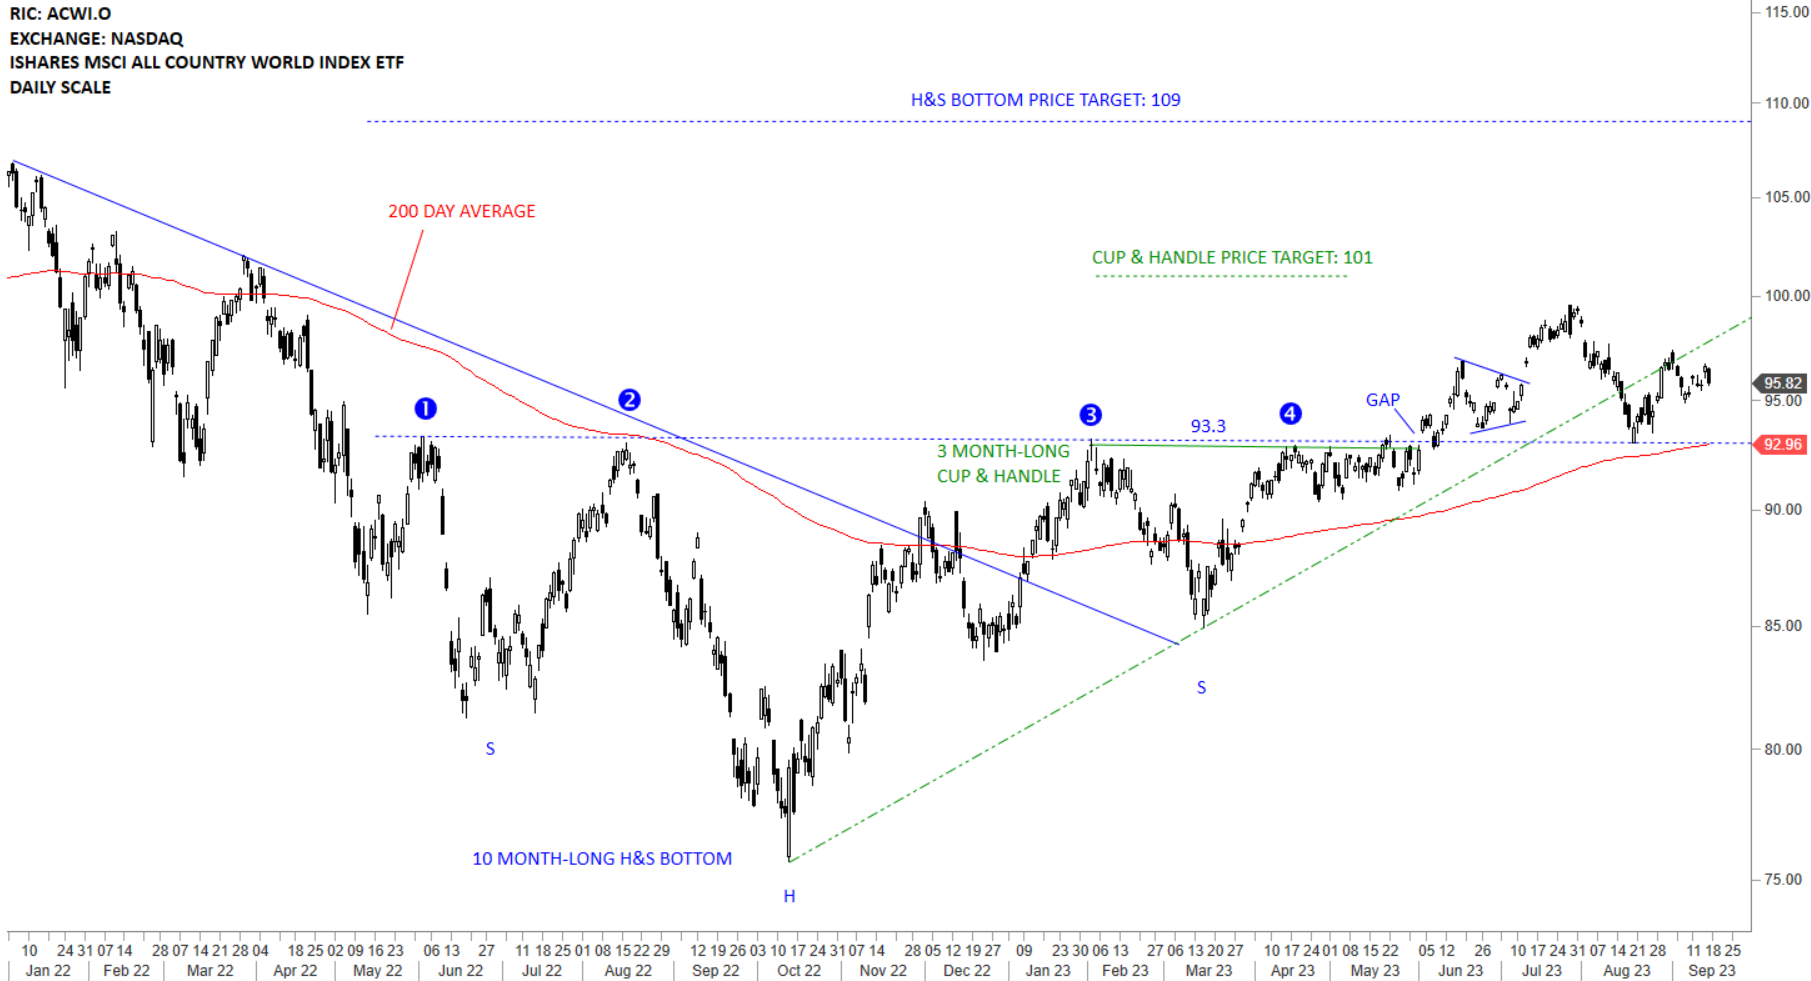
The benchmark for the Global equity markets performance, the iShares MSCI All Country World Index ETF (ACWI.O) broke out of its multi-month long consolidation. Price action so far looks like a reversion to the mean. Strong support area remains between the 200-day average, 92.96 and the horizontal boundary at 93.3 levels. Given that two important technical levels are overlapping around the same area, I see it as an inflection point. Failure to hold above the 200-day average can result in a change in trend. If the pullback (re-test of the horizontal support) has been completed the ETF can target cup & handle price target at 101 levels in the following weeks. Uptrend is intact above the 200-day average. Since the breakout in June, the ETF is trading sideways.
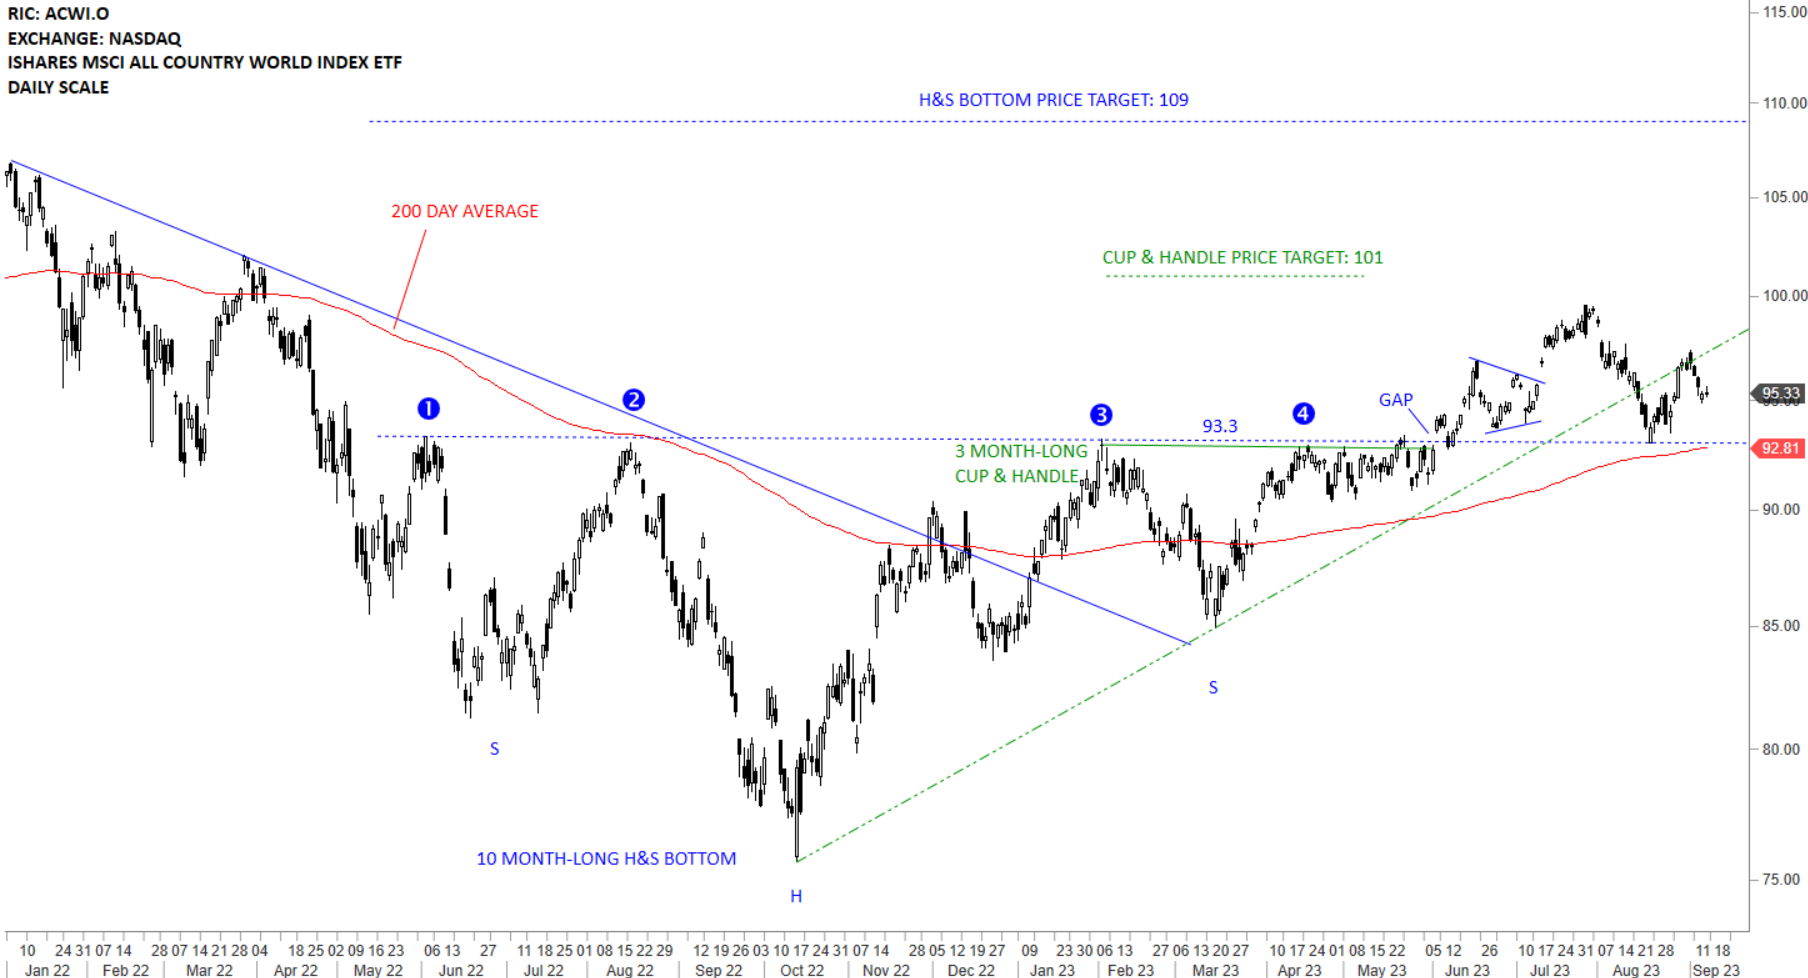
The benchmark for the Global equity markets performance, the iShares MSCI All Country World Index ETF (ACWI.O) broke out of its multi-month long consolidation. Price action so far looks like a reversion to the mean. Strong support area remains between the 200-day average, 92.81 and the horizontal boundary at 93.3 levels. Given that two important technical levels are overlapping around the same area, I see it as an inflection point. Failure to hold above the 200-day average can result in a change in trend. If the pullback (re-test of the horizontal support) has been completed the ETF can target cup & handle price target at 101 levels in the following weeks. Uptrend is intact above the 200-day average.
Every week Tech Charts Global Equity Markets report features some of the well-defined, mature classical chart patterns under a lengthy watchlist and the chart pattern breakout signals that took place during that week. Global Equity Markets report covers single stocks from developed, emerging and frontier markets, ETF’s, select commodities, cryptocurrencies and global equity indices. Below charts, U.S. Dollar Index (DXY) is from the review section of the weekly report. It is featuring possible strength for the Dollar Index.
Bullish outlook on BTCUSD remains intact. Important support level at 25K level. ETHUSD chart is possibly morphing with not a clear chart pattern development at this stage.
Read More
Tech Charts members, please mark your calendar as we are excited and preparing for the quarterly member webinar. We will share the webinar link in the following weeks. It will be my pleasure to have the joint webinar with Peter Brandt discussing many topics in charting, statistics and more.

The benchmark for the Global equity markets performance, the iShares MSCI All Country World Index ETF (ACWI.O) broke out of its multi-month long consolidation. In its uptrend the ETF formed several bullish continuation chart patterns with the latest one being the short-term bullish pennant. Price action so far looks like a reversion to the mean. Strong support area remains between the 200-day average, 92.7 and the horizontal boundary at 93.3 levels. Given that two important technical levels are overlapping around the same area, I see it as an inflection point. Failure to hold above the 200-day average can result in a change in trend. If the pullback (re-test of the horizontal support) has been completed the ETF can target cup & handle price target at 101 levels in the following weeks. Uptrend is intact above the 200-day average.

Every week Tech Charts Global Equity Markets report features some of the well-defined, mature classical chart patterns under a lengthy watchlist and the chart pattern breakout signals that took place during that week. Global Equity Markets report covers single stocks from developed, emerging and frontier markets, ETF’s, select commodities, cryptocurrencies and global equity indices. Below chart, Array Technologies, Inc. is from the review section of the weekly report. It is featuring a possible developing head and shoulder reversal chart pattern.
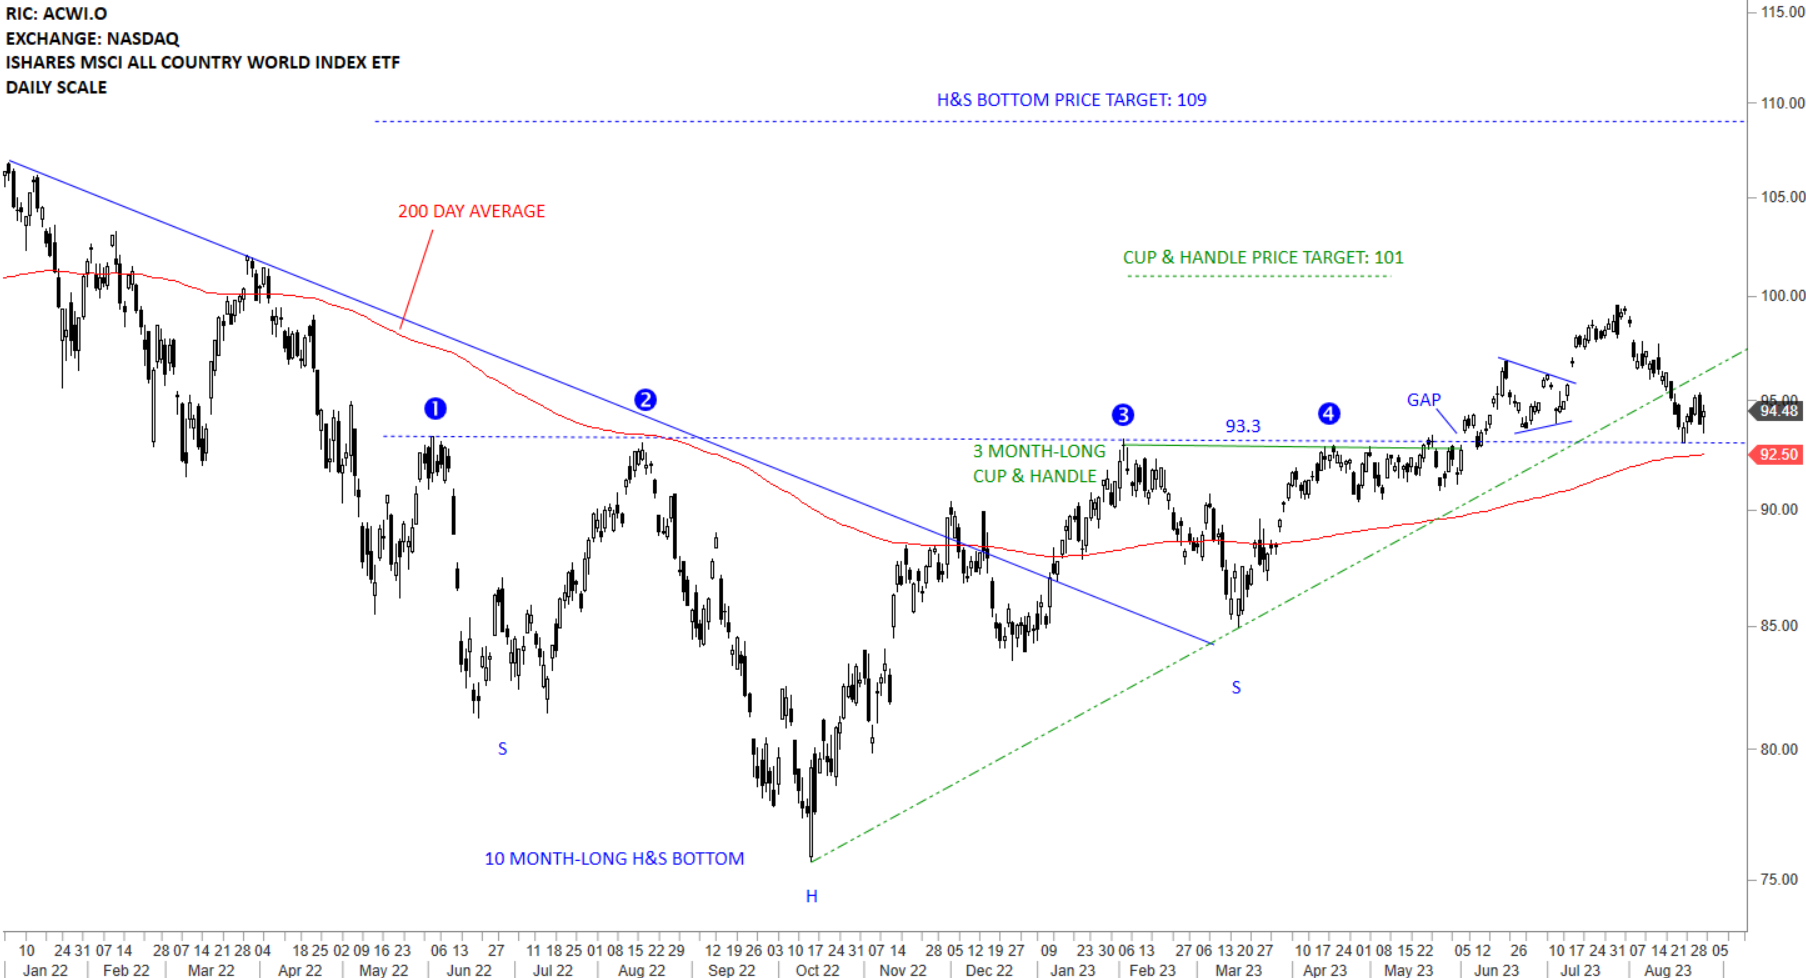
The benchmark for the Global equity markets performance, the iShares MSCI All Country World Index ETF (ACWI.O) broke out of its multi-month long consolidation. In its uptrend the ETF formed several bullish continuation chart patterns with the latest one being the short-term bullish pennant. Breakdown below the trend line support resulted in a pullback towards the next support at 93.3 levels. Price action so far looks like a reversion to the mean. Strong support area remains between the 200-day average, 92.5 and the horizontal boundary at 93.3 levels. Given that two important technical levels are overlapping around the same area, I see it as an inflection point. Failure to hold above the 200-day average can result in a change in trend.
Breakdowns on BTC and ETH result in pullbacks to important technical support levels. Bullish outlook on BTCUSD remains intact. ETHUSD chart is possibly morphing with not a clear chart pattern development at this stage.
Read More

