CRYPTOCURRENCIES – May 26, 2024
BTCUSD is consolidating earlier gains below the strong resistance area between 65K – 68K. Breakout above the upper boundary of a rising trend channel started a runaway price movement towards the resistance area. 60K continues to be an important support and an inflection point. ETHUSD had a sharp rebound from 2,800 levels and kept the uptrend intact. ETHBTC chart rebounded from strong support area. Monitoring the pair for the month of May close. A strong close at current levels can reinitiate the trading range between 0.05 and 0.08 levels.
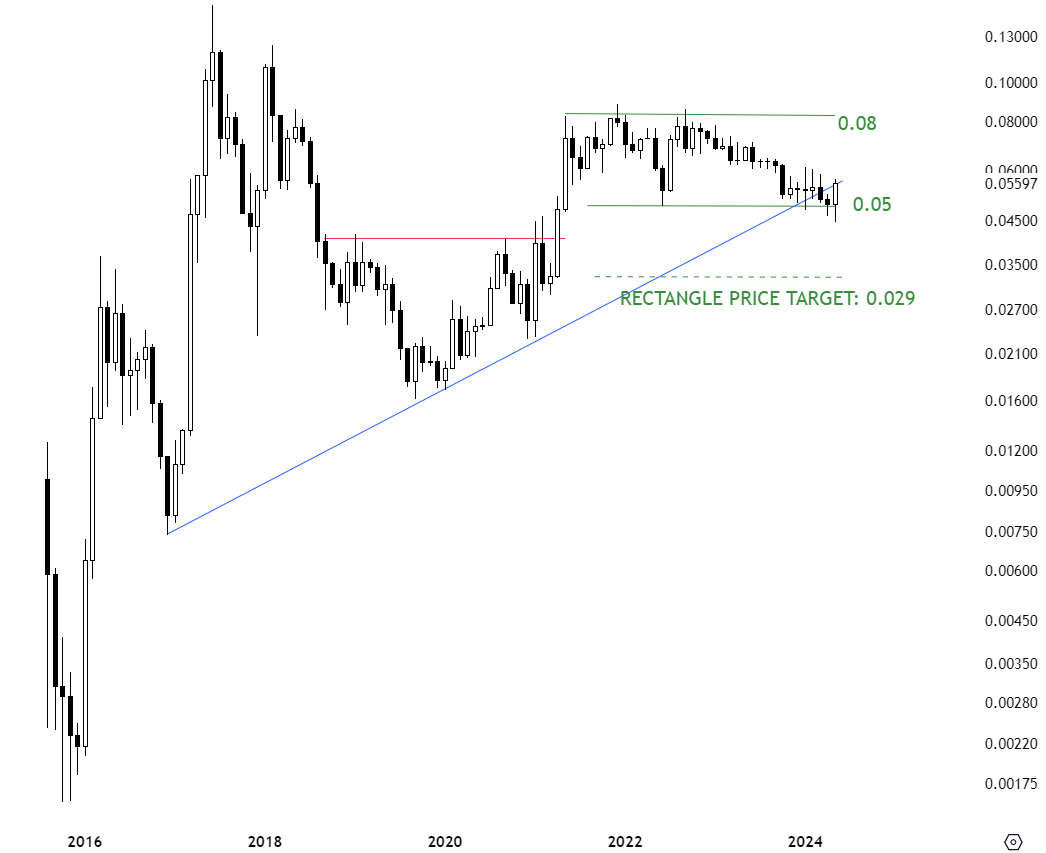
ETHBTC
The monthly scale chart of ETHBTC is at a critical support. I don’t usually depend on breakout/breakdown signals through diagonal boundaries. Though, a trend line that has several touch points could be valid and recognized by market participants as a level that can change the demand/supply relationship. The trendline and the horizontal support are overlapping around 0.05 levels. Breakdown below 0.05 levels can reverse the existing uptrend and can result in a massive underperformance for ETH vs BTC. Possible price target for the rectangle stands at 0.029 levels. Given that this is a monthly scale price chart, I will monitor it for an end of month close below 0.05 levels. An ideal breakdown signal should come with a long black candle. A sharp recovery from current support area can result in continuation of the wide trading range between 0.05 and 0.08 levels. If the monthly candle closes at current levels this will be a considered a sharp reversal, with a possible bear trap on daily/weekly charts. In such situation the price will reclaim the support and continue to consolidate between 0.05 and 0.08 levels.
BTCUSD
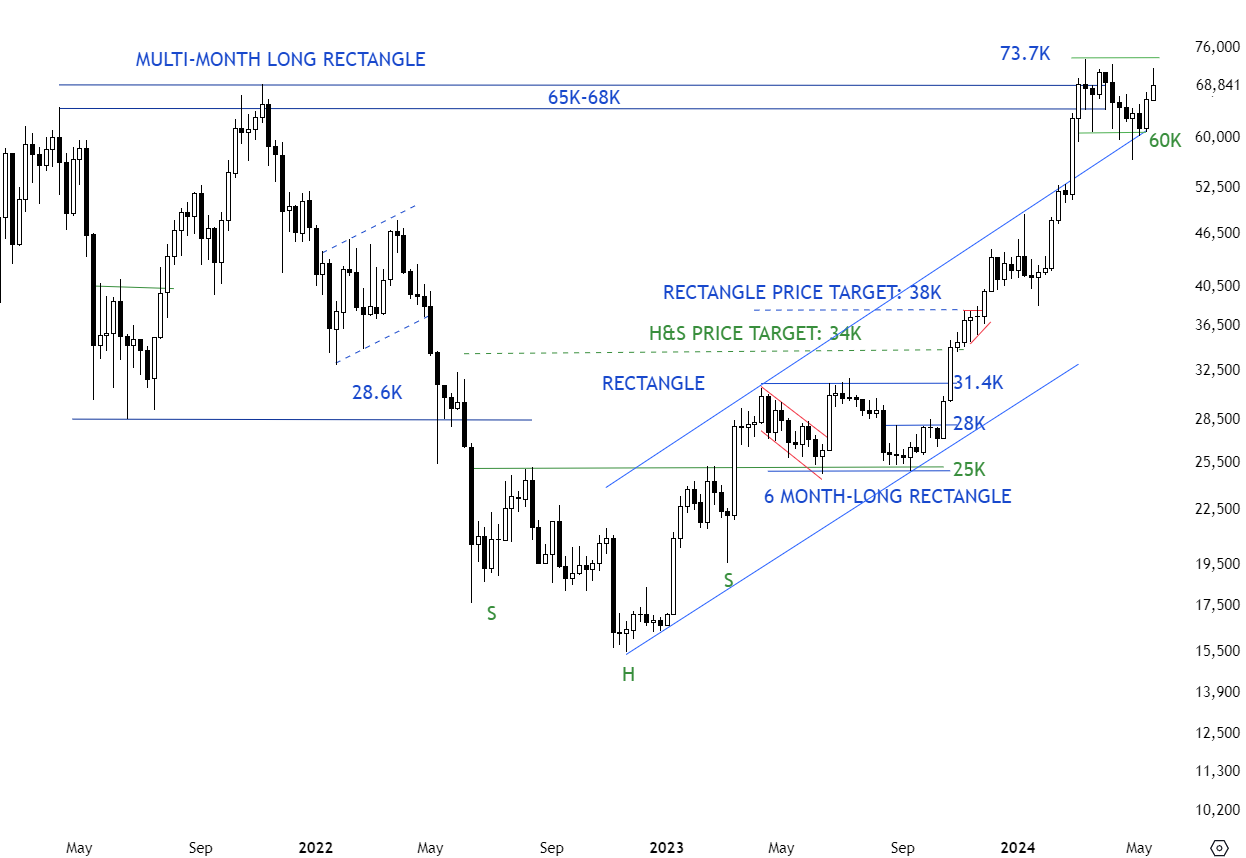
BTCUSD reached the strong resistance area between 65K-68K. It seems like the upper boundary acted as resistance and was recognized by market participants. The uptrend is intact. Breakout above the upper boundary of a rising trend channel is usually followed by strong uptrend. A short consolidation right below the resistance area 65K-68K and above the upper boundary of a rising trend channel at 58.5K is positive and suggests pending breakout to all-time highs. So far price managed to hold onto the gains. The minor low is at 60K and so far acted as short-term support. Further consolidation between 60K and 73.7K can form a possible rectangle chart pattern. Failure to hold above the upper boundary of the trend channel can result in a larger scale correction towards 52K levels. The only bearish possibility is the formation of a double top with the re-test of 70K levels.
ETHUSD
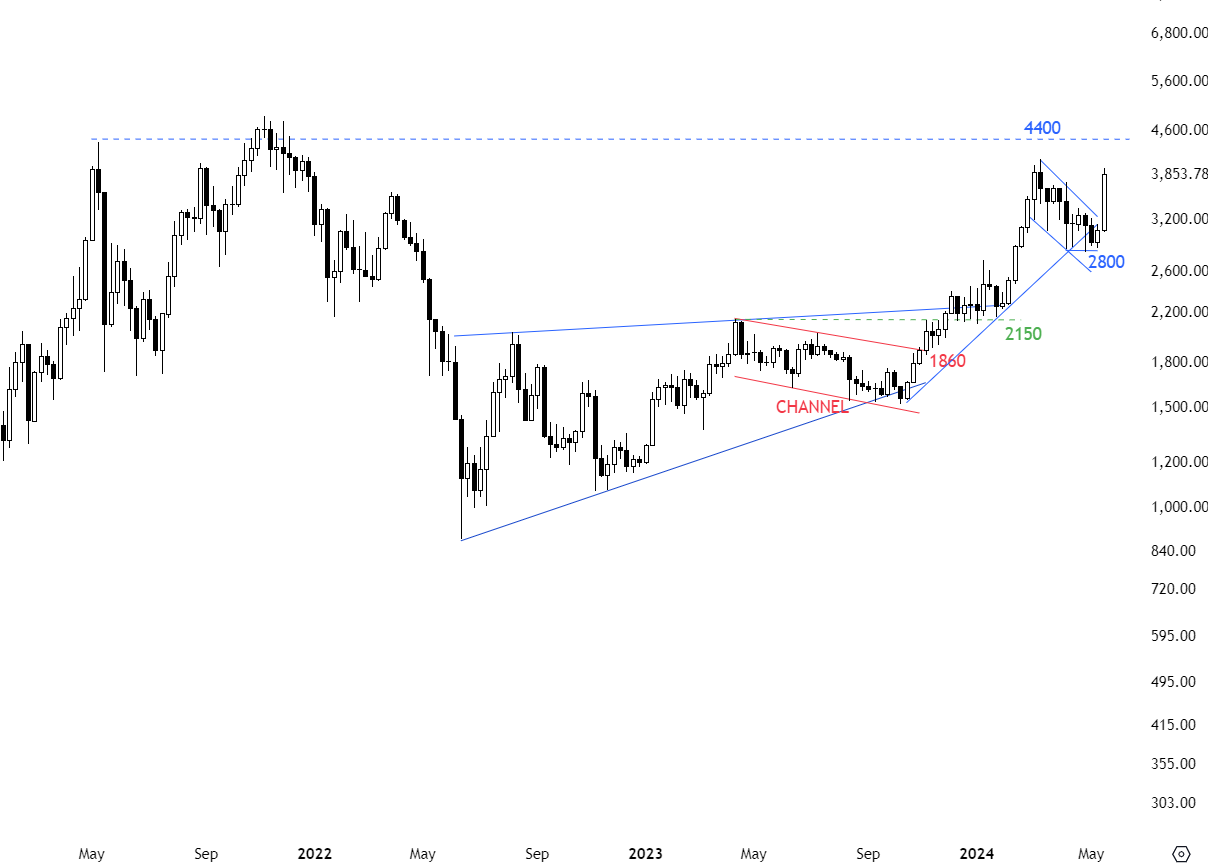
Long-term resistance stands at 4,400 levels. Uptrend is intact. The possible upward trend line acted as support at 2,800 levels. Minor lows also held around 2,800 levels and ETHUSD had a sharp rebound. I will start thinking bullish setups after price clears the horizontal resistance at 4,400 levels.
ALPHAUS
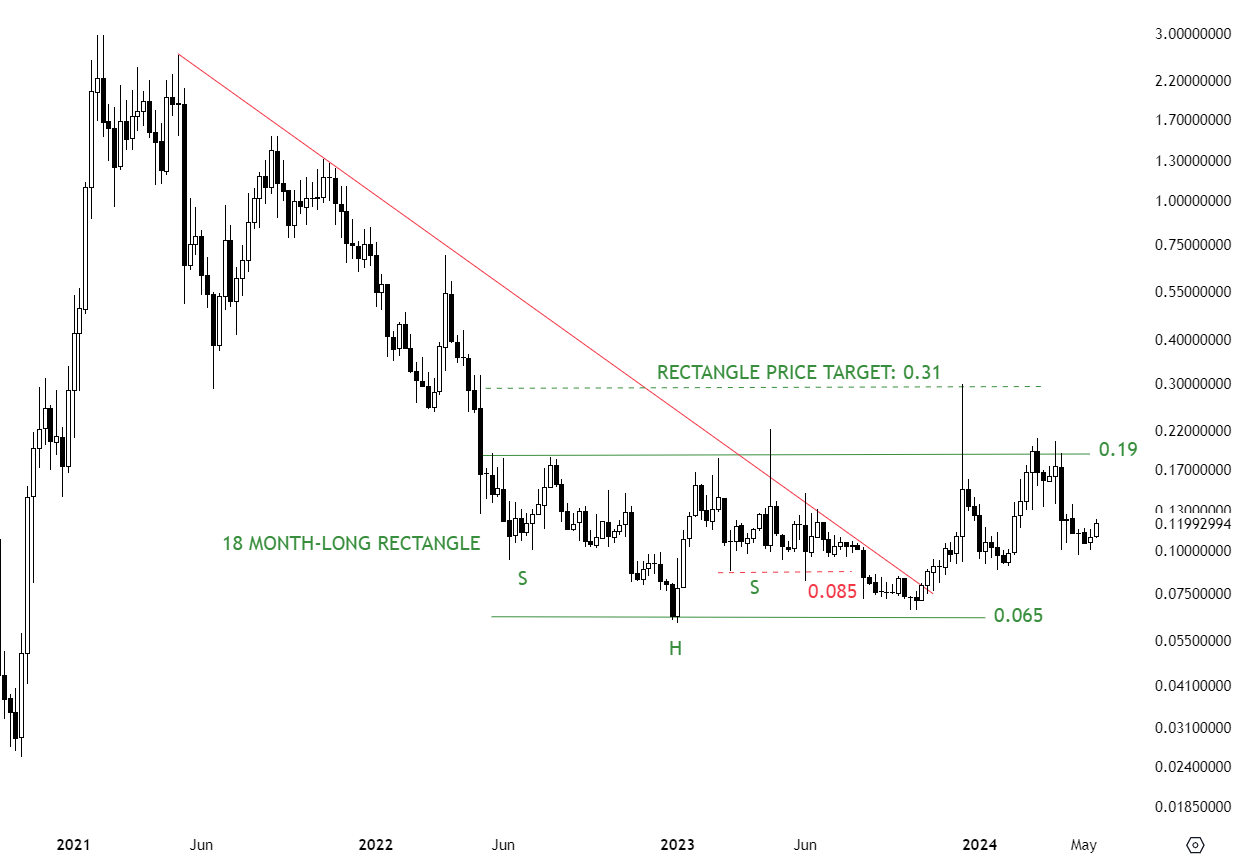
ALPHAUS chart pattern is morphing possibly into a rectangle. Initially the H&S bottom failure resulted in a move towards the minor low at 0.065. The low acted as support not allowing the price to reach the H&S bottom failure price target. Sharp recovery from support at 0.065 levels reached the horizontal resistance at 0.19 levels which can be the upper boundary of a rectangle. Breakout above 0.19 levels can confirm the rectangle as a bottom reversal with the price target of 0.31 levels. Until there is a breakout, wide consolidation remains between 0.065 and 0.19 levels.
CELRUSD
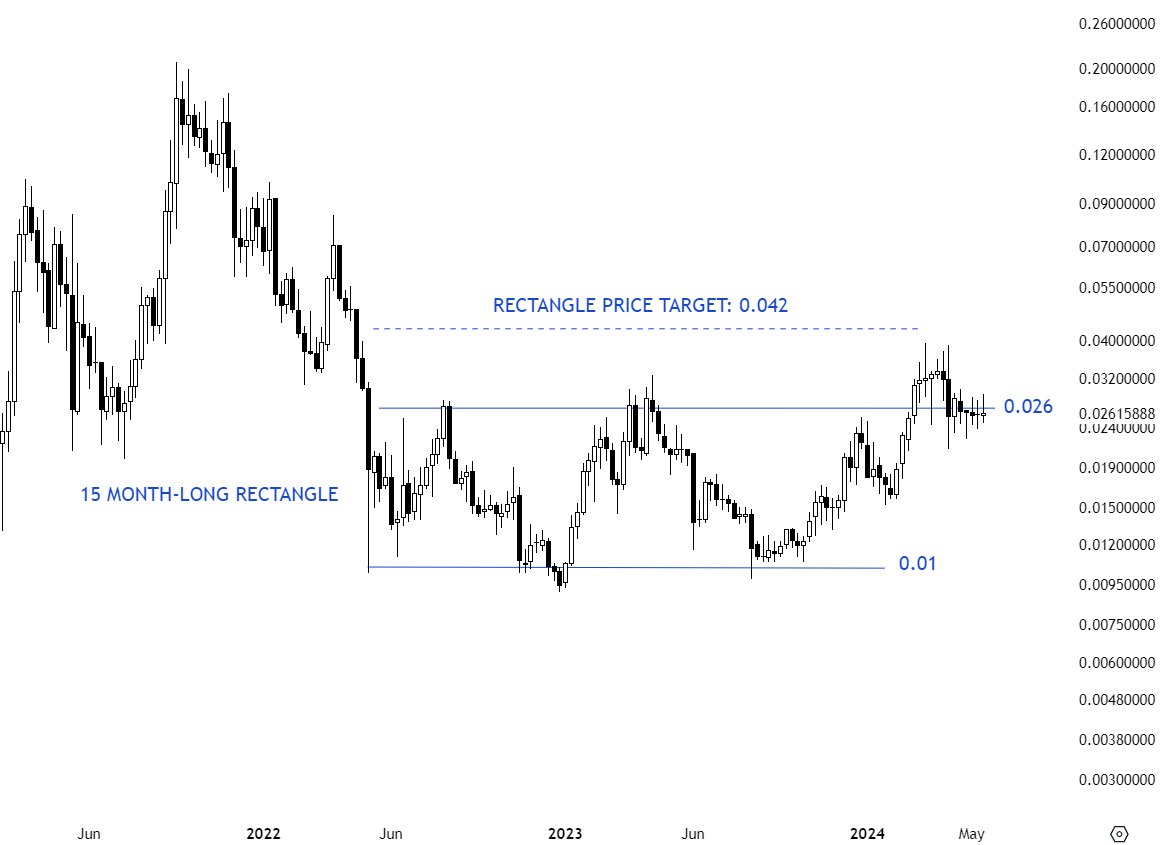
CELRUSD is a pair with a well-defined rectangle chart pattern. The pair completed a 15 month-long rectangle chart pattern with the breakout above 0.026 levels. Rectangle is possibly acting as a bottom reversal. Possible price target stands at 0.042 levels. Previous resistance at 0.026 levels becomes the new support. Price is trying to hold above the horizontal support. A quick recovery above 0.026 levels in the following week can put the price in bullish territory with the pattern price objective at 0.042 levels. Failure to hold the horizontal support can result in a correction towards the lower boundary of the rectangle at 0.01 levels.
NEOUSD
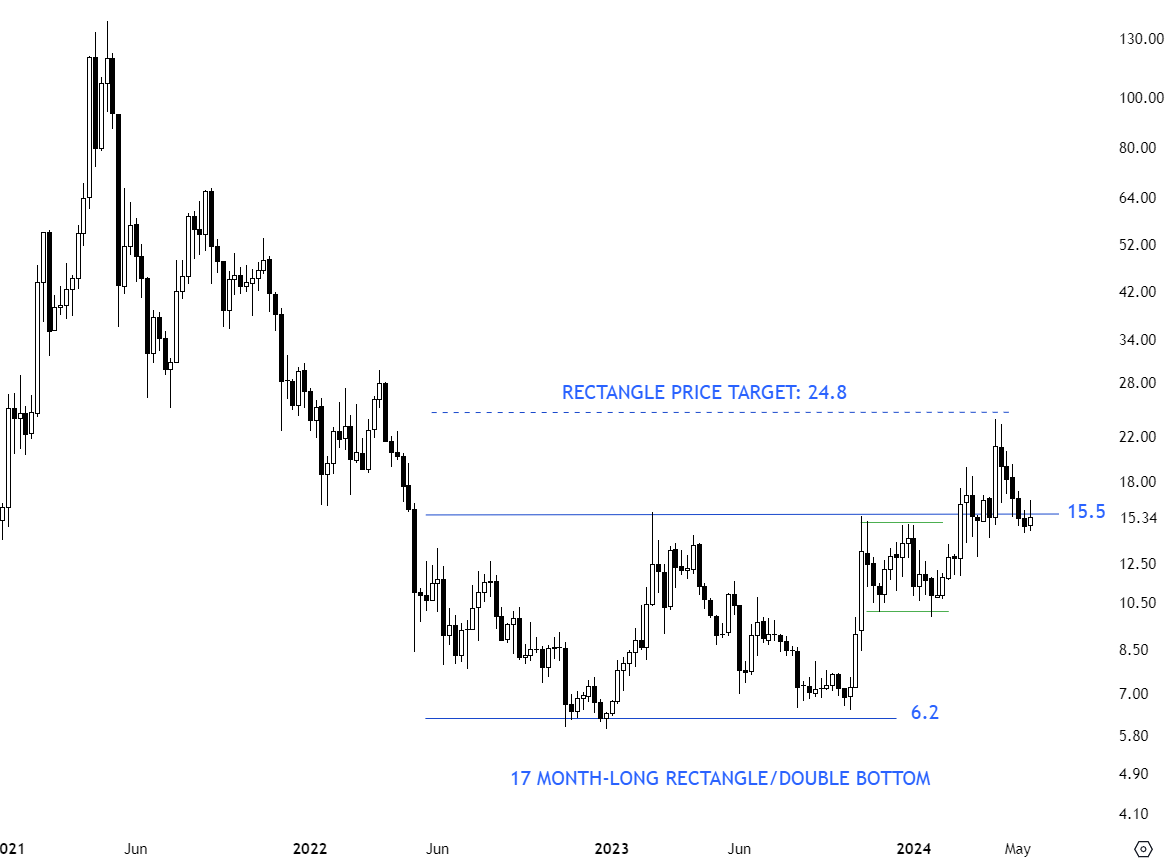
NEOUSD completed a 17 month-long double bottom with the neckline acting as resistance at 15.5 levels. Breakout above the neckline at 15.5 levels confirmed the bottom reversal with the price target of 24.8 levels. The short consolidation below the horizontal resistance at 15.5 possibly acted as a launching pattern. Last few week’s weakness pulled the price towards the horizontal support. Failure to hold above the support can result in a larger scale correction towards 10 levels.
PIVXUSD
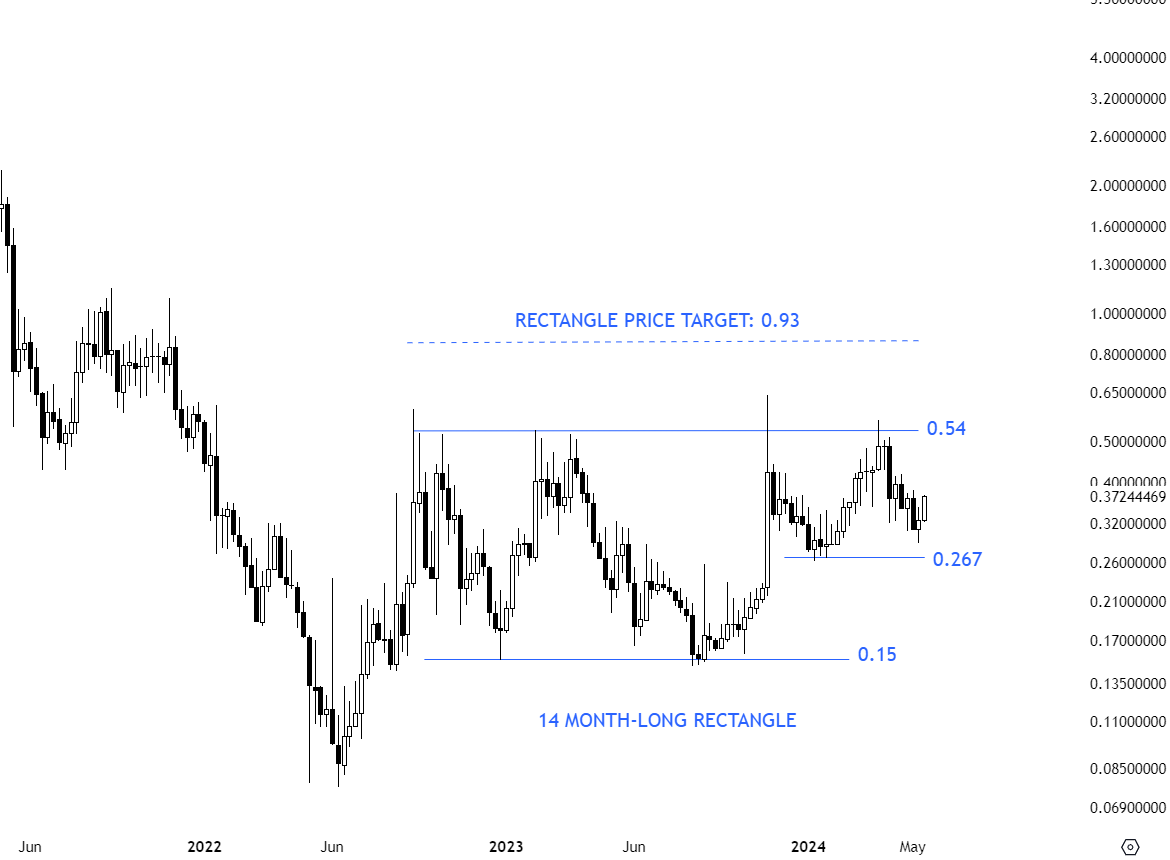
PIVXUSD might be forming a 14 month-long rectangle chart pattern with the upper boundary acting as a resistance at 0.54 levels. The upper boundary has been tested several times and it is well-defined. Breakout can complete the chart pattern as a bullish continuation with the price target of 0.93 levels. The more tests of the pattern boundary the better it is for the possible breakout that can take place in the following months. For now, the pair offers a trading opportunity between well-defined horizontal boundaries. Recent pullback tested the short-term support around 0.267 levels. A shorter-term rectangle is forming between 0.267 ad 0.54 levels.
QTUMUSD
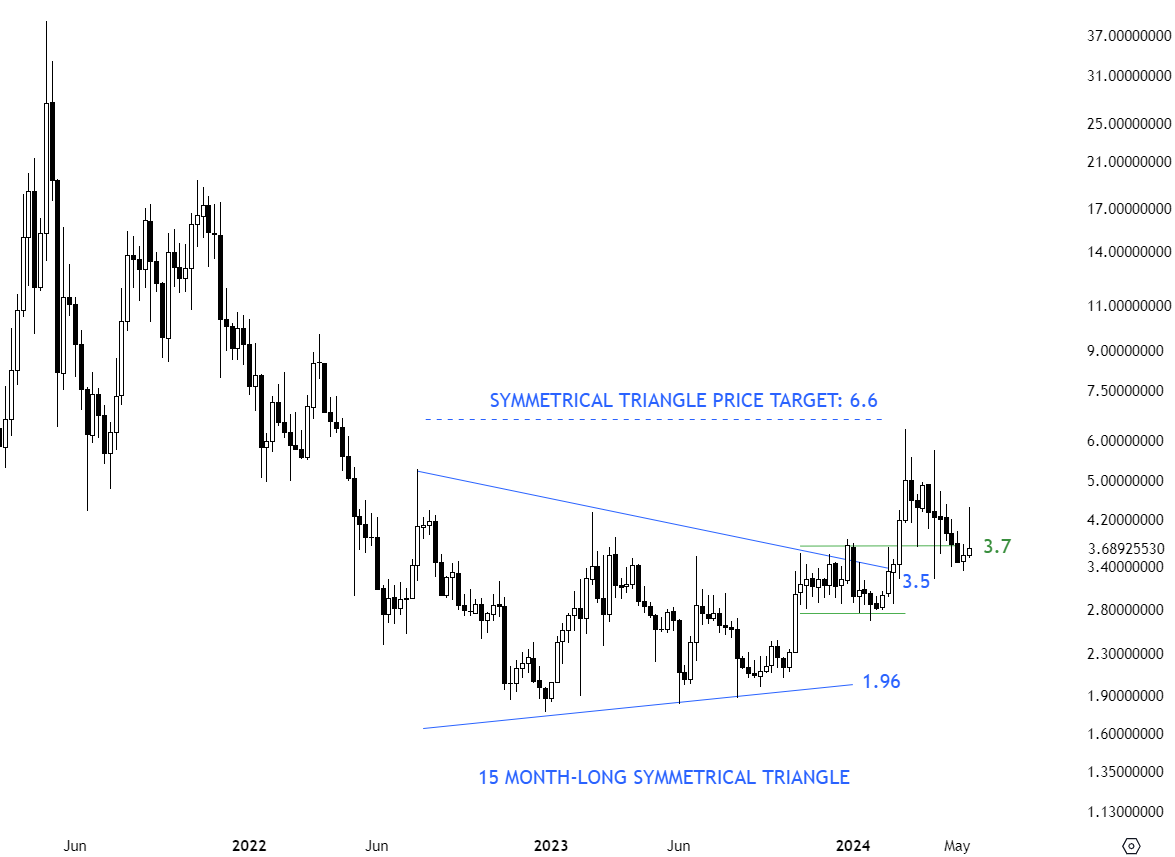
A 15 month-long symmetrical triangle is possibly acting as a bottom reversal on QTUMUSD. The upper boundary has been strong resistance at 3.5 levels after several tests. Breakout above 3.5 levels completed the symmetrical triangle as a reversal with the price target of 6.6 levels. Prior to the breakout, the pair also formed a rectangle that acted as a launching pattern. 3.5 levels becomes the new support. Uptrend is intact. During the increased volatility, price managed to hold above support area. 3.5-3.7 area acts as support.
BNBUSD
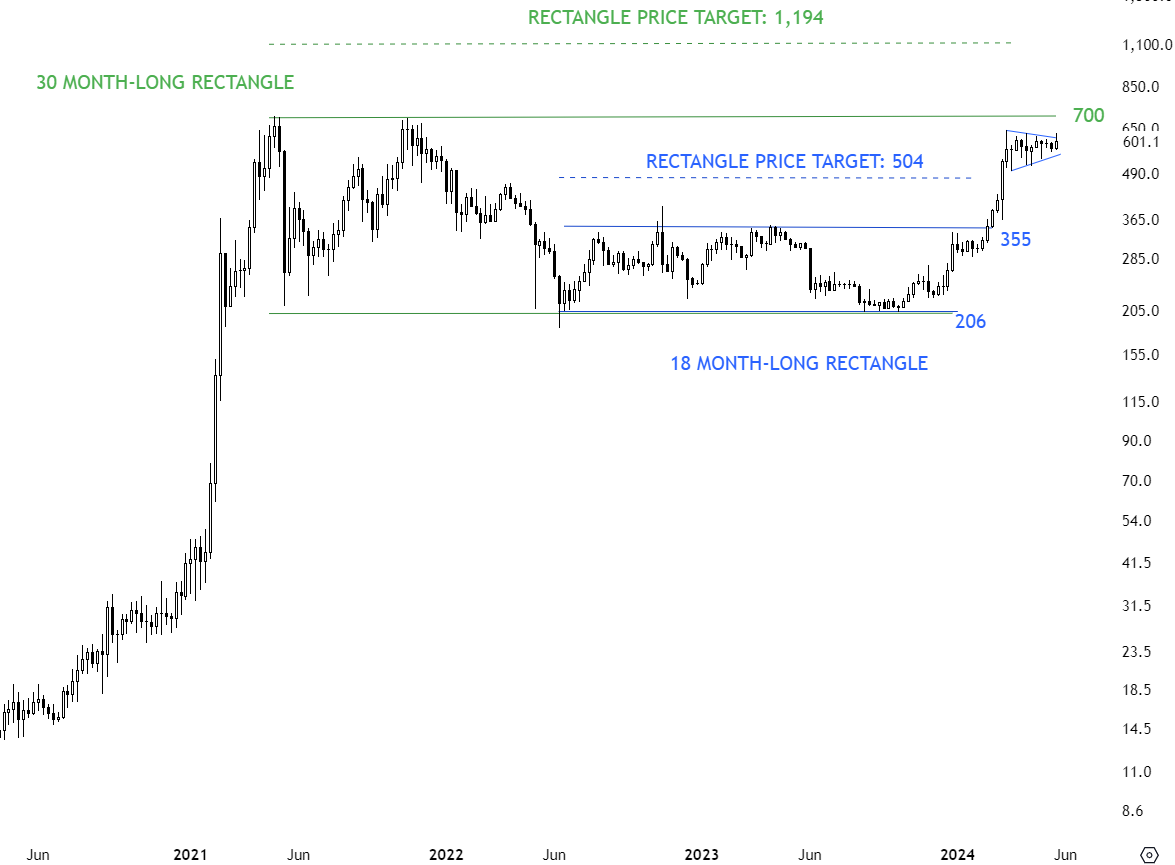
BNBUSD completed an 18 month-long rectangle with the upper boundary acting as resistance at 355 levels. Breakout pushed the price towards the rectangle price target at 504 levels. There is a larger scale rectangle pattern between 206 and 700 levels. This is a well-defined consolidation. Both boundaries are recognized by market participants. It is important to have boundaries that are not violated by spikes, it shows that market recognized those levels and buyers and sellers acted around the horizontal lines. Previous resistance at 355 levels becomes the new support. Breakout above 700 levels will be a long-term bullish signal and target 1,194 levels. BNBUSD is another pair that held well during the increased market volatility. Instruments that hold well during increased market volatility will be the first ones to breakout to new highs. Last few week’s tight consolidation possibly formed a symmetrical triangle that can resume the existing uptrend.
MDXUSD
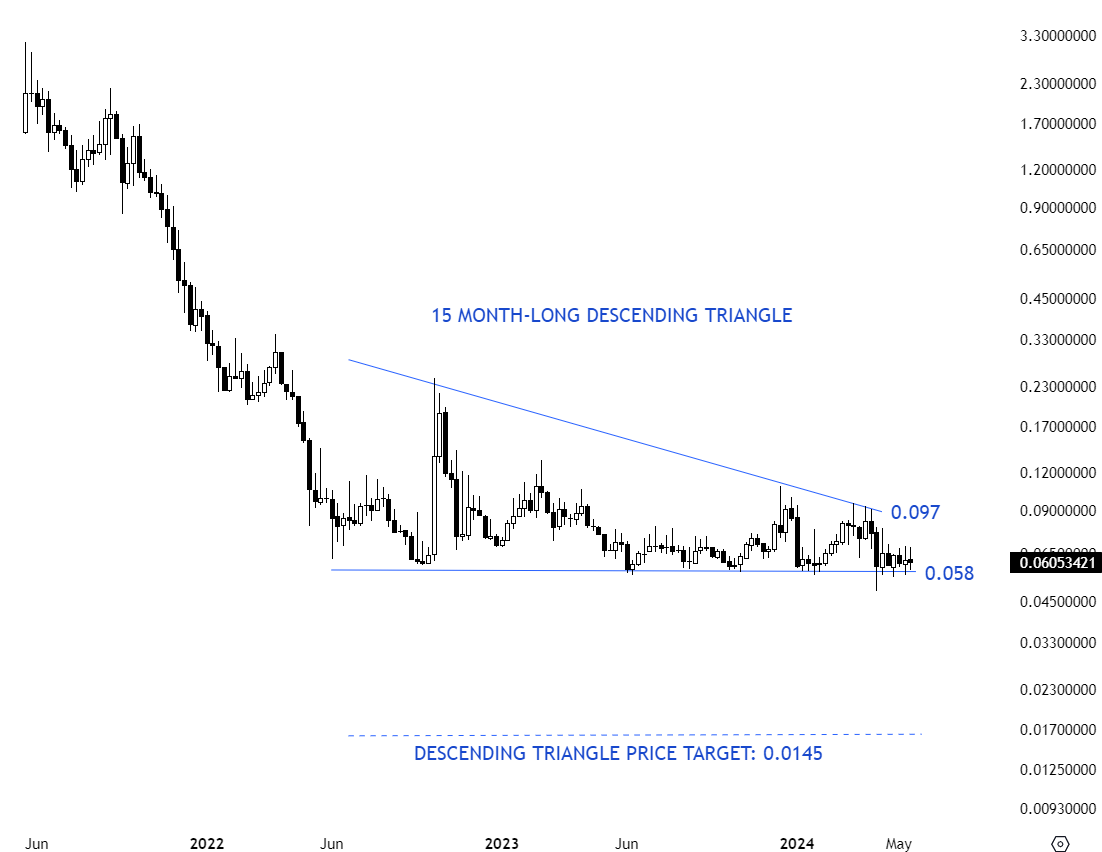
MDXUSD is another pair with a well-defined horizontal support and a long-term bearish chart pattern that can be identified as a descending triangle. Breakdown below 0.058 levels can confirm the descending triangle with the price target of 0.0145 levels. The longer price remains at the support the higher the chances of a strong breakdown.
FILUSD
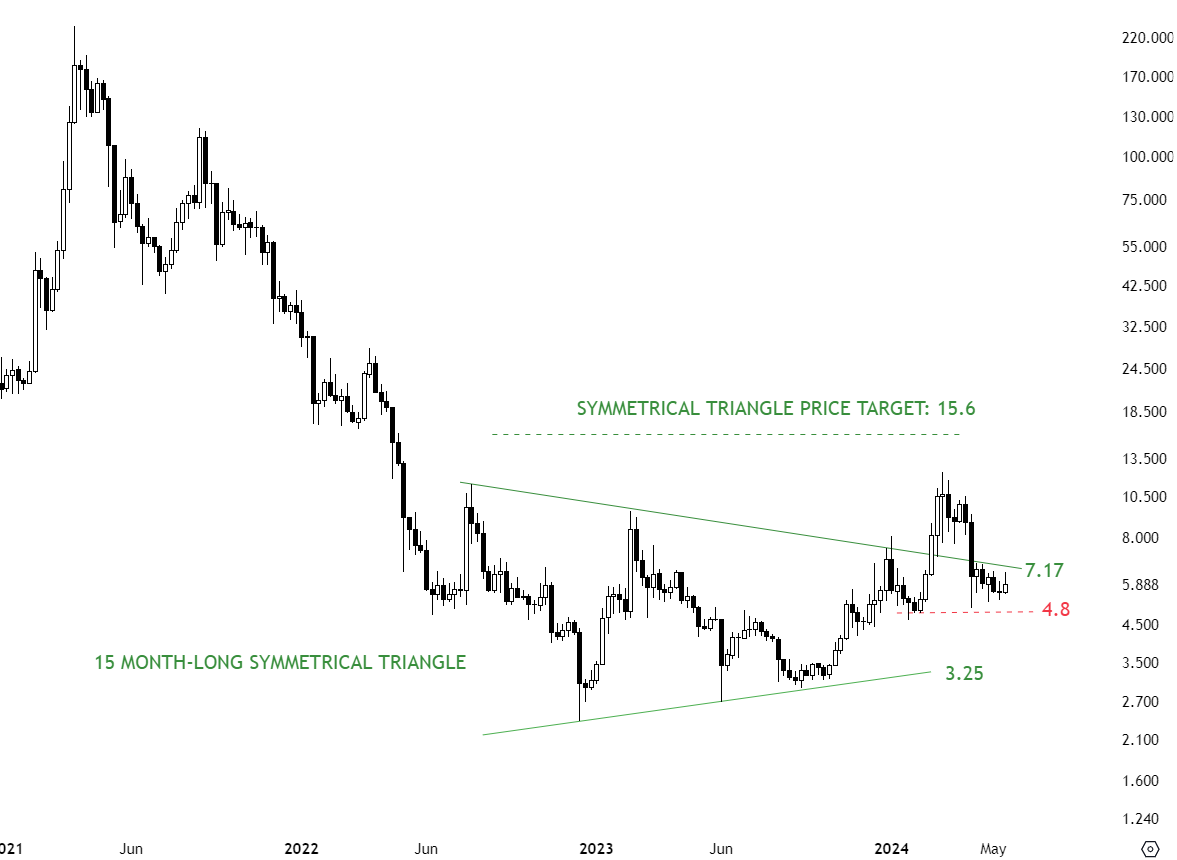
FILUSD possibly completed a 15 month-long symmetrical triangle that is acting as a bottom reversal. Upper boundary was cleared with the breakout above 7.17 levels. Symmetrical triangle price target stands at 15.6 levels. The upper boundary of the symmetrical triangle becomes the new support at 7.17 levels. Price breached the support, though it might be early to call this a failed breakout. A quick recovery above 7.17 levels can keep the price in the bullish territory. Failure to hold above 4.8 levels will negate the chart pattern and possibly result in a test of the lower boundary at 3.25 levels.
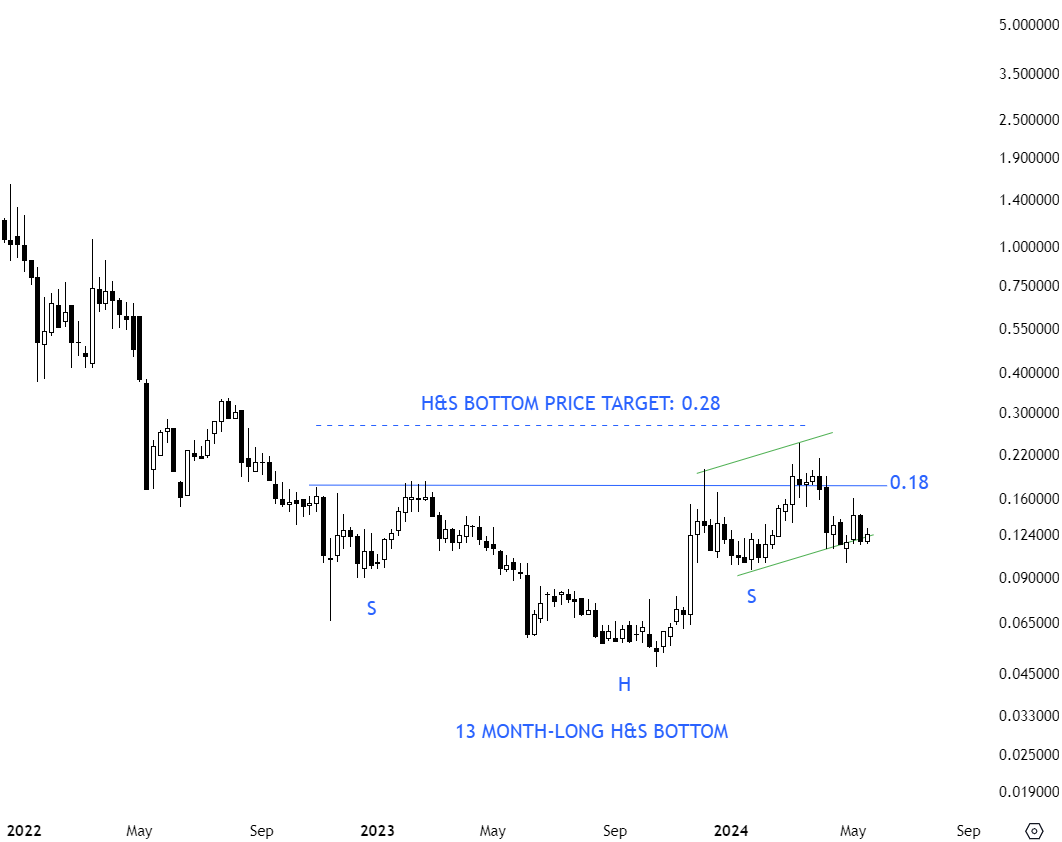
RAREUSD
RAREUSD failed to decisively breakout of a 13 month-long head and shoulder bottom with the neckline acting as resistance at 0.18 levels. Lack of momentum and long white candle resulted in hesitant price action. I will monitor this pair for a recompletion above the horizontal boundary at 0.18 levels. H&S bottom reversal is not negated. The low of the right shoulder at 0.09 levels will act as H&S bottom reversal negation level. Several pairs have similar technical outlook with the possibility of forming the right shoulders if they manage to rally towards their horizontal necklines.
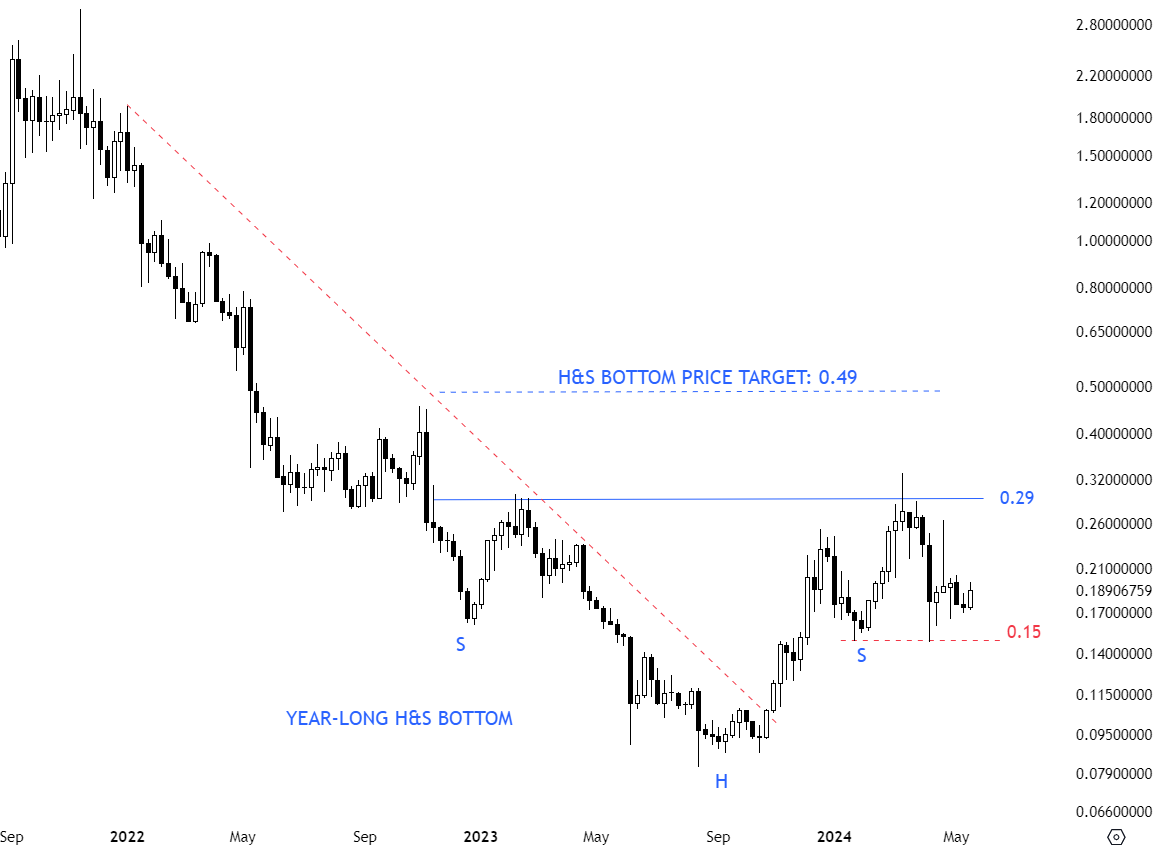
ALGOUSD
ALGOUSD failed to reverse a year-long downtrend with the possible 12 month-long H&S bottom reversal. I’ve adjusted the neckline to horizontal at 0.29 levels. The low of the right shoulder at 0.15 is the pattern negation level. I’m monitoring this chart for a rally towards the horizontal neckline at 0.29 levels. If we get that rally in the next couple of weeks, I will have more confidence on the possibility of a multi-month long bottom reversal.
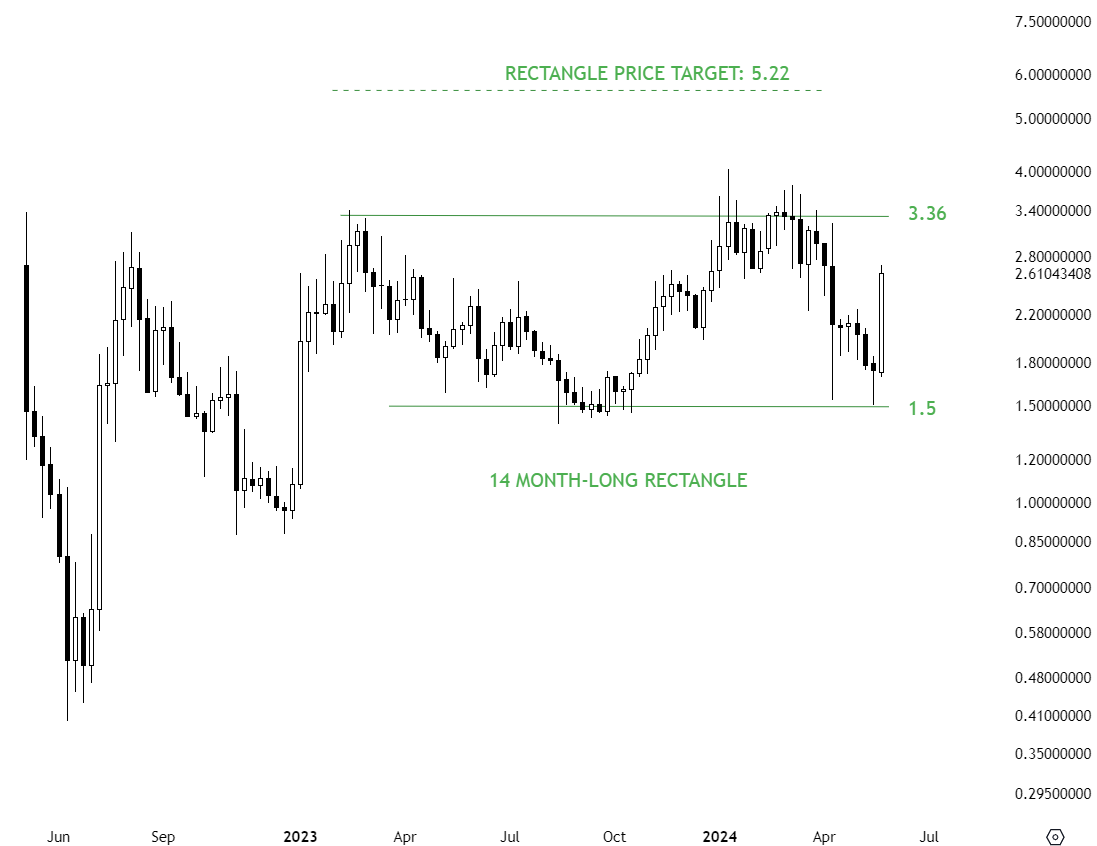
LDOUSD
I’ve adjusted the boundaries of the chart pattern in progress. I’m focusing on the 14 month-long rectangle with the upper boundary acting as resistance at 3.36 and the lower boundary as support at 1.5 levels. Both boundaries are tested several times. Breakout above 3.36 can confirm the rectangle with the price target of 5.22 levels.
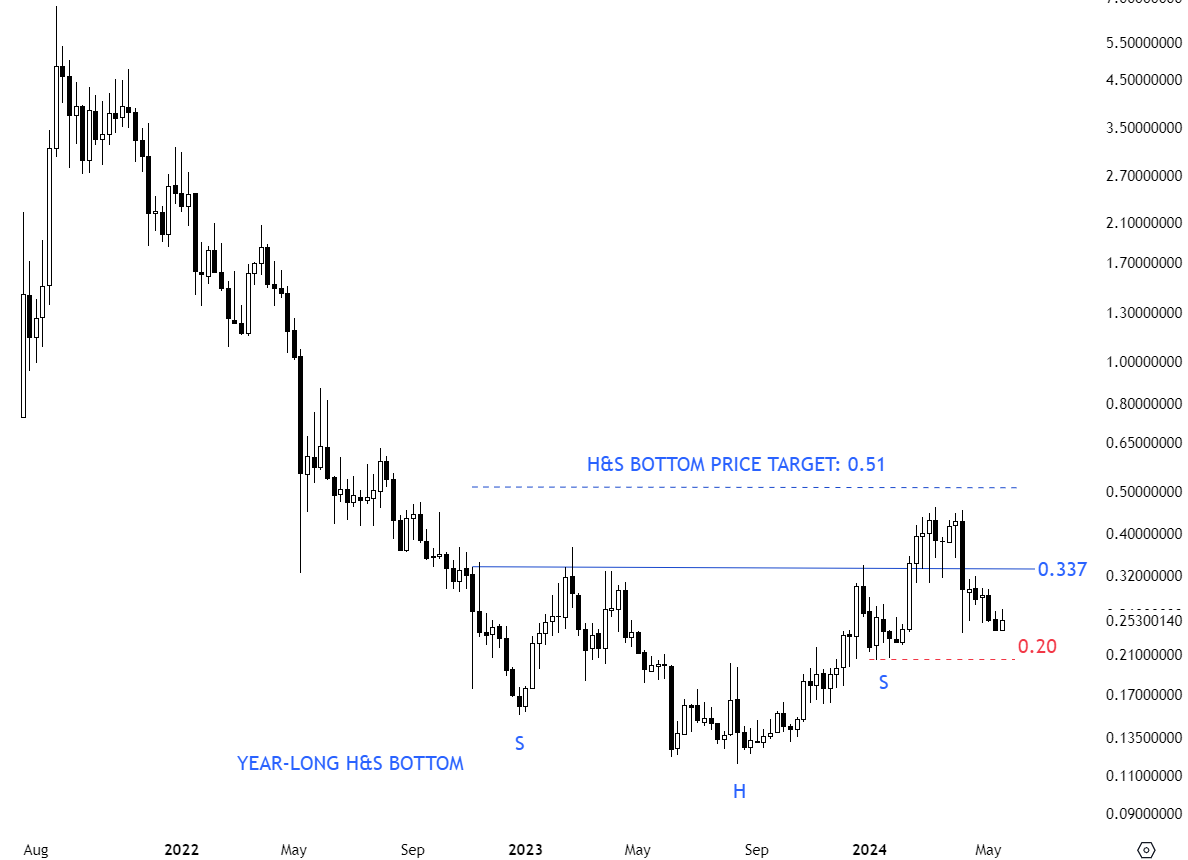
C98USD
C98USD completed a year-long H&S bottom reversal with the neckline standing at 0.337 levels. The neckline acted as support until last month’s increased volatility. It is still early to call this a failed breakout. A quick recovery above 0.337 levels can put the price in bullish territory. Chart pattern negation levels stands at 0.20 levels. Breakdown below the low of the right shoulder can result in a H&S bottom failure and target 0.11 levels.
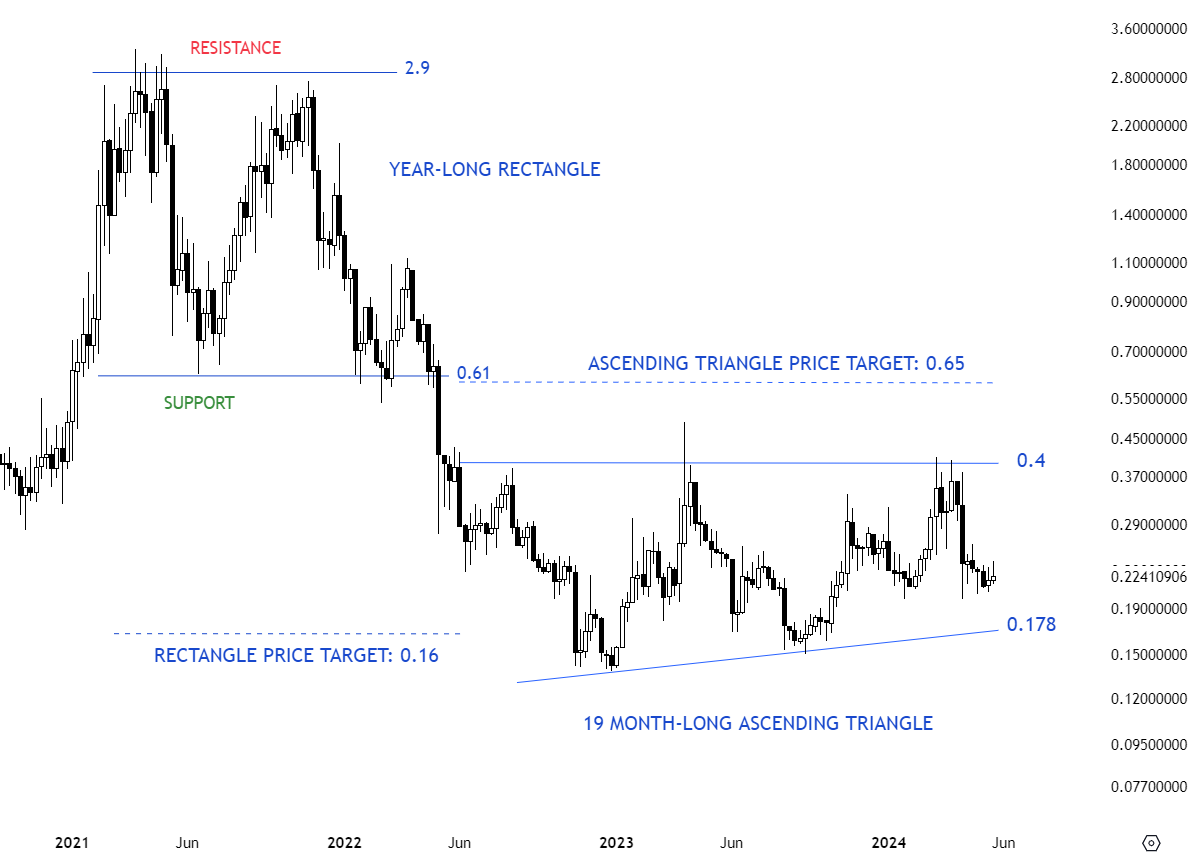
ICXUSD
ICXUSD possibly formed a 19 month-long ascending triangle with the horizontal boundary acting as strong resistance at 0.4 levels. The upper boundary was tested several times. Breakout above 0.4 levels can push the price towards the price target at 0.65 levels. The lower boundary is forming support at 0.178 levels.
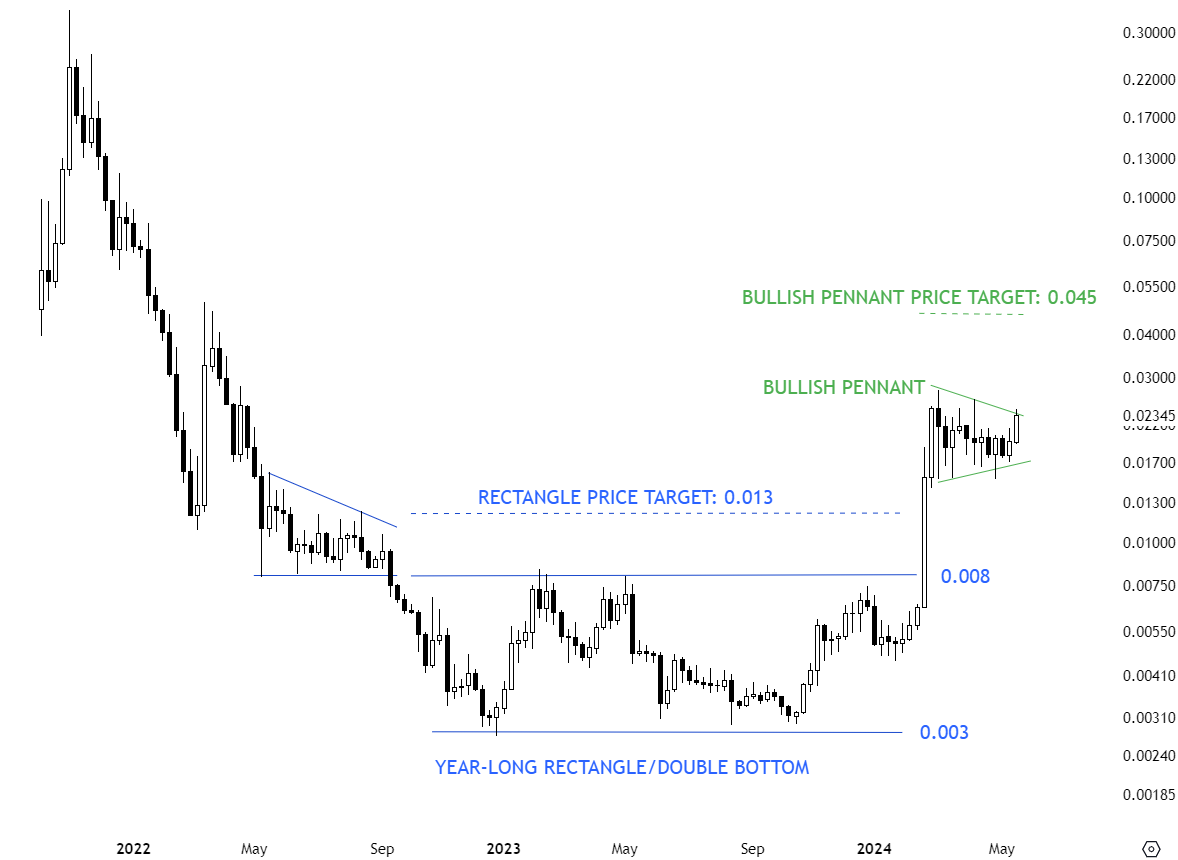
JASMYUSD
JASMYUSD possibly formed a month-long bullish pennant after its breakout above 0.008 levels and the recent rally. Bullish pennant can resume the existing uptrend. Price target for the pennant stands at 0.045 levels. Price continues to remain in a tight range.
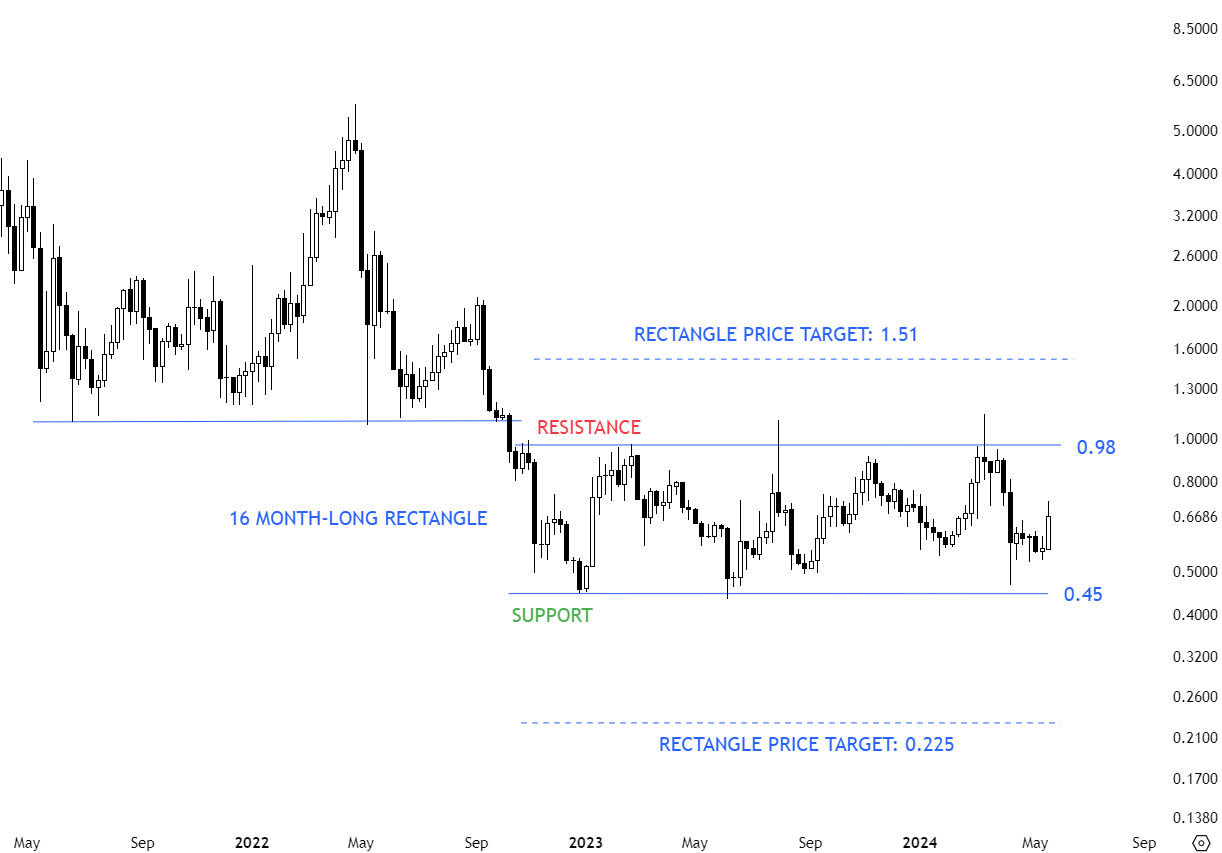
KNCUSD
KNCUSD formed a well-defined consolidation range between 0.45 and 0.98 levels. Pattern can be identified as a rectangle. Given the existing downtrend, I have added the possible breakdown target as 0.225 levels. Both boundaries were tested several times and a breakout in any direction is expected to offer a directional movement. Breakout above 0.98 levels can confirm the rectangle as a bottom reversal with the price target of 1.51 levels.
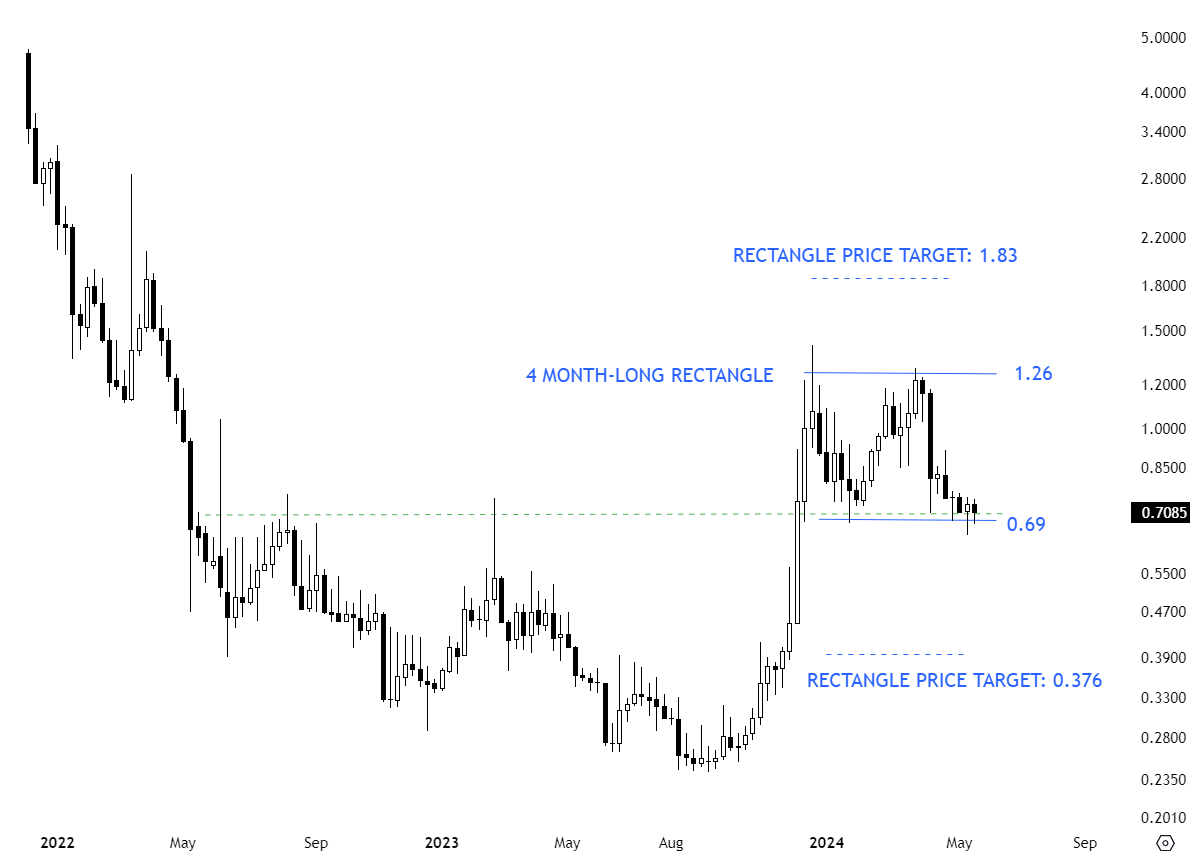
POLSUSD
POLSUSD might be forming a rectangle chart pattern after the recent rally. There are two touch points on the well-defined consolidation. 0.69 levels is acting as support. Rebound from current levels can target the upper boundary at 1.26 levels and result in the rectangle acting as bullish continuation chart pattern. Breakdown below 0.69 levels can confirm a short-term double top with price target of 0.376 levels.
IOSTUSD
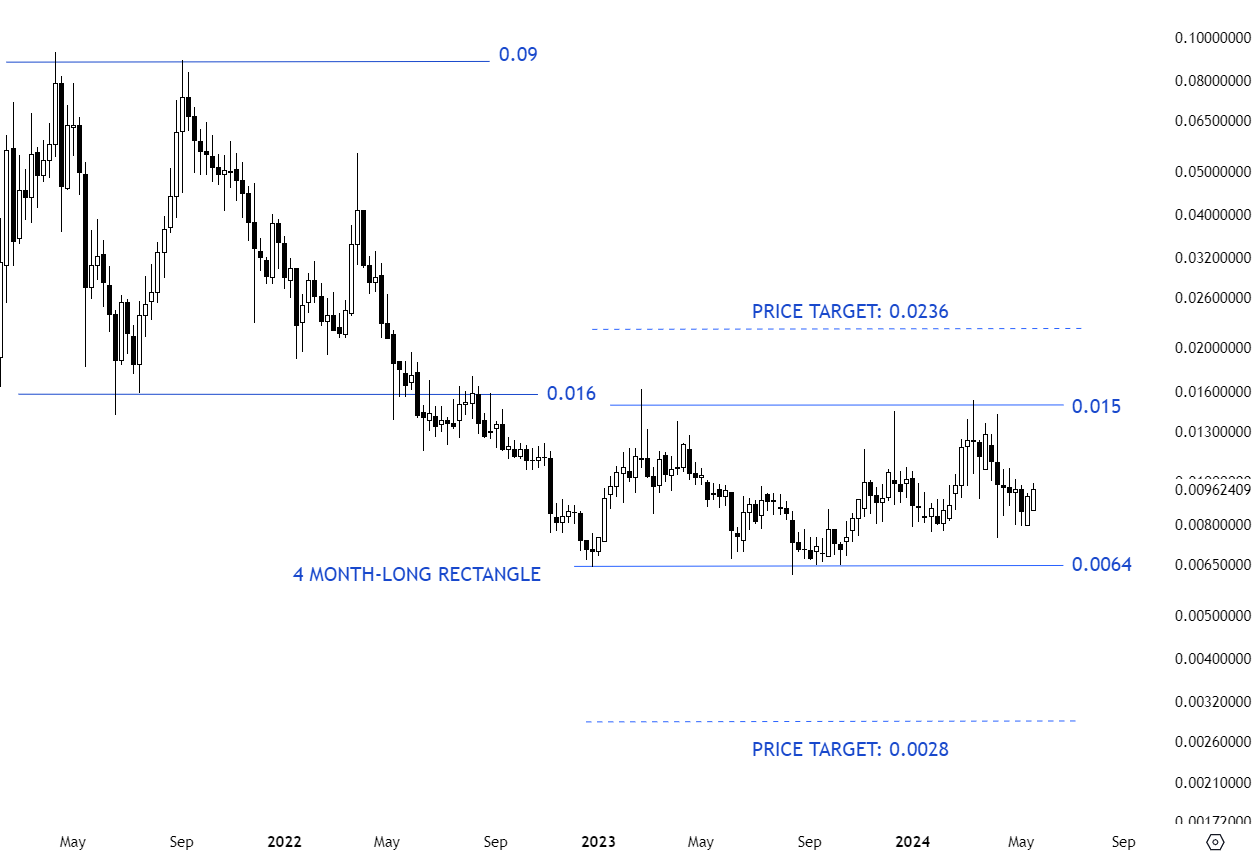
IOSTUSD might be forming a 4 month-long rectangle in a steady downtrend. Rectangle can act as a bearish continuation if price breaks down the horizontal support at 0.0064 levels. Possible price target for the rectangle stands at 0.0028 levels. Breakout above 0.015 levels can confirm the rectangle as a bottom reversal with the price target of 0.0236 levels.
1INCHUSD
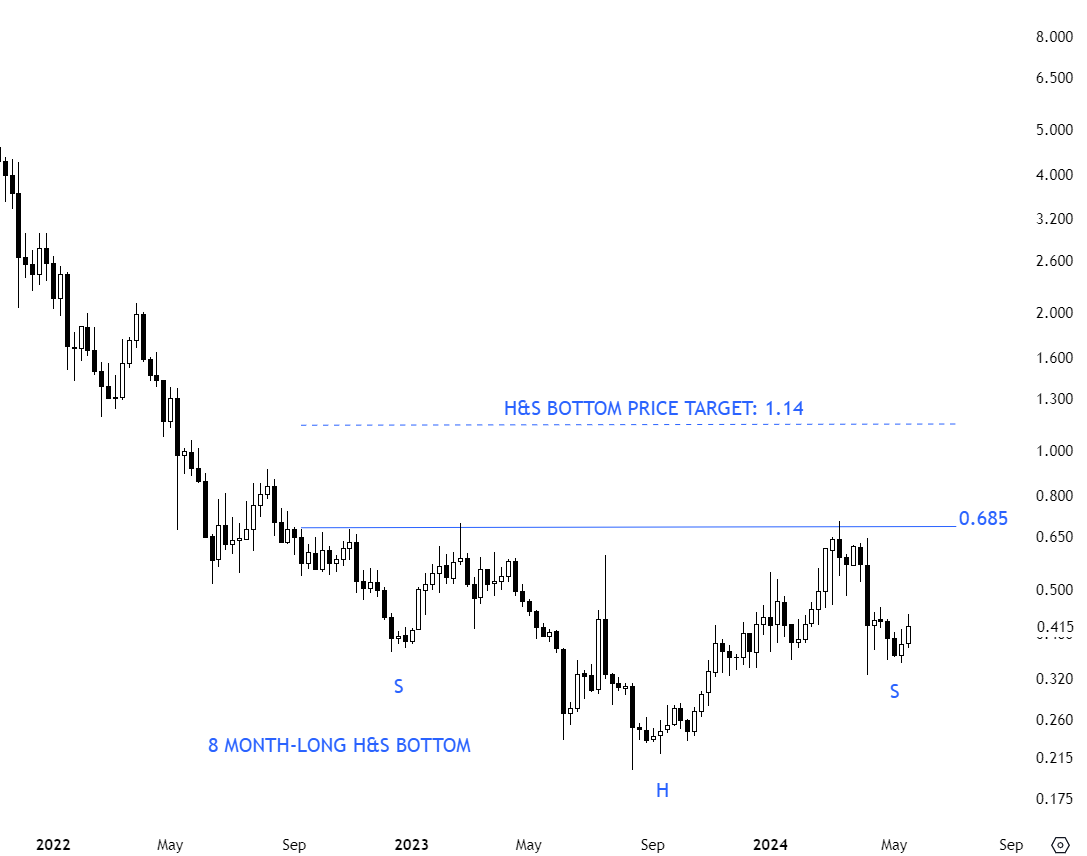
1INCUSD is one of those pairs that might be forming a multi-month long bottom reversal. The horizontal neckline is acting as resistance at 0.685 levels. A sharp rally towards the horizontal neckline can form the right shoulder and offer a higher conviction setup. The pattern will be confirmed after a breakout above 0.685 levels and offer a price target of 1.14 levels.
AXSUSD
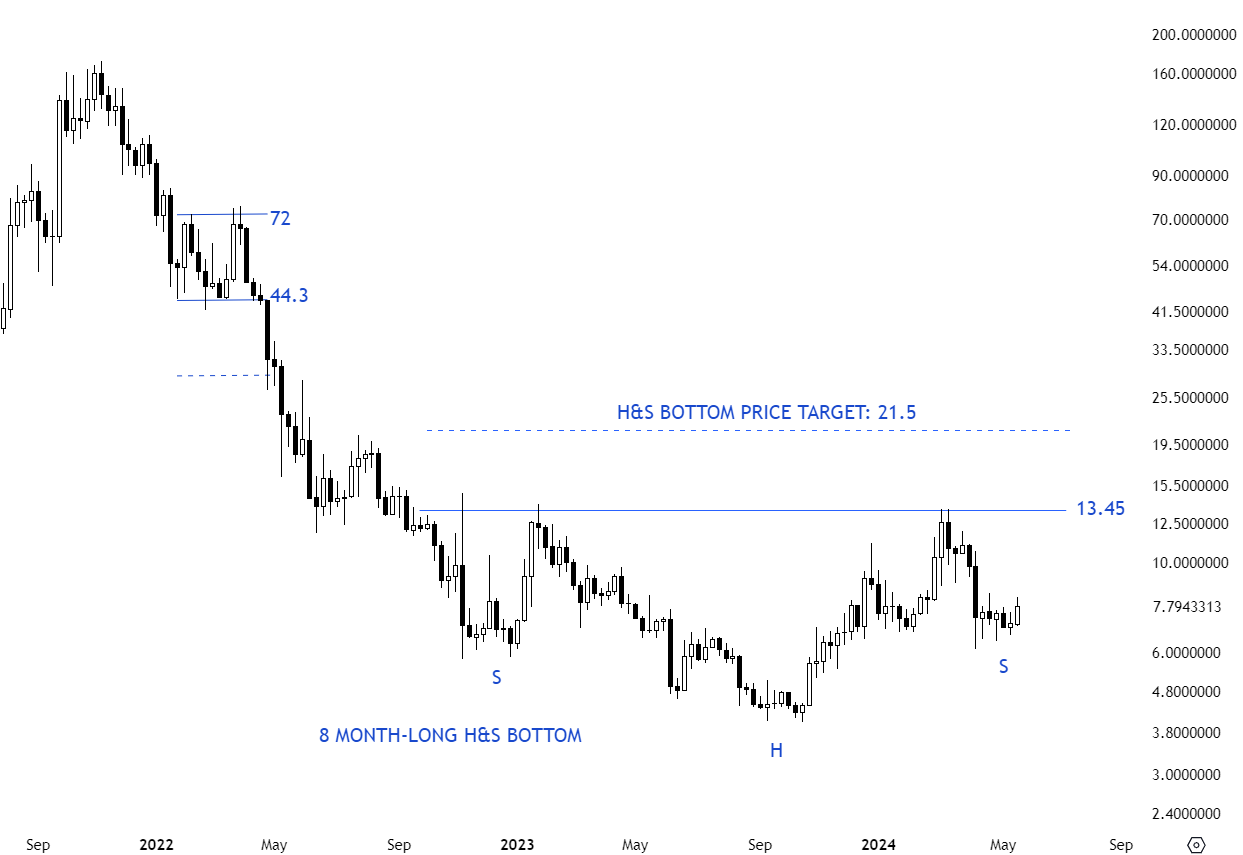
AXSUSD might be forming an 8 month-long H&S bottom reversal with the right shoulder in progress. A sharp rally towards 13.45 levels can form the right shoulder in a high conviction setup. Breakout above the horizontal neckline will complete the H&S bottom reversal with the price target of 21.5 levels.
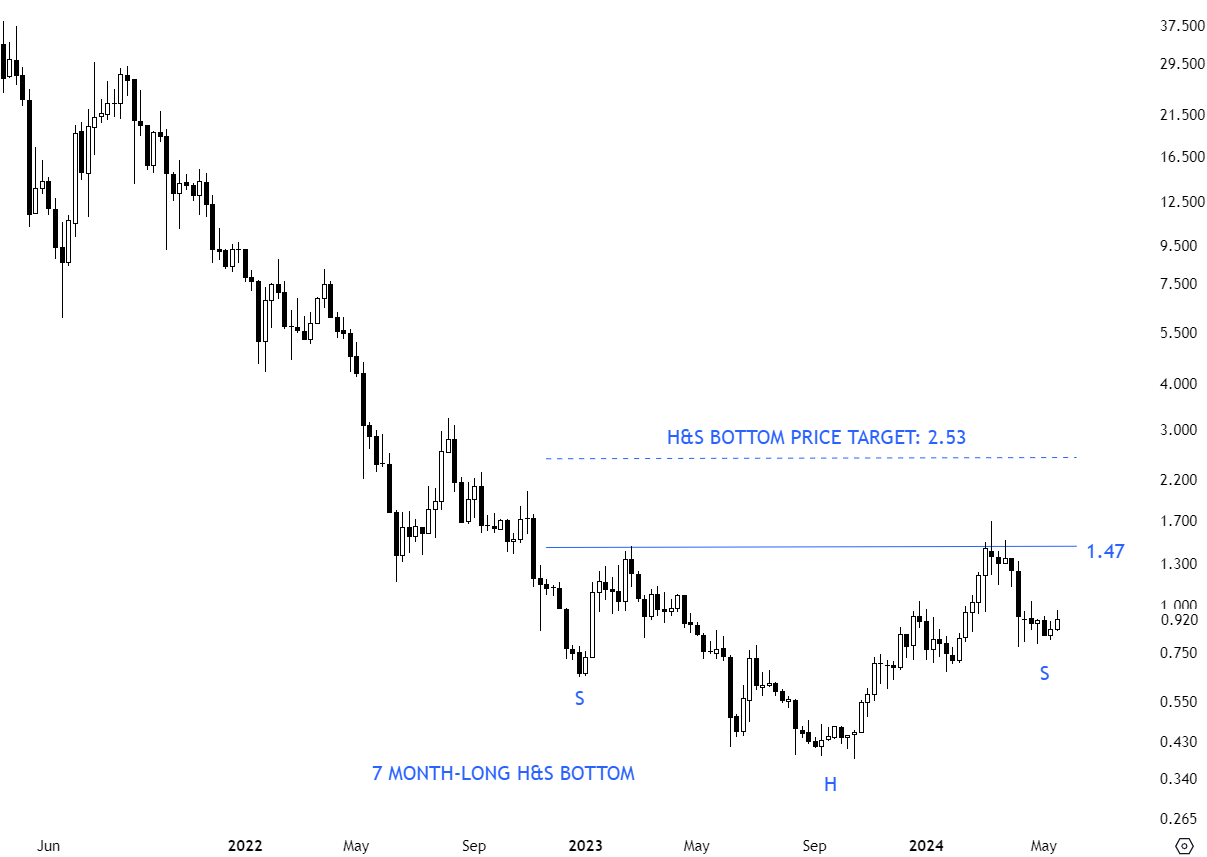
FLOWUSD
FLOWUSD is another pair with a possible multi-month long H&S bottom reversal. The neckline is acting as resistance at 1.47 levels. A shar rally towards the horizontal boundary can form the right shoulder. Completion of the bottom reversal chart pattern can target 2.53 levels.