
JAPAN NIKKEI 225 INDEX FUTURES
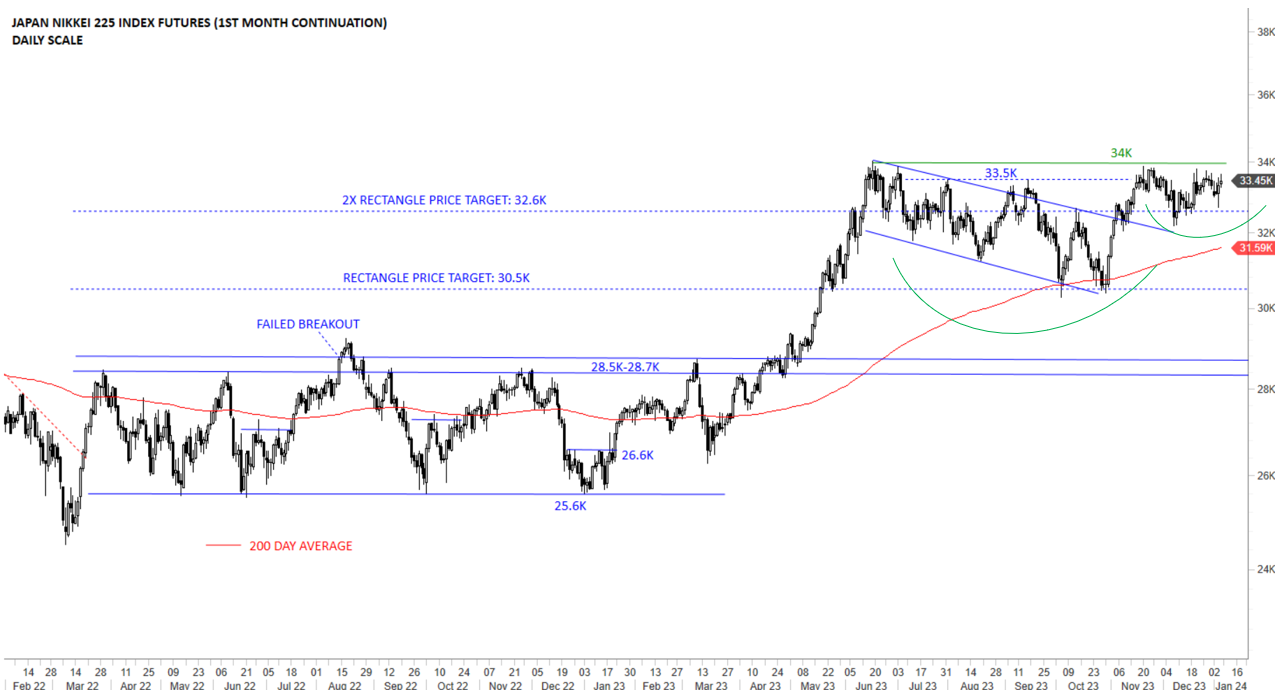
Every week Tech Charts Global Equity Markets report features some of the well-defined, mature classical chart patterns under a lengthy watchlist and the chart pattern breakout signals that took place during that week. Global Equity Markets report covers single stocks from developed, emerging and frontier markets, ETF’s, select commodities, cryptocurrencies and global equity indices. Below chart, Japan’s NIKKEI 225 index is from the review section of the weekly report. It is featuring a possible 7 month-long cup & handle continuation that can breakout to all-time highs.
JAPAN NIKKEI 225 INDEX FUTURES
Japan’s NIKKEI 225 index completed the multi-month long consolidation range between 25.6K and 28.7K. Uptrend is intact. Price action was more like a reversion to the mean. The upper boundary of the trend channel was breached late October. The index broke out of a diagonal pattern (downward sloping channel) and the minor highs between 33.5K and 34K acted as short-term resistance. 32.5K (the upper boundary of the trend channel) becomes the short-term support. It will be important for the index to hold above the 200-day average and the upper boundary of the channel to resume its uptrend. So far the price action looks more like a breakout from the trend channel and a pullback to the upper boundary. The latest pullback to the channel is possibly the handle of a 6 month-long cup & handle continuation. Breakout above 34K can push the index towards the cup & handle chart pattern price target at 37.5K.
Tech Charts Membership

By becoming a Premium Member, you’ll be able to improve your knowledge of the principles of classical charting.
With this knowledge, you can merge them with your investing system. In fact, some investors use my analyses to modify their existing style to invest more efficiently and successfully.

As a Premium Member of Aksel Kibar’s Tech Charts,
You will receive:
-
Global Equities Report. Delivered weekly.
-
Classical charting principles. Learn patterns and setups.
-
Actionable information. Worldwide indices and stocks of interest.
-
Risk management advice. The important trading points of each chart.
-
Information on breakout opportunities. Identify the ones you want to take action on.
-
Video tutorials. How patterns form and why they succeed or fail.
-
Watch list alerts. As they become available so you can act quickly.
-
Breakout alerts. Usually once a week.
-
Access to everything (now and as it becomes available)o Reports
o Videos and video series -
Multi-part webinar course. You learn the 8 most common charting principles.
-
Webinars. Actionable and timely advice on breaking out chart patterns.
For your convenience your membership auto renews each year.


