RUSSELL 2000 INDEX (.RUT)
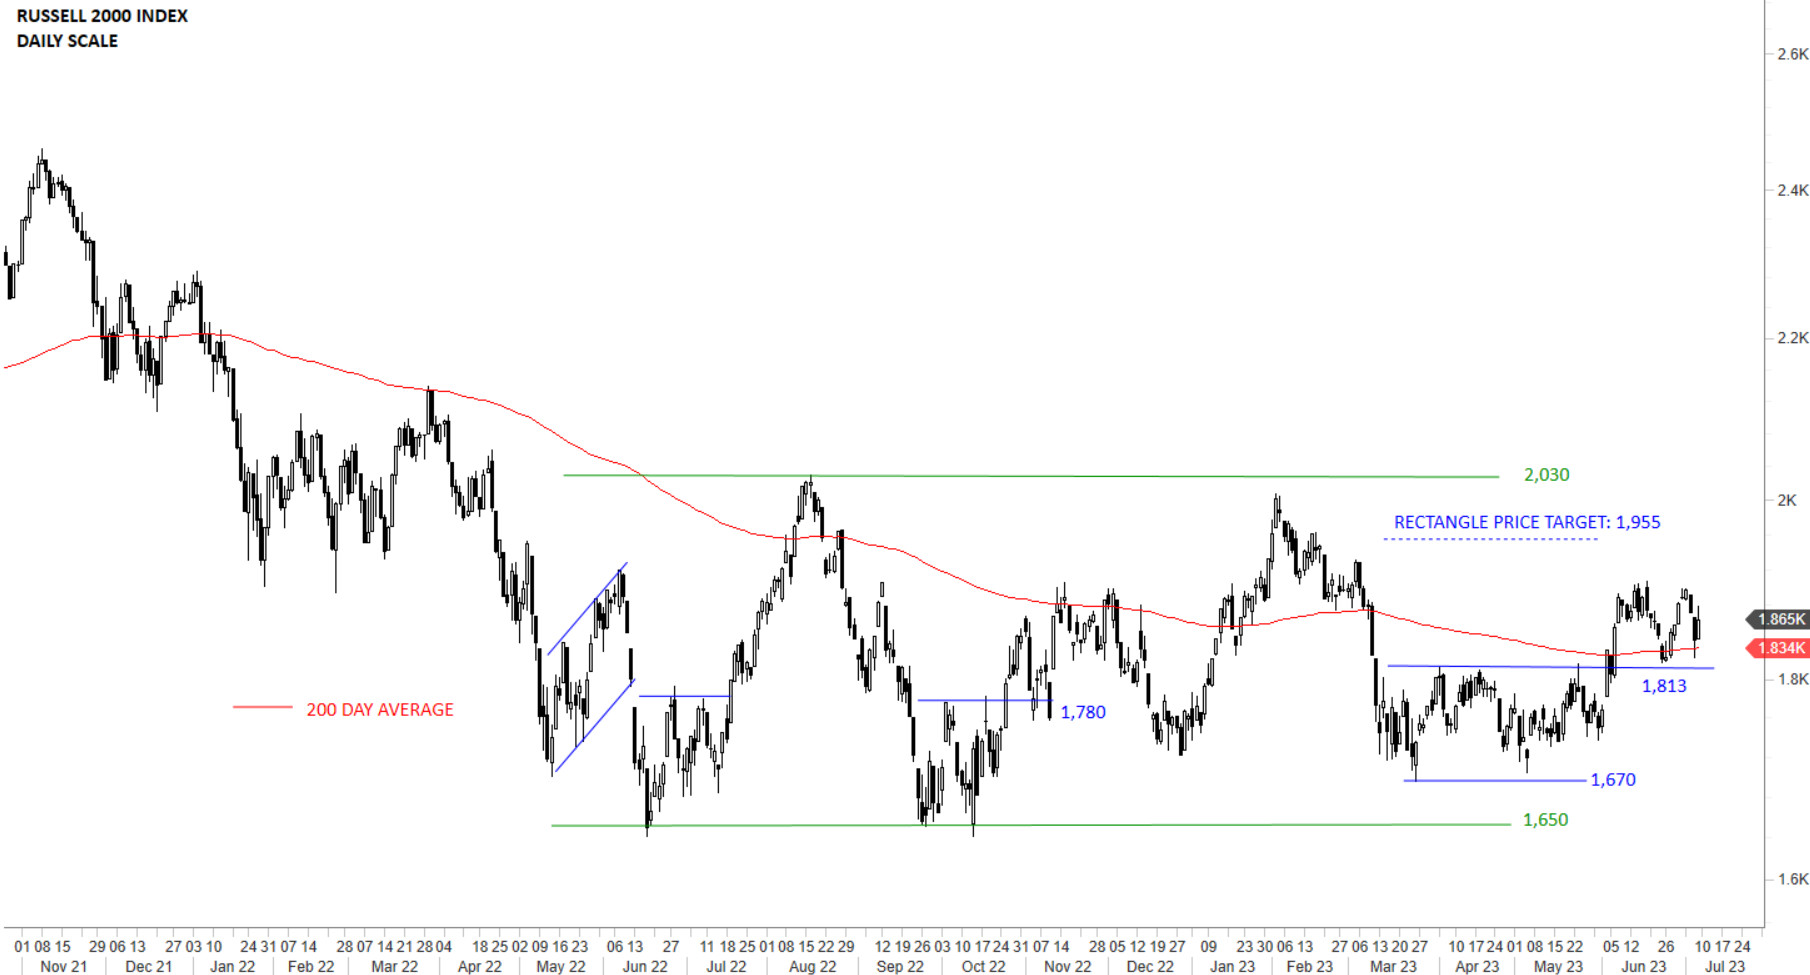
Every week Tech Charts Global Equity Markets report features some of the well-defined, mature classical chart patterns under a lengthy watchlist and the chart pattern breakout signals that took place during that week. Global Equity Markets report covers single stocks from developed, emerging and frontier markets, ETF’s, select commodities, cryptocurrencies and global equity indices. Below chart, Russell 2000 INDEX is from the review section of the weekly report. It is featuring a rectangle chart pattern acting as a bottom reversal on daily scale price chart.
Russell 2000 Index has been a laggard when compared with Tech stocks and Blue chips. The upper boundary of the short-term consolidation is forming support at 1,813 levels. Breakout above the 200-day average and the upper boundary of the rectangle was positive for small caps. Rectangle is possibly acting as a bottom reversal with the price target of 1,955 levels. Previous resistance area between 1,813 and 1,830 becomes the new support area. This week’s price action resumed the consolidation around the 200-day average. Last one month’s sideways consolidation can become part of a pullback to the broken resistance at 1,813 levels.
Tech Charts Membership

By becoming a Premium Member, you’ll be able to improve your knowledge of the principles of classical charting.
With this knowledge, you can merge them with your investing system. In fact, some investors use my analyses to modify their existing style to invest more efficiently and successfully.

As a Premium Member of Aksel Kibar’s Tech Charts,
You will receive:
-
Global Equities Report. Delivered weekly.
-
Classical charting principles. Learn patterns and setups.
-
Actionable information. Worldwide indices and stocks of interest.
-
Risk management advice. The important trading points of each chart.
-
Information on breakout opportunities. Identify the ones you want to take action on.
-
Video tutorials. How patterns form and why they succeed or fail.
-
Watch list alerts. As they become available so you can act quickly.
-
Breakout alerts. Usually once a week.
-
Access to everything (now and as it becomes available)o Reports
o Videos and video series -
Multi-part webinar course. You learn the 8 most common charting principles.
-
Webinars. Actionable and timely advice on breaking out chart patterns.
For your convenience your membership auto renews each year.


