“Demystifying the world of Classical Charting”
– AKSEL KIBAR


Every week Tech Charts Global Equity Markets report features some of the well-defined, mature classical chart patterns (bullish & bearish) under a lengthy watchlist and the chart pattern breakout signals that took place during that week. Global Equity Markets report covers single stocks from developed and emerging markets, ETF's and global equity indices. The main focus of the weekly report is to bring member's attention some of the best examples of classical charting and chart patterns that are likely to resolve in a directional move. This blog post reviews one of several important technical developments in the Global Equity Markets.
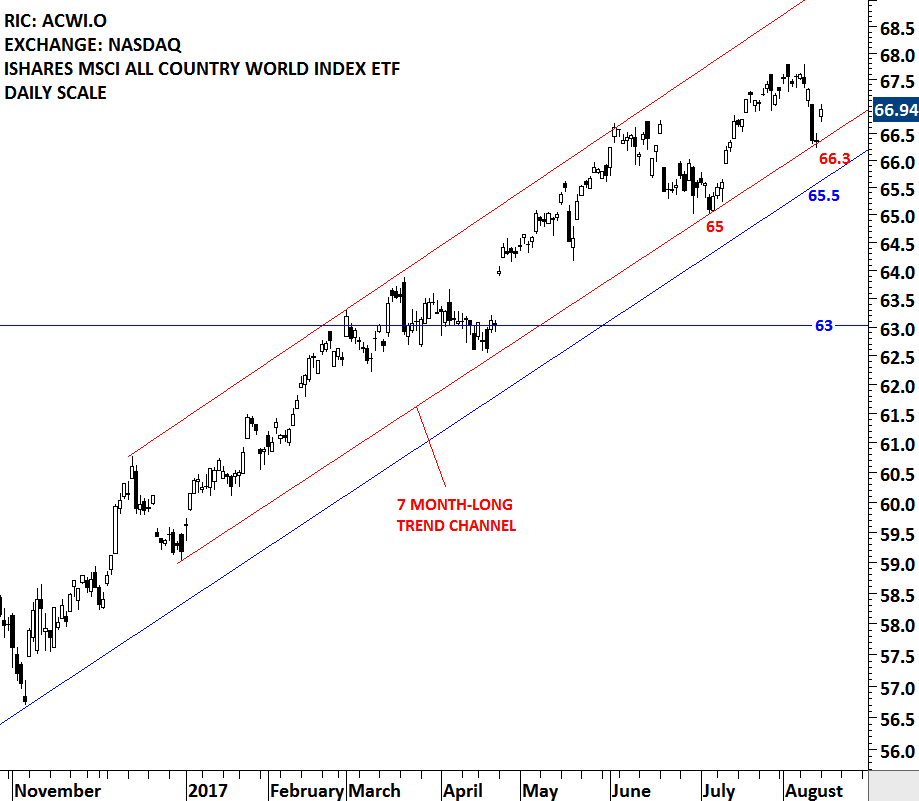
Last week's price action did some technical damage on the charts. MSCI ALL COUNTRY WORLD INDEX ETF, a benchmark for global equity market performance gave back three weeks of gains in one weekly bar. The discussion on the financial networks and social media was about buying the dip. The iShares MSCI All Country World Index ETF is listed on the Nasdaq Stock Exchange. 66.3 is the lower boundary of the 7 month-long trend channel for the ACWI ETF. The index rebounded from the strong support once again. Failure to hold this support level can push the price to the next support at 65.5, which is the 17 month-long upward trendline. There is no clear chart pattern forming on the MSCI ACWI ETF that would suggest a top reversal. For those who are looking for a sell signal on the ACWI, the breakdown of the trend channels should give some guidance. In case of further weakness in the global equity markets ( i.e. a breakdown on the ACWI), the weekly Global Equity Markets report featured some of the well-defined bearish chart setups in the global equities and ETFs.
 Read More

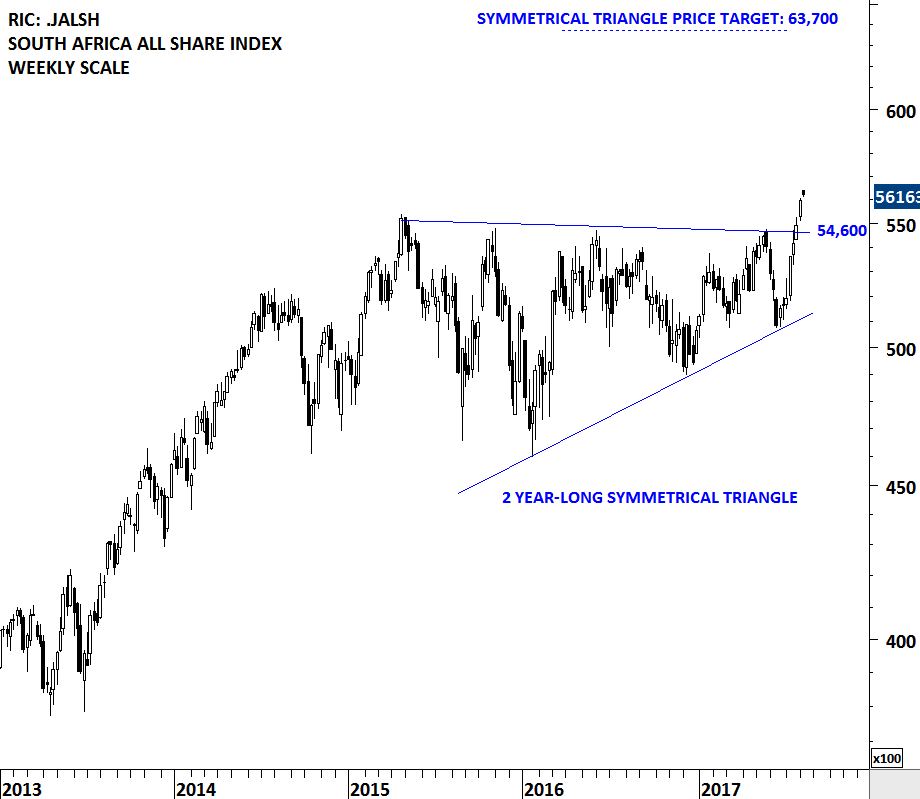
South Africa equities are possibly entering into a strong uptrend with the completion of a 2 year-long sideways consolidation. Last week's price action breached the multi-year trend resistance on the South Africa All Share index and pushed the local equity benchmark to all-time highs. Breakouts from multi-year consolidations usually result in multi-month trends. 54,600 levels will remain as strong support. Possible chart pattern price target for the South Africa All Share Index stands at 63,700 levels.
There are several tradable ETFs listed on the local exchange and also on the global exchanges. Below is a chart of South Africa listed ETF.
Read More
Every week Tech Charts Global Equity Markets report features some of the well-defined, mature classical chart patterns under a lengthy watchlist and the chart pattern breakout signals that took place during that week. Global Equity Markets report covers single stocks from developed and emerging markets, ETF's and global equity indices. The main focus of the weekly report is to bring member's attention some of the best examples of classical charting. Chart patterns that are likely to resolve in a directional move. This blog post highlights one of several great chart setups from the latest Global Equity Markets report.
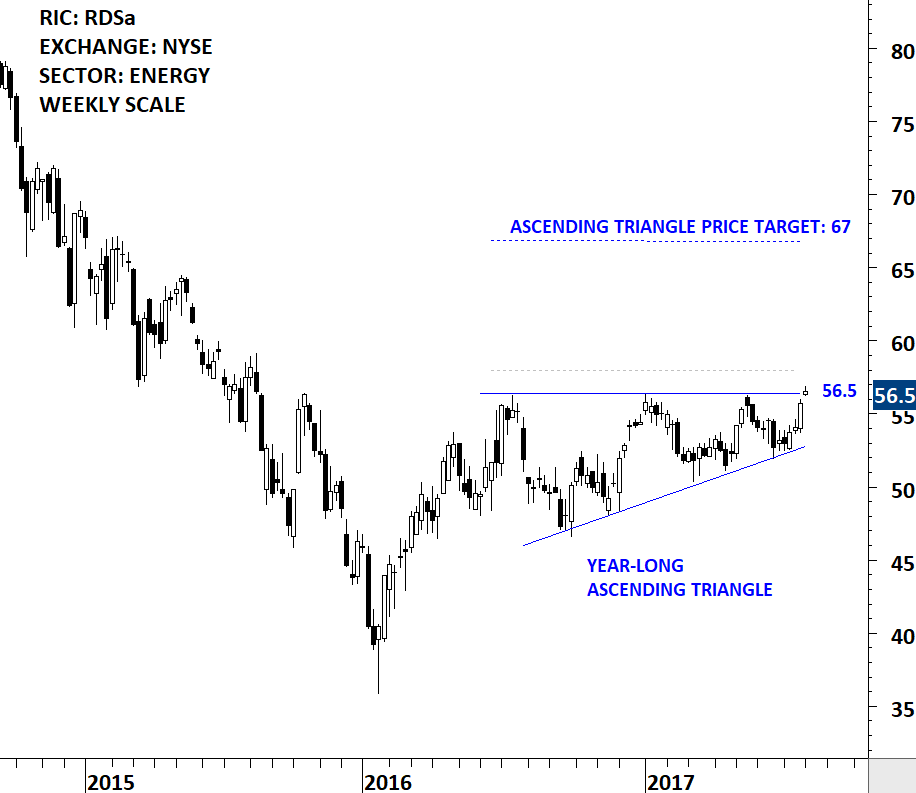
The Royal Dutch Shell plc explores for crude oil and natural gas around the world, both in conventional fields and from sources, such as tight rock, shale and coal formations. The stock is listed in European exchanges as well as the New York Stock Exchange. The chart below shows the New York Stock Exchange listing. Price chart formed a year-long ascending triangle with the strong horizontal resistance standing at 56.5 levels. The stock once again reversed from the lower boundary of its chart pattern. A daily close above 58 levels will confirm the breakout from the year-long ascending triangle with a possible price target of 67 levels.
 Read More
Every week Tech Charts Global Equity Markets report features some of the well-defined, mature classical chart patterns under a lengthy watchlist and the chart pattern breakout signals that took place during that week. Global Equity Markets report covers single stocks from developed and emerging markets, ETF's and global equity indices. The main focus of the weekly report is to bring member's attention some of the best examples of classical charting. Chart patterns that are likely to resolve in a directional move. This blog post highlights one of several great chart setups from the latest Global Equity Markets report. Below you will also find a sample educational video on rectangle chart pattern as well as past examples of Tech Charts Breakout Alerts on Rectangles.
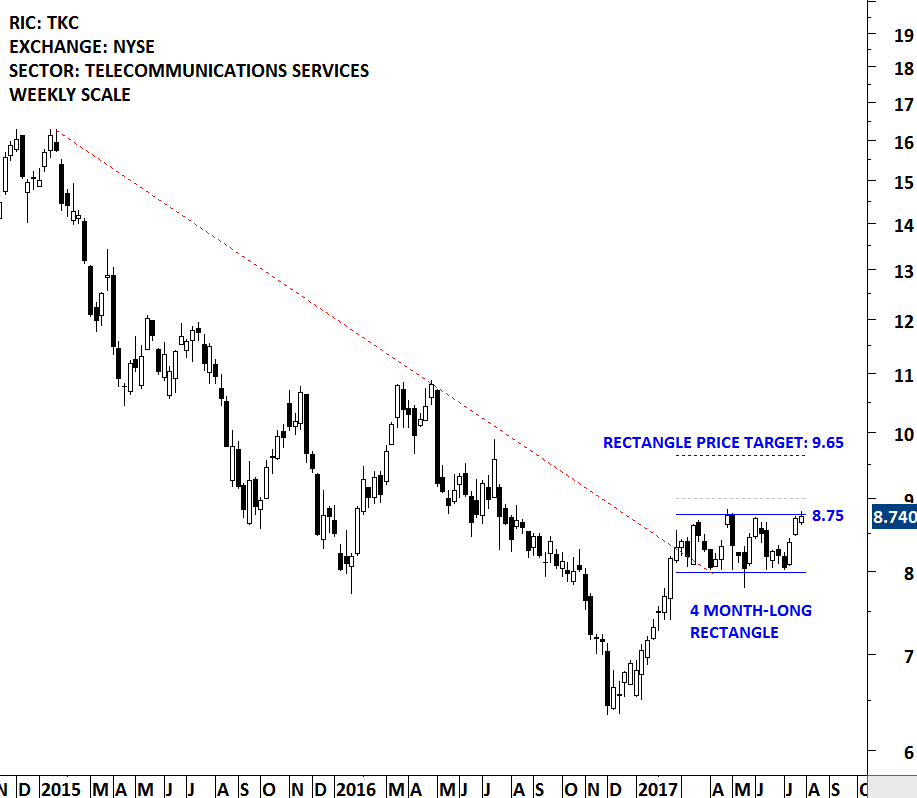
Turkcell Iletisim Hizmetleri AS is engaged in establishing and operating a Global System for Mobile Communications (GSM) network in Turkey and regional states. The stock is listed on the New York Stock Exchange via depository receipts. Price chart formed a 4 month-long rectangle with the horizontal boundary standing as resistance at 8.75 levels. A daily close above 9 levels will confirm the breakout from the bullish continuation chart pattern with a possible price target of 9.65 levels. Rectangle can act as a bullish continuation chart pattern.
 Read More
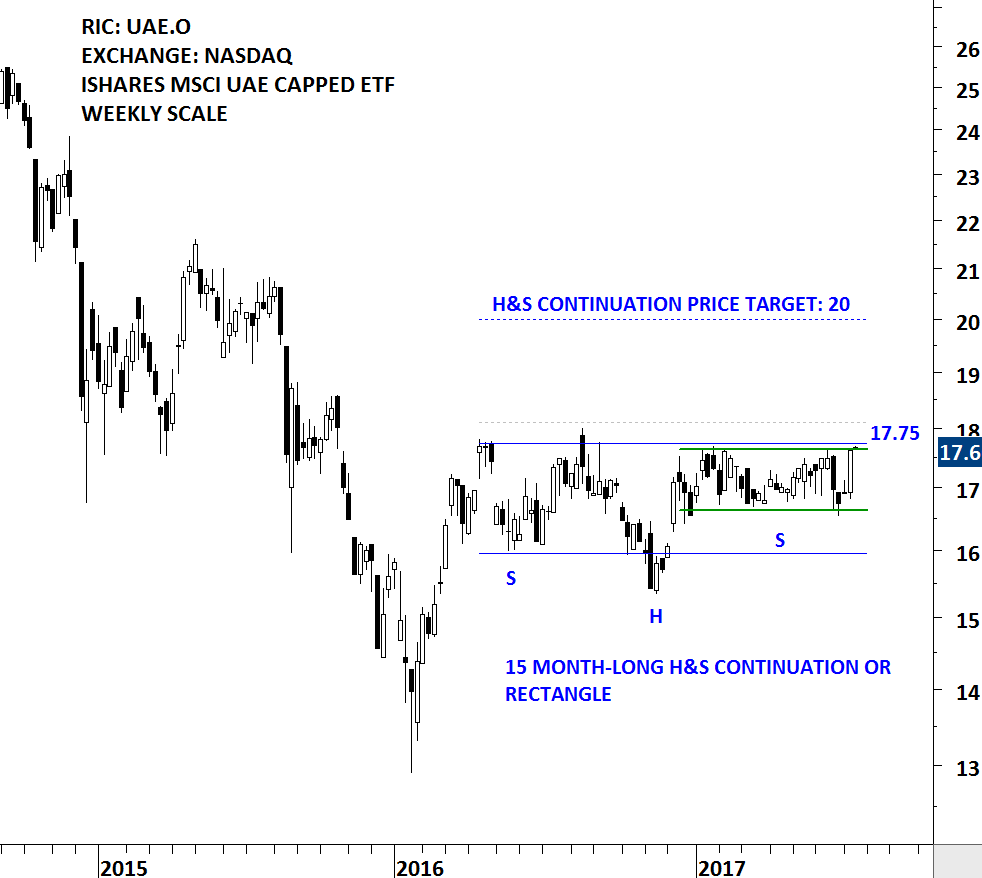
The Fund seeks to track the investment results of the MSCI All UAE Capped Index, which is designed to measure the equity market performance in the United Arab Emirates. The Fund generally invests at least 80% of its assets in securities of the underlying index or in depository receipts representing securities of the underlying index. The ETF is listed on the Nasdaq Stock Exchange. Price chart possibly formed a 15 month-long H&S continuation or a rectangle with the strong horizontal boundary standing at 17.75 levels. Last 6 month's price action can also be identified as a rectangle; another short-term consolidation, usually acting as a preparation for a breakout. A daily close above 18.10 levels will confirm the breakout from the multi-month trading range with the chart pattern price target of 20 levels. Top 10 holdings of the iShares MSCI UAE Capped ETF is compiled in a table below. Also you can find below some examples of H&S continuation chart patterns that Tech Charts Global Equity Markets reports featured in the past issues.
 Read More
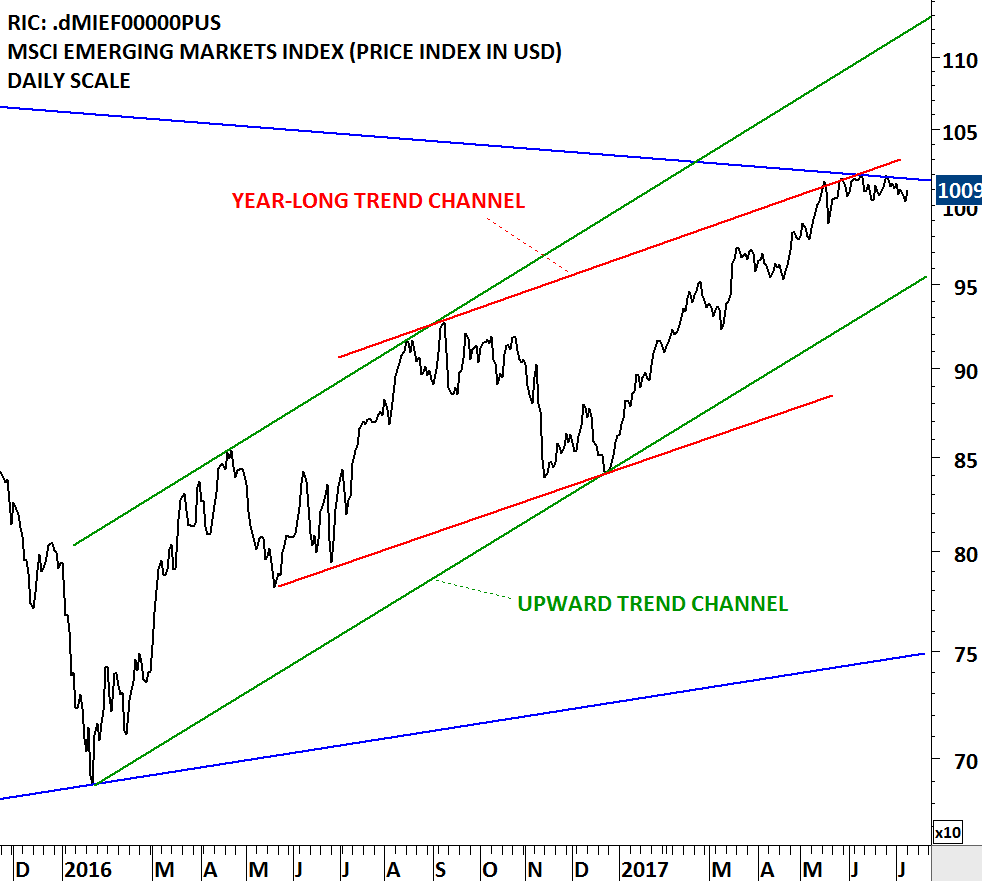
There is enough technical evidence that emerging markets found strong resistance around the current levels. The MSCI EM USD price index tested its decade-long trend line and also the upper boundary of its year-long trend channel. However, it is still early to call for a possible reversal from the strong resistance area. MSCI EM index is possibly forming a decade-long symmetrical triangle.
 Read More
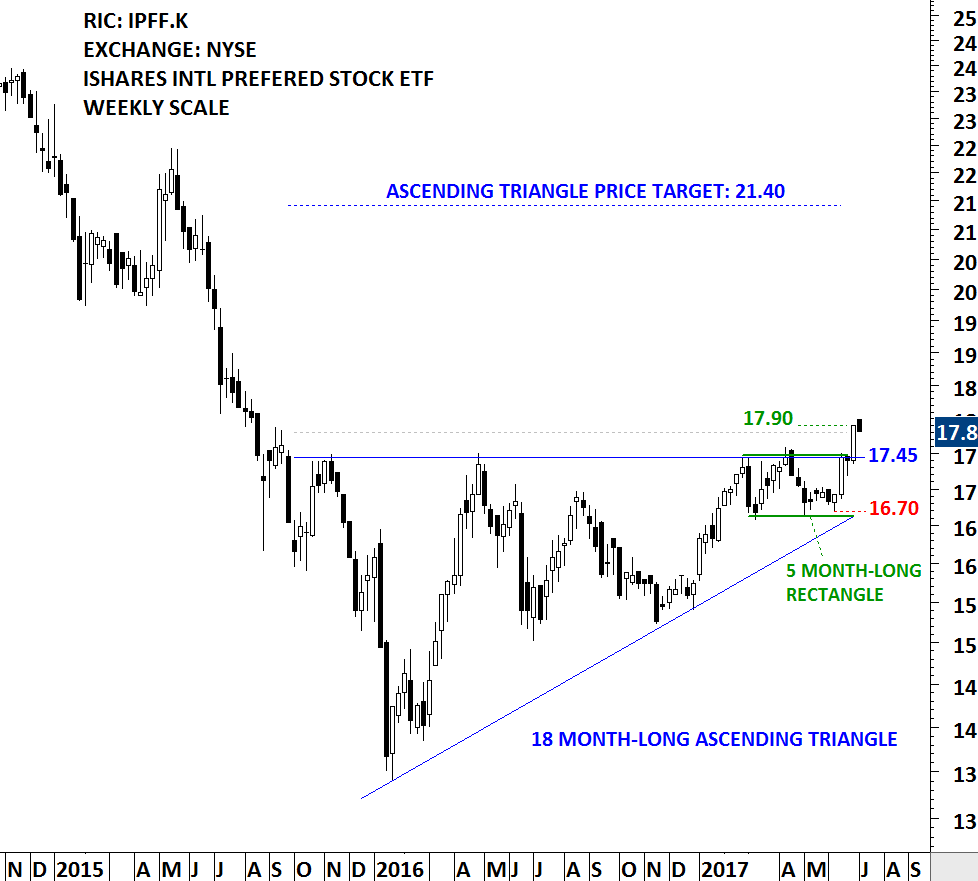
ISHARES INTL PREFERRED STOCK ETF (IPFF.K) formed an 18 month-long ascending triangle. IPFF.K has a well-defined horizontal resistance that was tested several times over the course of the chart pattern. Strong horizontal boundary stands at 17.45 levels. Last 5 month's price action can be identified as a rectangle. The 5 month-long rectangle is acting as a launching pattern (learn more about launching patterns - Video Tutorial). The daily close above 17.80 levels confirmed the breakout from the multi-month ascending triangle with the possible price target of 21.40 levels.
 Read More
Stock prices are either in a follow through trending phase or in a consolidation phase. During a strong trending period, a stock will proceed from one price level to another with very little interruption. During a consolidation period a stock will move in both directions without producing any meaningful or sustained price change.
During periods of consolidation prices tend to form a recognizable chart pattern which helps us to determine the direction and magnitude of the next substantial trend with some degree of accuracy.
Because price action and chart patterns are a result of human interaction, it is possible to find those repeating chart patterns in different markets, in different time frames such as on daily, weekly and monthly scale and in different time periods.

Every week, as I go through 1000’s of charts. I look for select, common characteristics on developing chart patterns. And the chart pattern should be mature on a weekly scale. For me, this means chart patterns in duration between 3 to 24 months. It should have a well-defined and preferably a horizontal chart pattern boundary. I look for chart patterns classified as H&S top/bottom, rectangles, cup & handle continuations, double top/bottoms and flags. I only feature symmetrical triangles that have well-defined boundaries. The boundary of the chart pattern should be tested several times before the breakout takes place. Several tests of a chart pattern boundary is an indication that market participants actually recognized the pattern boundary as an important technical level. A breach of this level would signal a shift in the market dynamics between the bulls and the bears.