“Demystifying the world of Classical Charting”
– AKSEL KIBAR


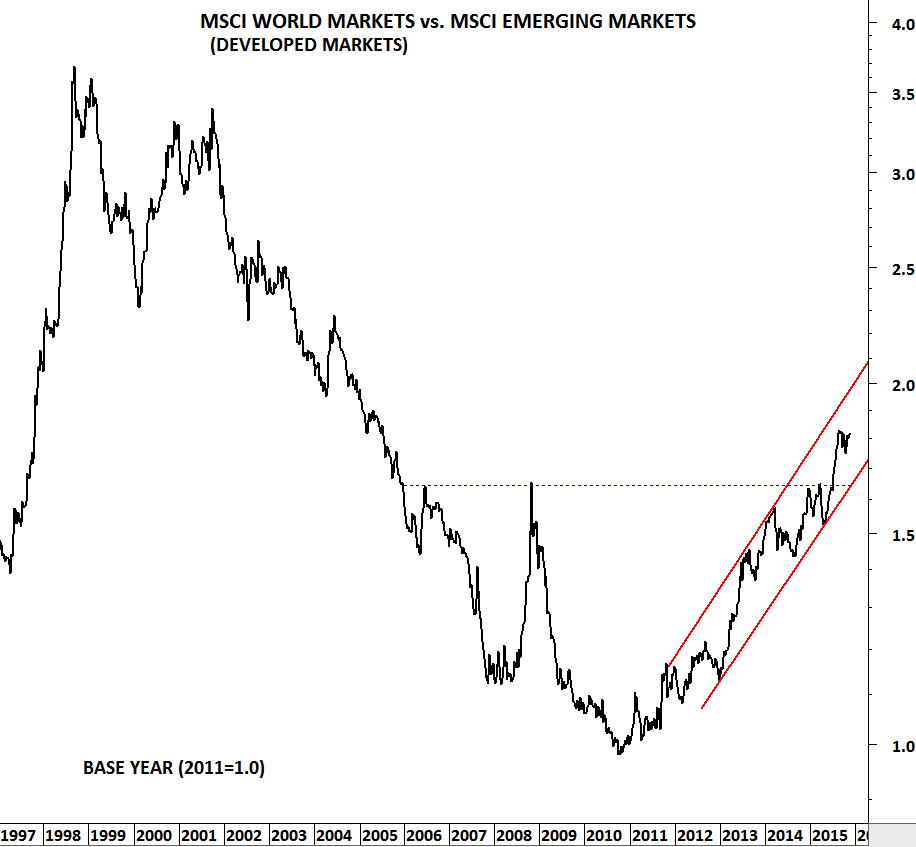
Since the beginning of 2011, developed market equities have been performing better than emerging markets. This trend is still intact.
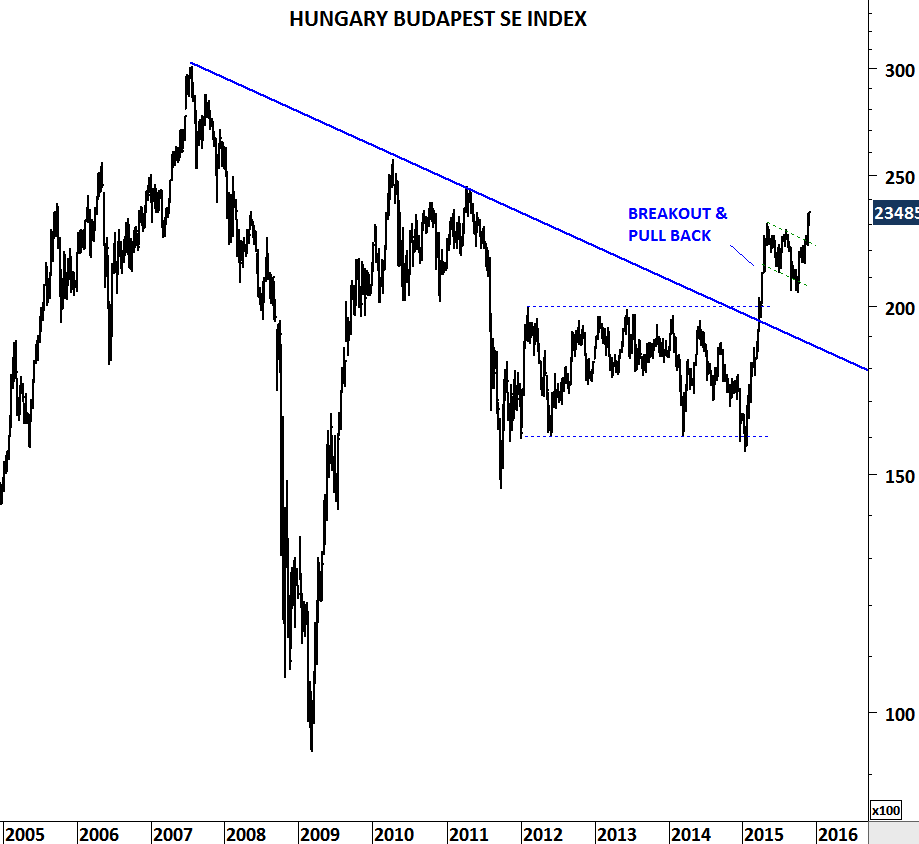
Though there is one emerging European equity market that is showing clear strength against its peers. That is HUNGARY. Budapest SE index is ready for another upward leg, after an initial breakout followed by a pullback.
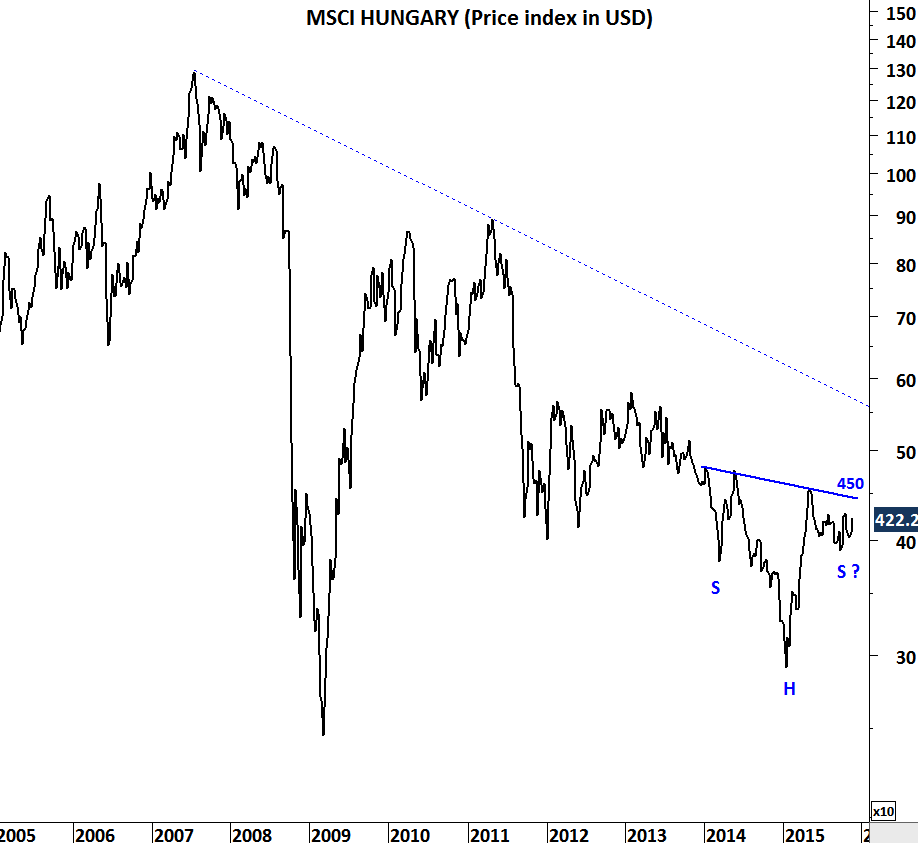
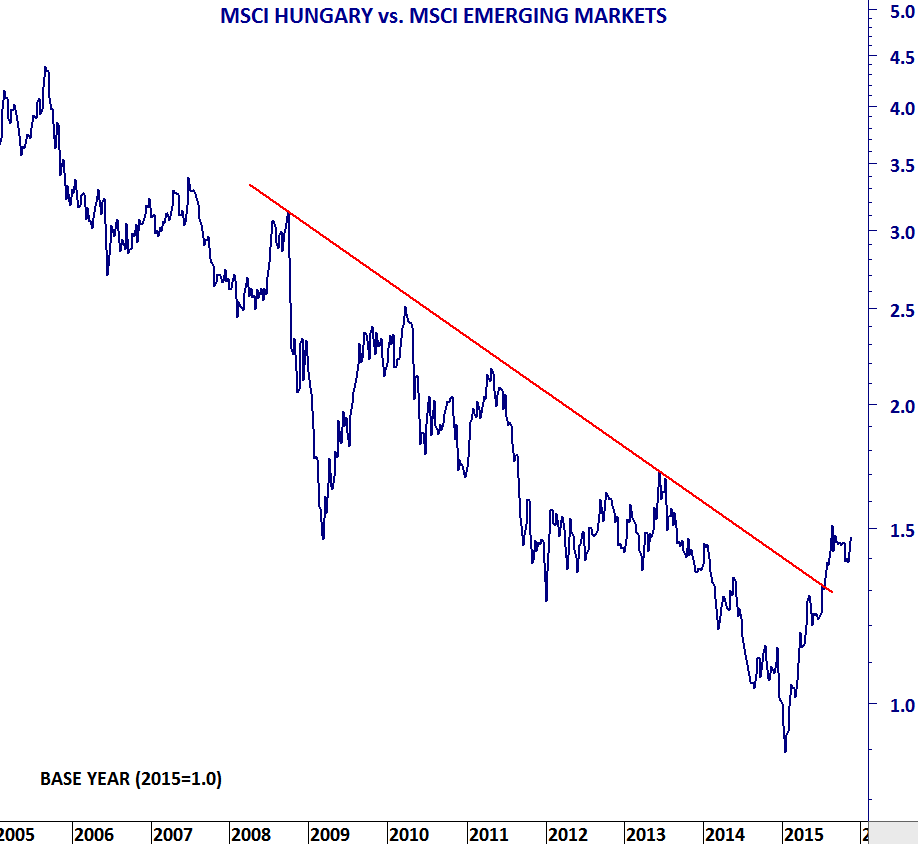
Since the beginning of the year MSCI Hungary has been outperforming MSCI emerging markets index. Also, a major reversal chart pattern; head and shoulder bottom, might be developing on the MSCI HUNGARY price index. These are bullish sign for the emerging European country.
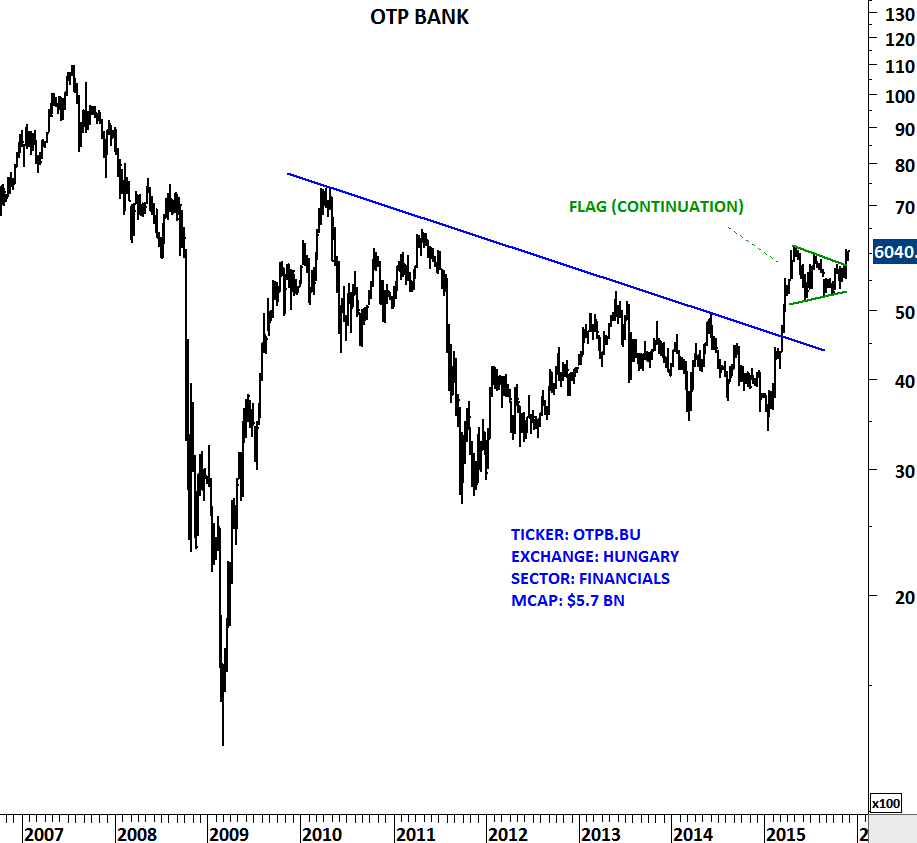
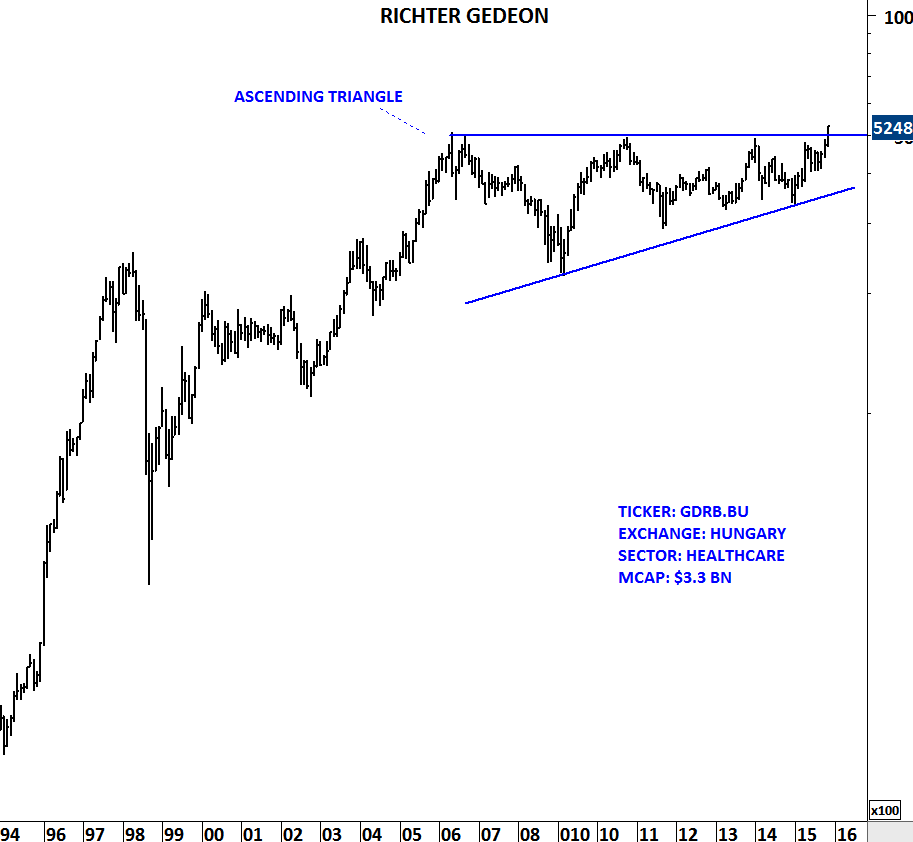
Two charts from the constituents of Budapest SE index have positive technical outlook:
OTP BANK formed a flag (or symmetrical triangle) continuation chart pattern.
RICHTER GEDEON formed a massive bullish ascending triangle.
Breakouts from these chart patterns should resume existing uptrends.
Will the unemployment rate in U.S. decline towards 6% in the following years? Here is a quote from Warren Buffett: “The U.S. unemployment rate could fall to as low as 6% within a few years. In an interview on Bloomberg TV, Buffett said the U.S. will come back big time on employment when residential construction recovers. An unemployment rate of 6% is possible within a few years.”
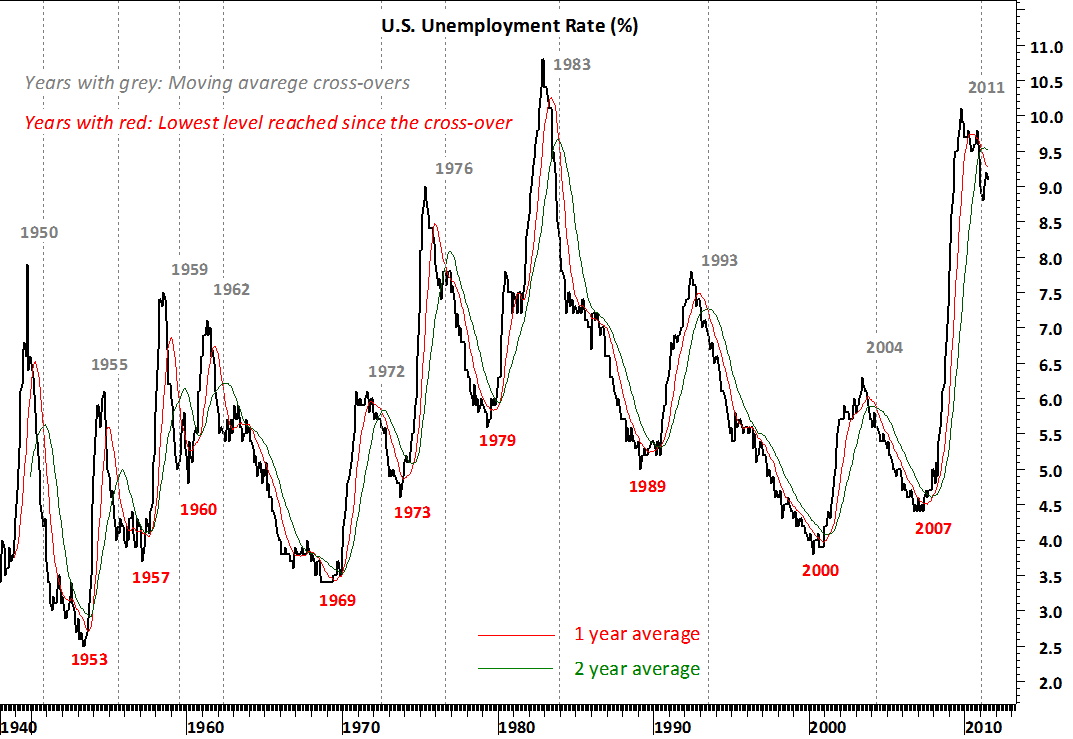
In this update I’m trying to understand and analyze the past behavior of the unemployment rate in the U.S. I’m using 1 & 2 year simple moving averages of the monthly data since 1948. The chart shows the years in grey color when moving averages crossed over (started a down trend in unemployment) and the years in red color when unemployment rate reached a low. Out of 9 cross-overs in the past six decade, 2 were short-lived and downtrend in unemployment rate reversed in the following year after the cross-over. These were during 1959-1960 and 1972-1973. After mild recoveries in the unemployment rate, economic outlook weakened and rate moved higher.
However, of the remaining 7 cross-overs in the past six decade, unemployment continued to decline for a minimum of 2 years and maximum of 7 years. Latest cross-over occurred in the beginning of 2011. If history is a guide in the worst case unemployment rate can continue lower for another year until 2012. In the best case we are headed towards 6% levels in the next 3-7 years.