GLOBAL EQUITY MARKETS – June 20, 2026

REVIEW


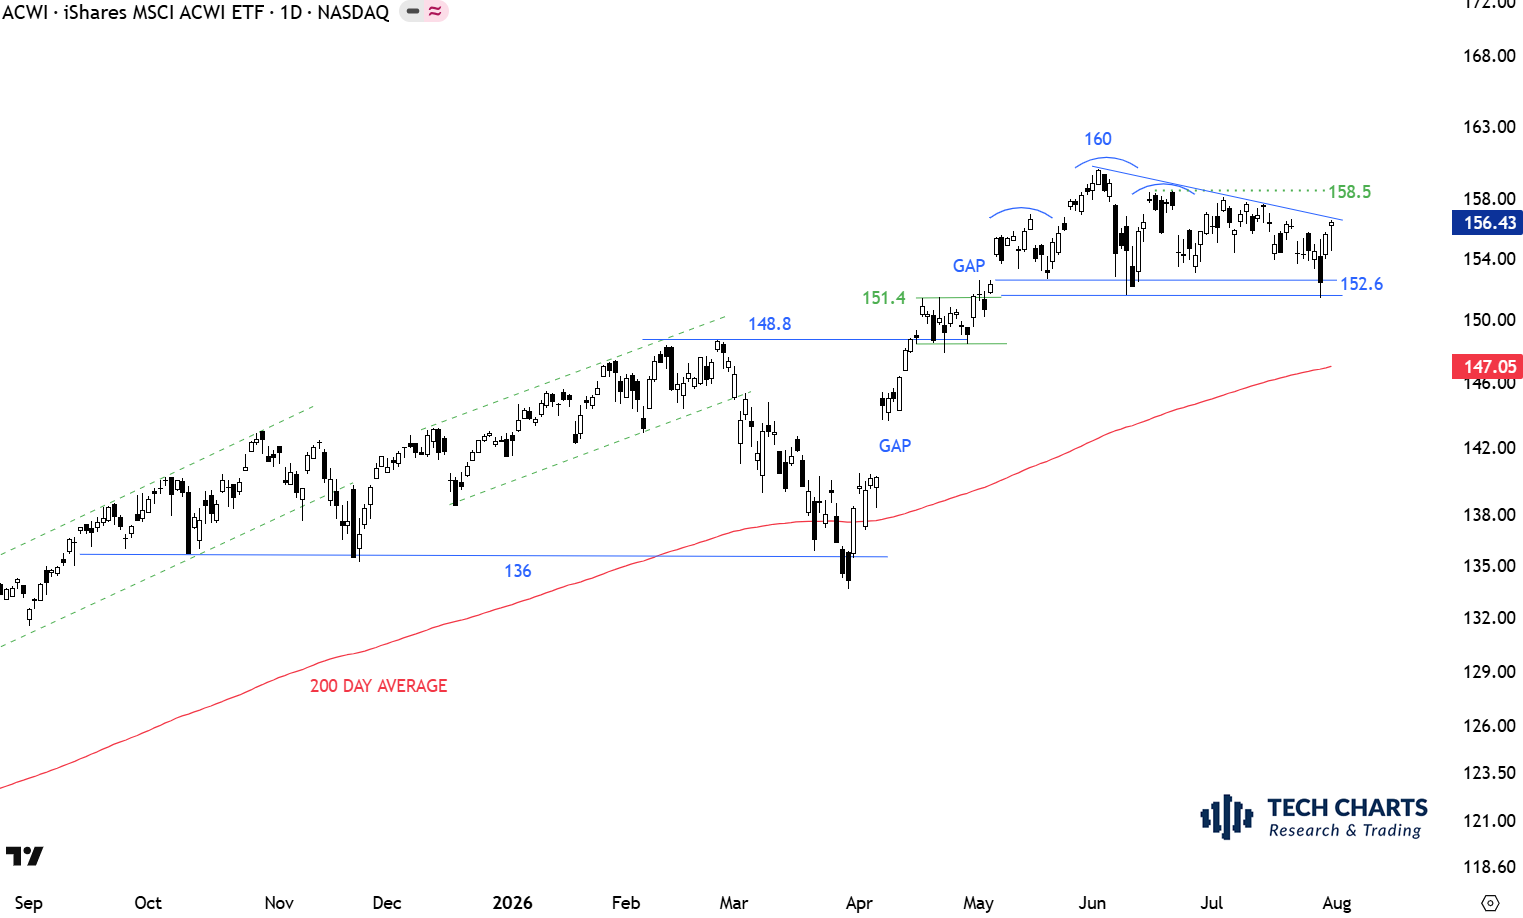
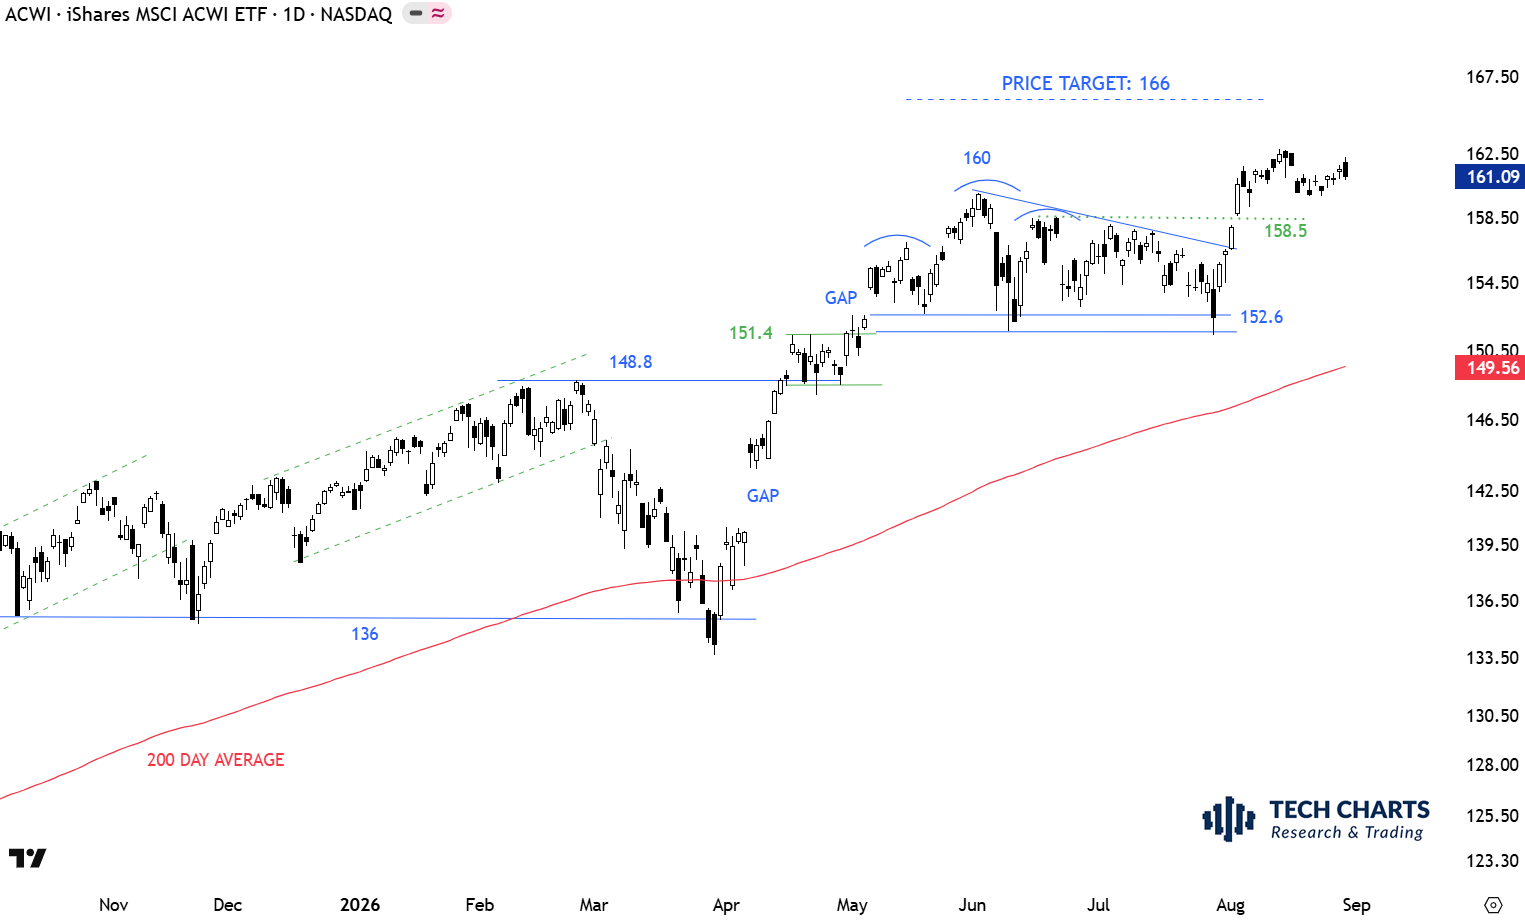
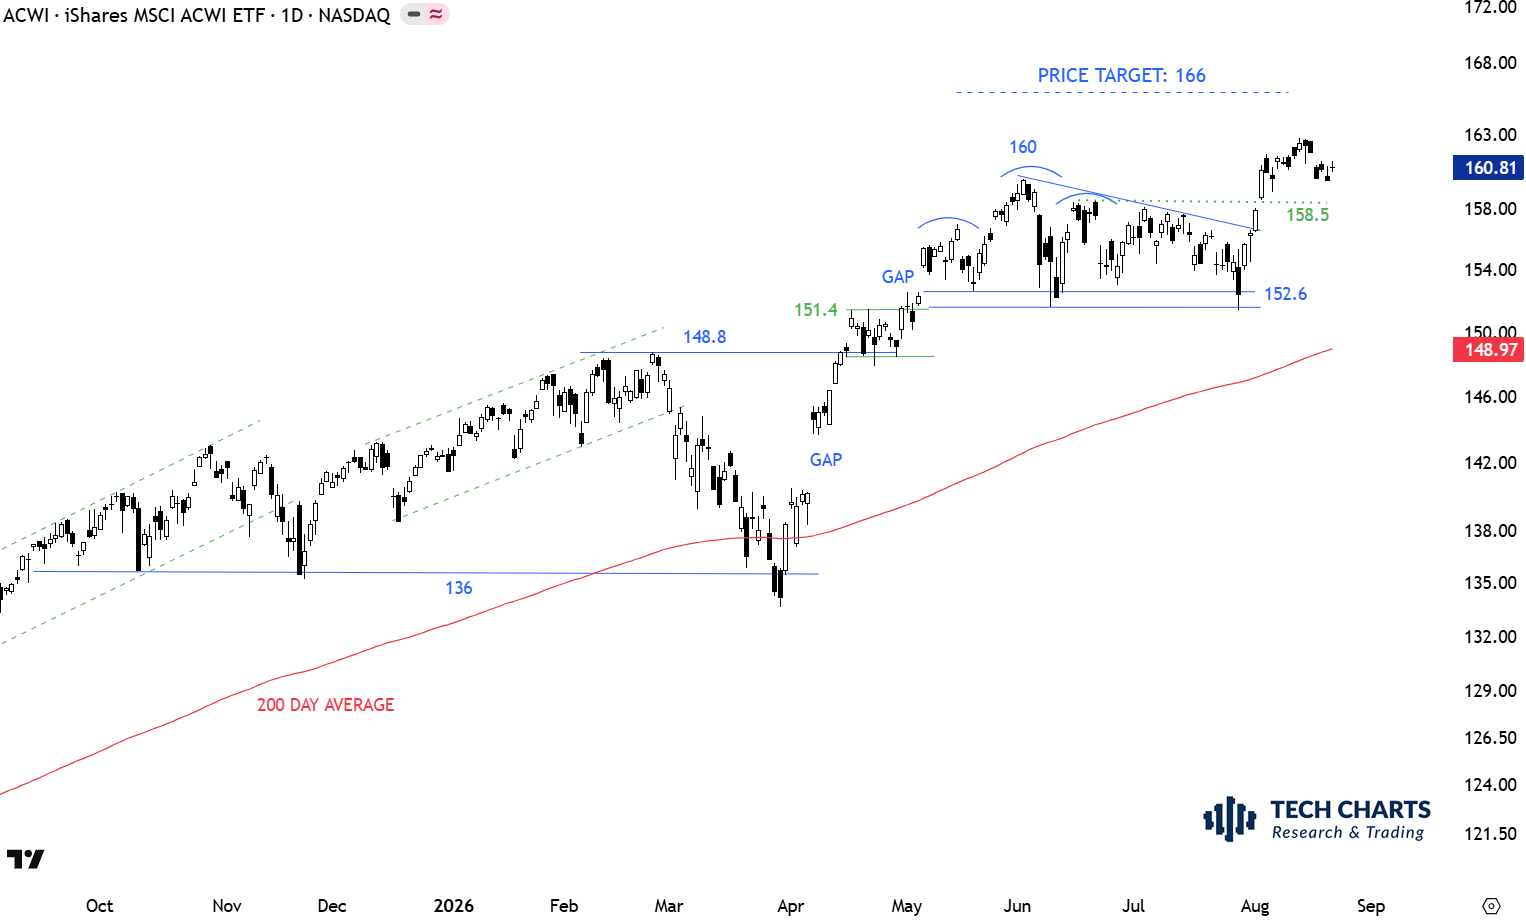
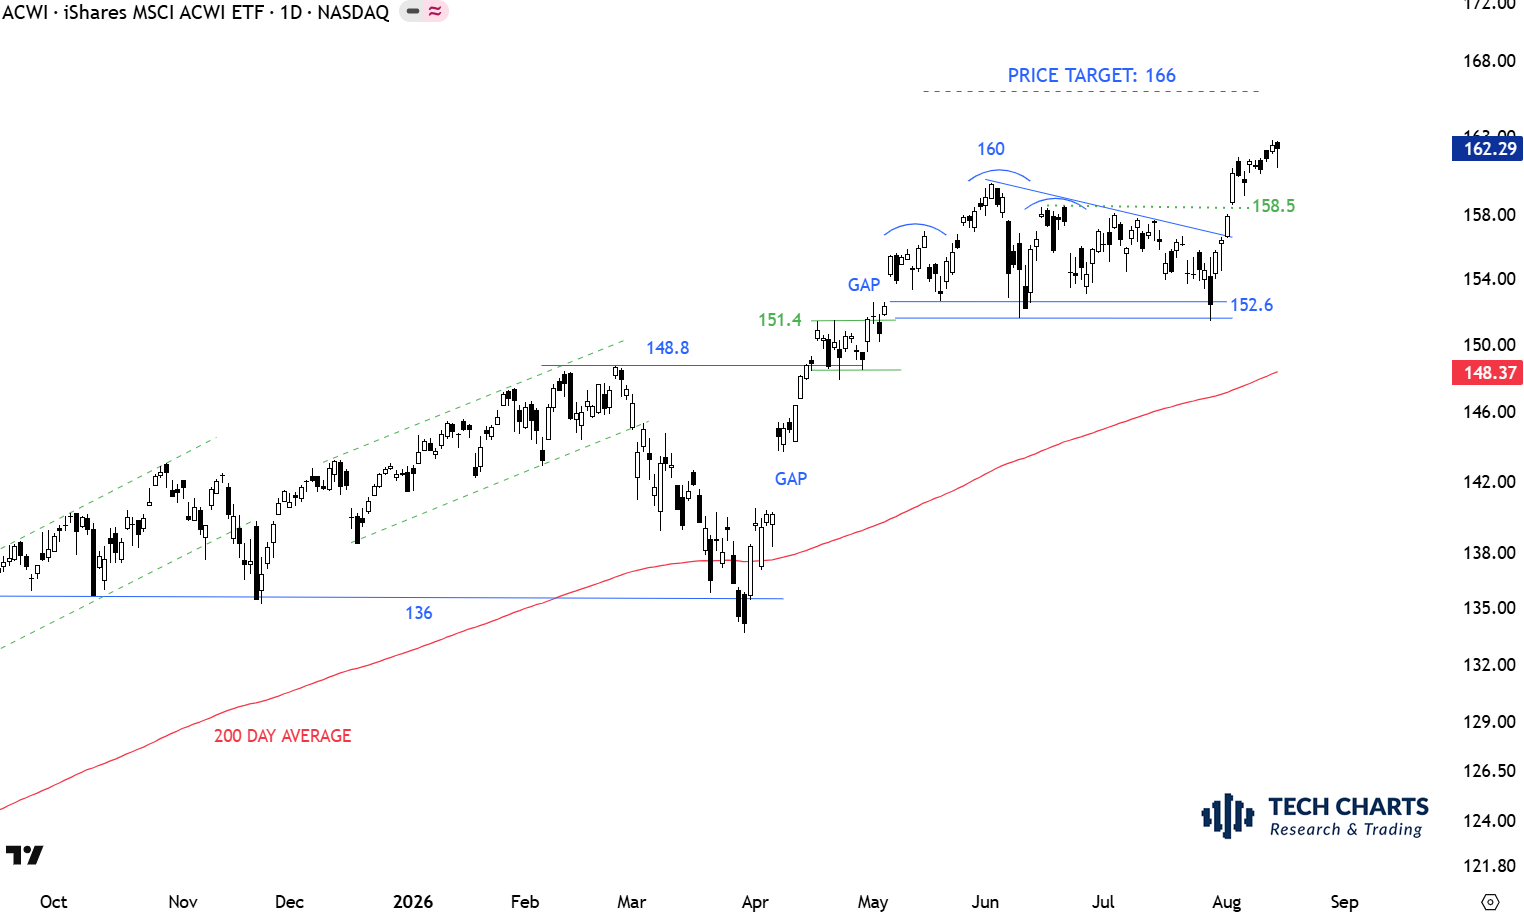
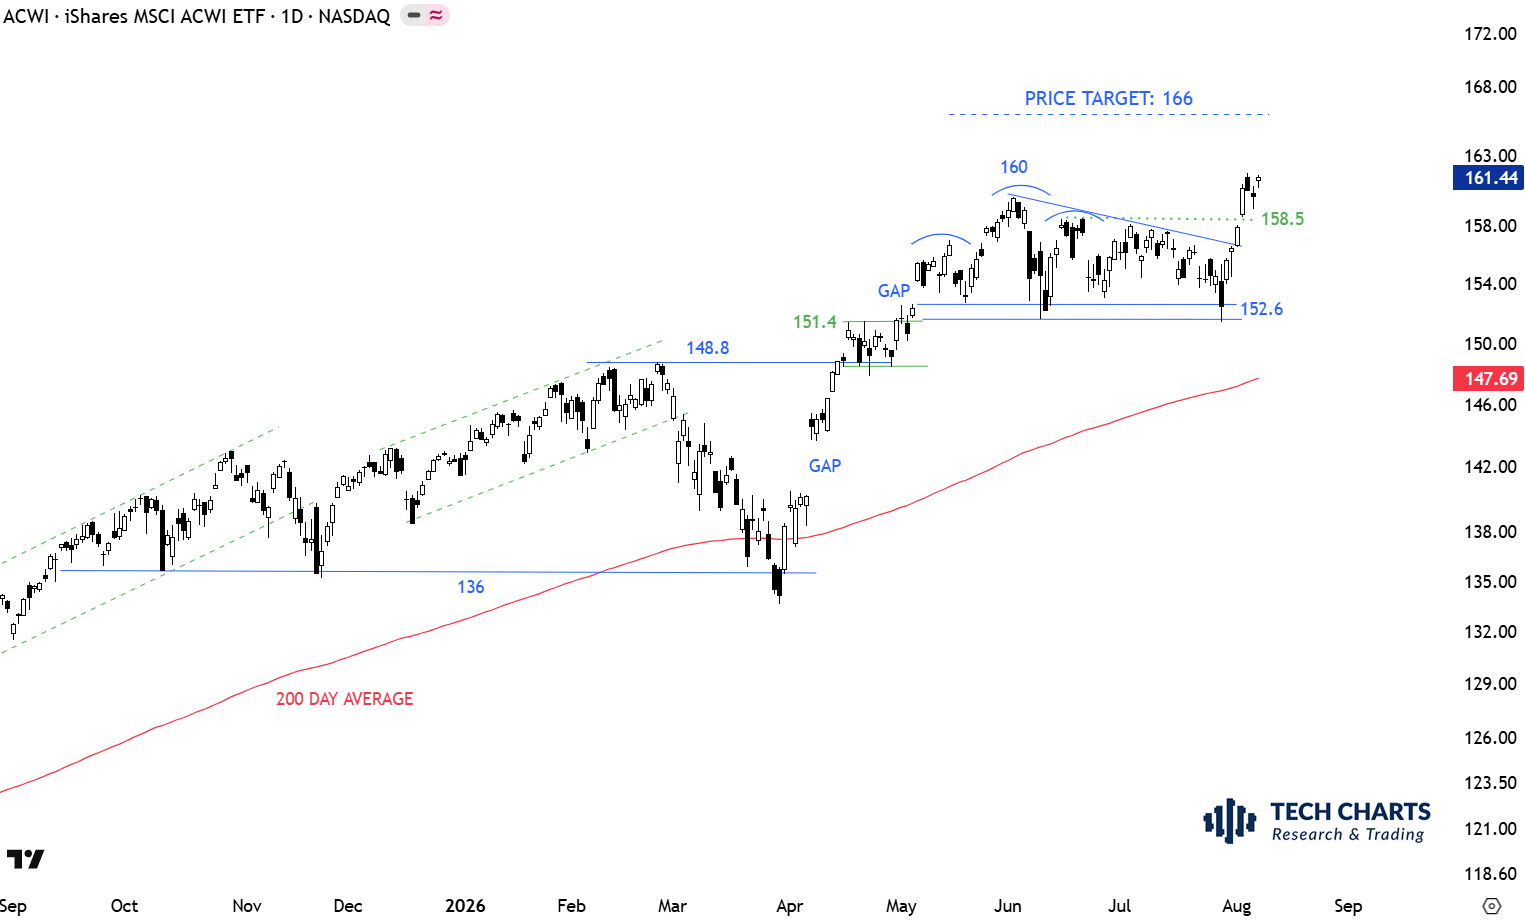
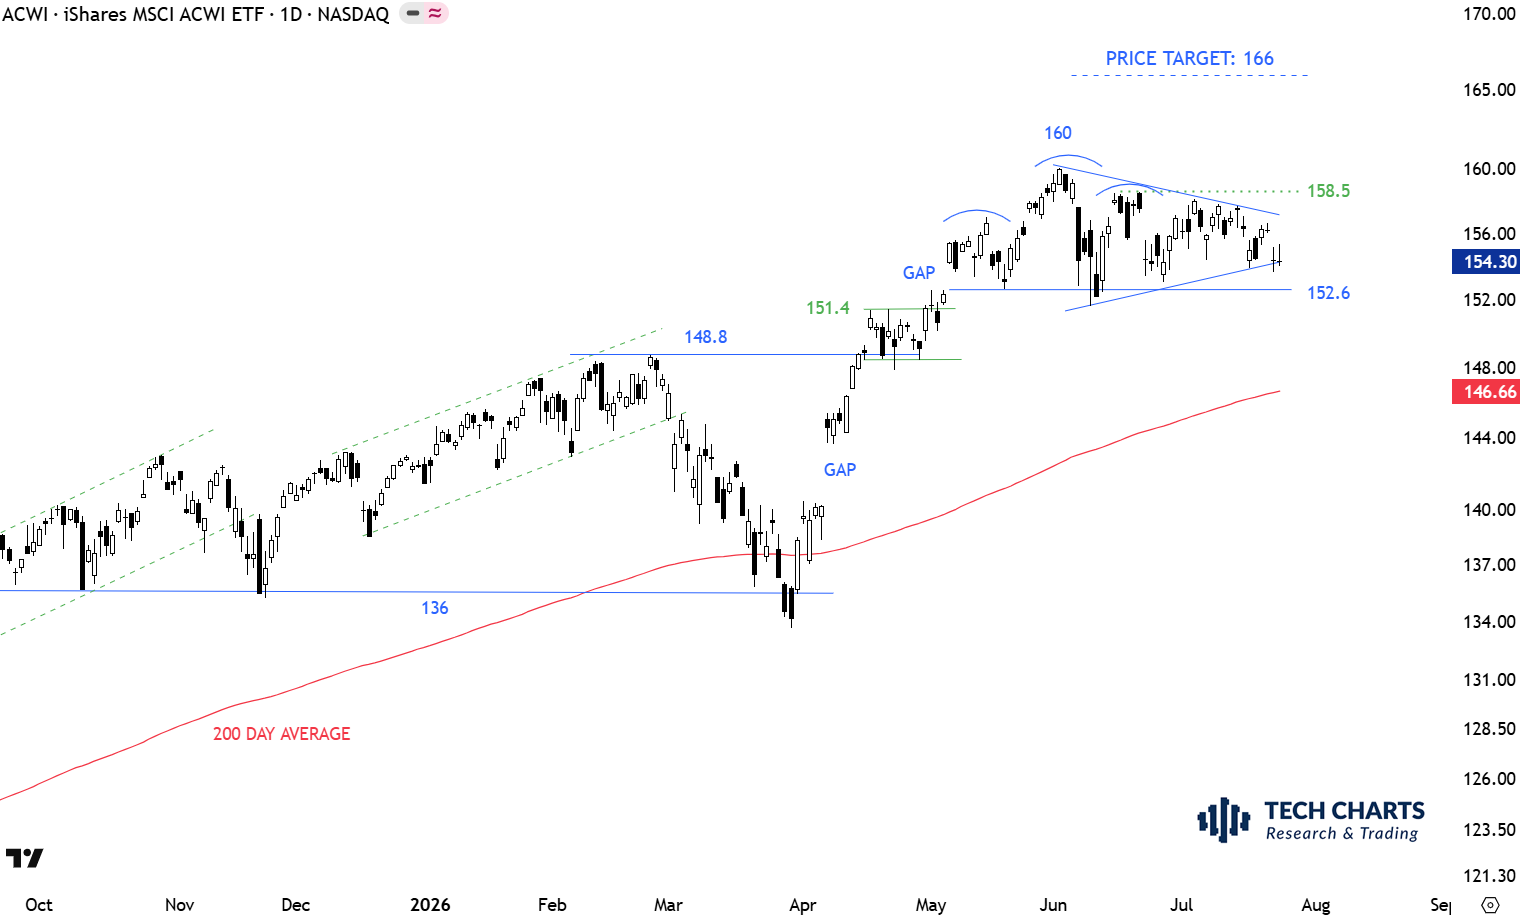
The benchmark for the Global equity markets performance, the iShares MSCI All Country World Index ETF (ACWI.O) is trading well above its 200-day average at 144.14. The gap above 151.4 was filled during short-term weakness. Last week’s sell-off tested the short-term support at 152.6 levels which is the level the ETF rebounded after filling the gap. There is no top reversal chart pattern on daily scale price chart. A possible short-term H&S top can develop if the ETF stalls at current levels and rolls over towards the support at 152.6. Such price action can form the right shoulder of a short-term H&S top. For now we can conclude that the uptrend is intact. Next short-term resistance is at 160 levels.


Read more

INTERIM UPDATE – June 19, 2026

After reviewing several daily end of day charts and weekly charts from the weekend research, these opportunities from Global Equities are worth bringing to your attention as they get closer to breakout levels and can confirm chart pattern setups before the week finalizes. These charts will be discussed in the weekend report as well with additional setups from Americas. 

Read more

BREAKOUT ROOM THURSDAY 18th of June 9:00 AM EEST (Eastern European Summer Time) – LIVE MEETING, CHARTS Q&A

BREAKOUT ROOM THURSDAY 18th of June 9:00 AM EEST (Eastern European Summer Time) – LIVE MEETING, CHARTS Q&A

Meeting Outline

  • Q&A on charts of your interest

Tech Charts Members,

We continue with our Breakout Room meetings to discuss charts of your interest. Due to our diverse geographical members base we will have 2 different breakout rooms in different time zones. Next week’s meeting will target Americas & Europe members. This meeting is scheduled for Asia & MEA members. I will share my screen and will pull up chart of your request and review patterns and opportunities from the perspective of classical charting principles. We had several meetings that were a success and we got the chance to review so much in the allocated time. I hope this time as well we will cover as many charts and questions as possible.

Read more

GLOBAL EQUITY MARKETS – June 13, 2026

REVIEW


The benchmark for the Global equity markets performance, the iShares MSCI All Country World Index ETF (ACWI.O) is trading well above its 200-day average at 143.60. The gap above 151.4 was filled during short-term weakness. Last week’s sell-off tested the short-term support at 152.6 levels which is the level the ETF rebounded after filling the gap. There is no top reversal chart pattern on daily scale price chart. A possible short-term H&S top can develop if the ETF stalls at current levels and rolls over towards the support at 152.6. Such price action can form the right shoulder of a short-term H&S top. For now we can conclude that the uptrend is intact. 


Read more

INTERIM UPDATE – June 12, 2026

After reviewing several daily end of day charts and weekly charts from the weekend research, these opportunities from Global Equities are worth bringing to your attention as they get closer to breakout levels and can confirm chart pattern setups before the week finalizes. These charts will be discussed in the weekend report as well with additional setups from Asia, Europe and MEA.

Read more

GLOBAL EQUITY MARKETS – June 6, 2026

REVIEW


The benchmark for the Global equity markets performance, the iShares MSCI All Country World Index ETF (ACWI.O) is trading well above its 200-day average at 143.03. The gap above 151.4 was filled during short-term weakness. Friday’s sell-off tested the short-term support at 152.6 levels which is the level the ETF rebounded after filling the gap. There is no top reversal chart pattern on daily scale price chart. Failure to hold above the short-term support can result in a test of 148.8 levels.  

Read more

CRYPTOCURRENCIES – June 1, 2026

BTCUSD forms a short-term rising channel with its support at 71.5K at risk with the recent correction. ETH/BTC in a downtrend channel. Trend is once again favoring BTC over ETH. Short-term consolidation on alt coins looking for directional move. 

Read more

Tech Charts Year in Review – Year Nine, May 2026 Webinar

Tech Charts Year in Review. Aksel compares the before and after of charts shared with Members over the last year followed by a live Q&A.

Tech Charts Year in Review – Year Nine

  • A study on Chart Pattern Reliability using available sample data from the past year.
  • Statistically significant and reliable top 3 chart patterns, rectangle, ascending triangle and H&S bottom will be under review.
  • Detailed statistics on different types of breakouts.
  • The impact of different market cycles on chart pattern opportunities.
  • Importance of weekly scale charts in pattern identification and daily charts for trade management
  • Live Q&A

Live questions from Members

  1. What would you advise on how to handle stop loss orders when markets open with a gap on the downside? Is that ‘set the SL and hope for the best’? 1:04:20
  2. Can one use the success rate of a pattern to prioritize when allocating funds for a particular asset? 1:05:50
  3. Is the pattern considered negated on an intraday setup or upon close under the negation line? 1:07:30
  4. Do you have any stats on the time it takes to reach the price objective (1st attempt)? It seems most trades should/could be months long or take place over a year. If you’re not planning on holding the company as an investment, what do you do? 1:08:28
  5. Questions on the new ATR entry level:
    Does it mean that the entry level will continuously change? So, will daily ATR monitoring be needed? Did you backtest it, and is it worth it? Does this mean the success rate is the same, but we capture more upside? Will you continue to show the static E&M entry level? 1:09:43

Recorded live 05.27.2026

Read more

GLOBAL EQUITY MARKETS – May 30, 2026

REVIEW


The benchmark for the Global equity markets performance, the iShares MSCI All Country World Index ETF (ACWI.O) is trading well above its 200-day average at 142.25. Price cleared the bullish flag with a gap opening. 148.8-151.4 area becomes the short-term support. Uptrend resumes as the short-term consolidation acts as bullish continuation. The gap above 151.4 was filled during short-term weakness. There is no top reversal chart pattern on daily scale price chart. 


Read more

Tech Charts Year in Review with Aksel – Wednesday, May 27th, 8:30 am mountain

Dear Tech Charts Members,

Tech Charts Year in Review. Aksel will compare the before and after of charts shared with Members over the last year. As always, we’ll end the webinar with a live Q&A.

Scheduled for: Wednesday, May 27, 2026, at 8:30 am mountain (register below)

Tech Charts Year in Review – Year Nine

  • A study on Chart Pattern Reliability with the available sample data over the past year.
  • Statistically significant and reliable top 3 chart patterns, rectangle, ascending triangle and H&S bottom will be under review.
  • Detailed statistics on different types of breakouts.
  • The impact of different market cycles on chart pattern opportunities.
  • Importance of weekly scale charts in pattern identification and daily charts for trade management
  • Live Q&A

Read more