GLOBAL EQUITY MARKETS – January 12, 2019
REVIEW
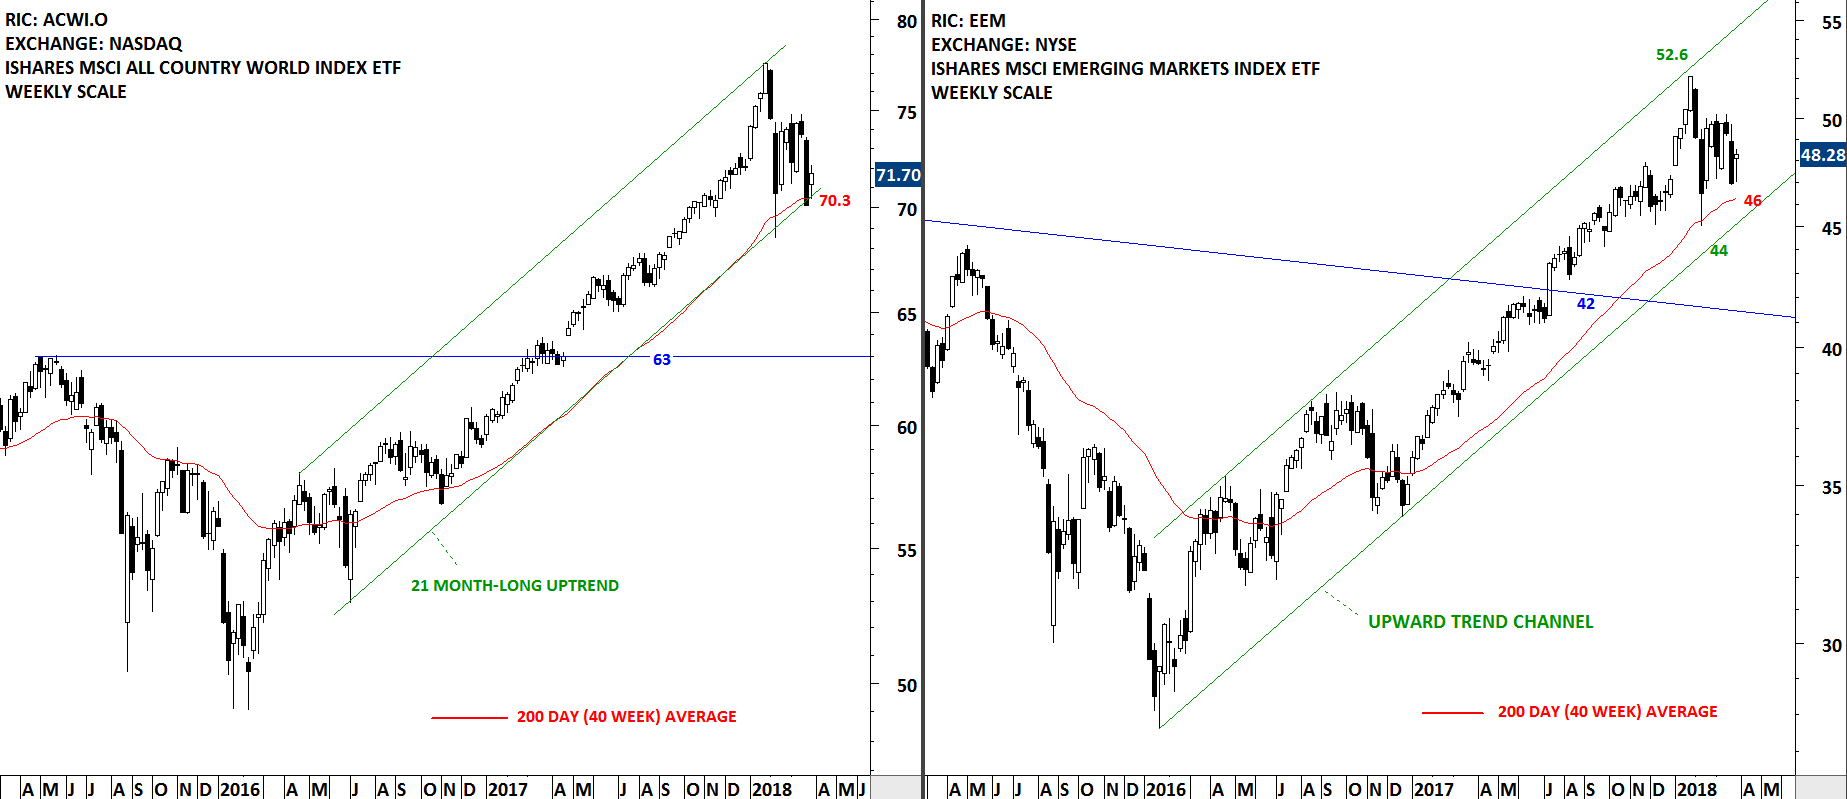
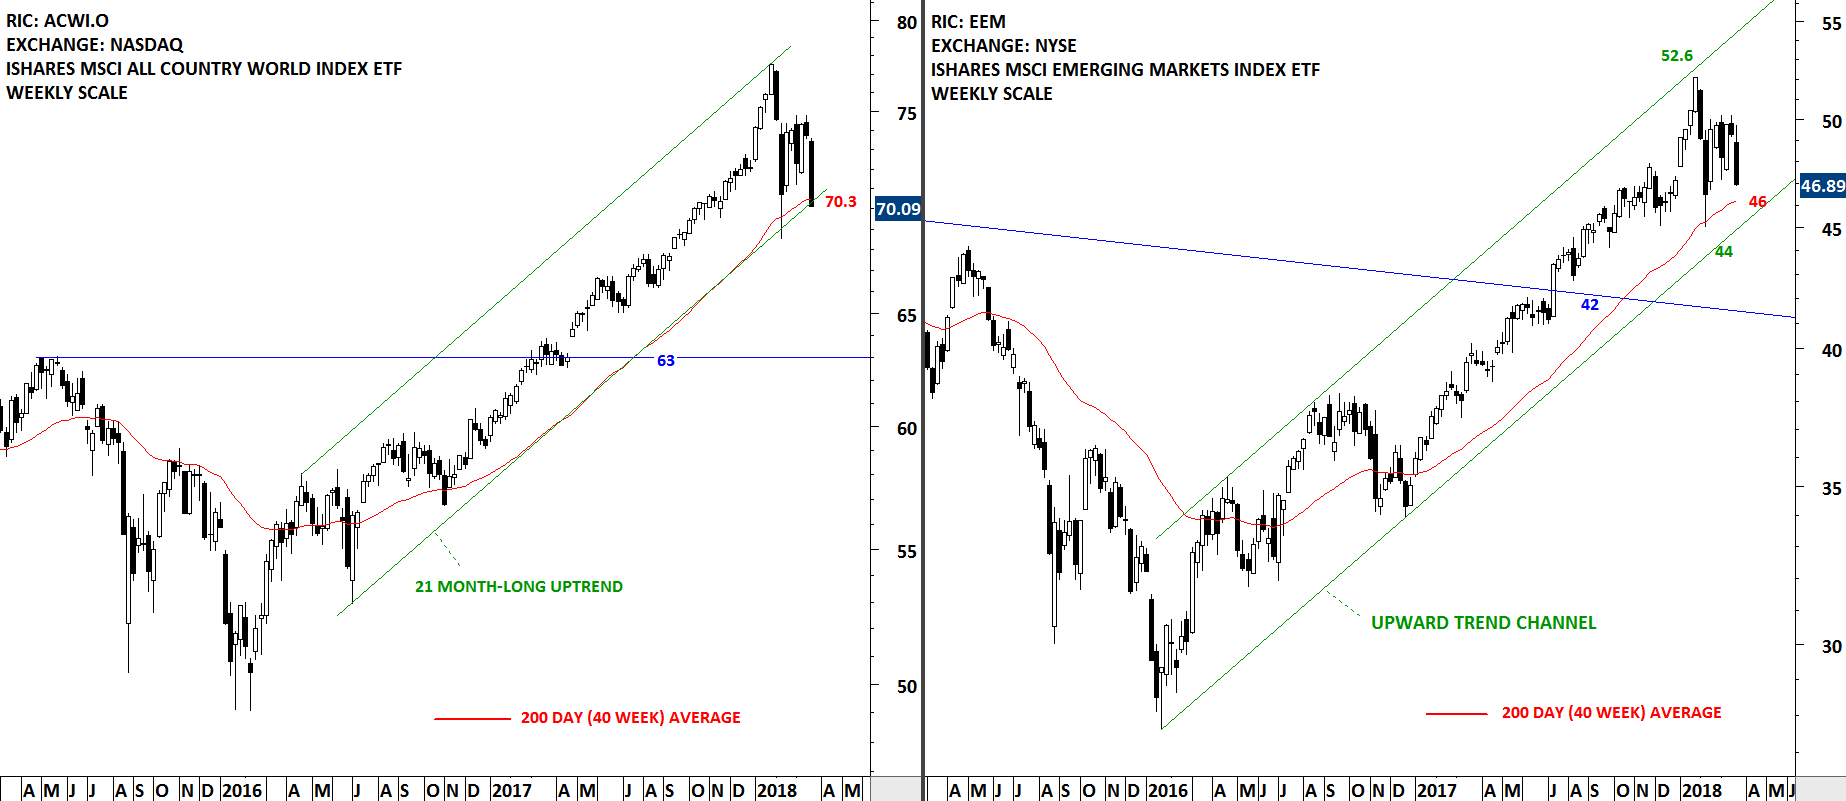
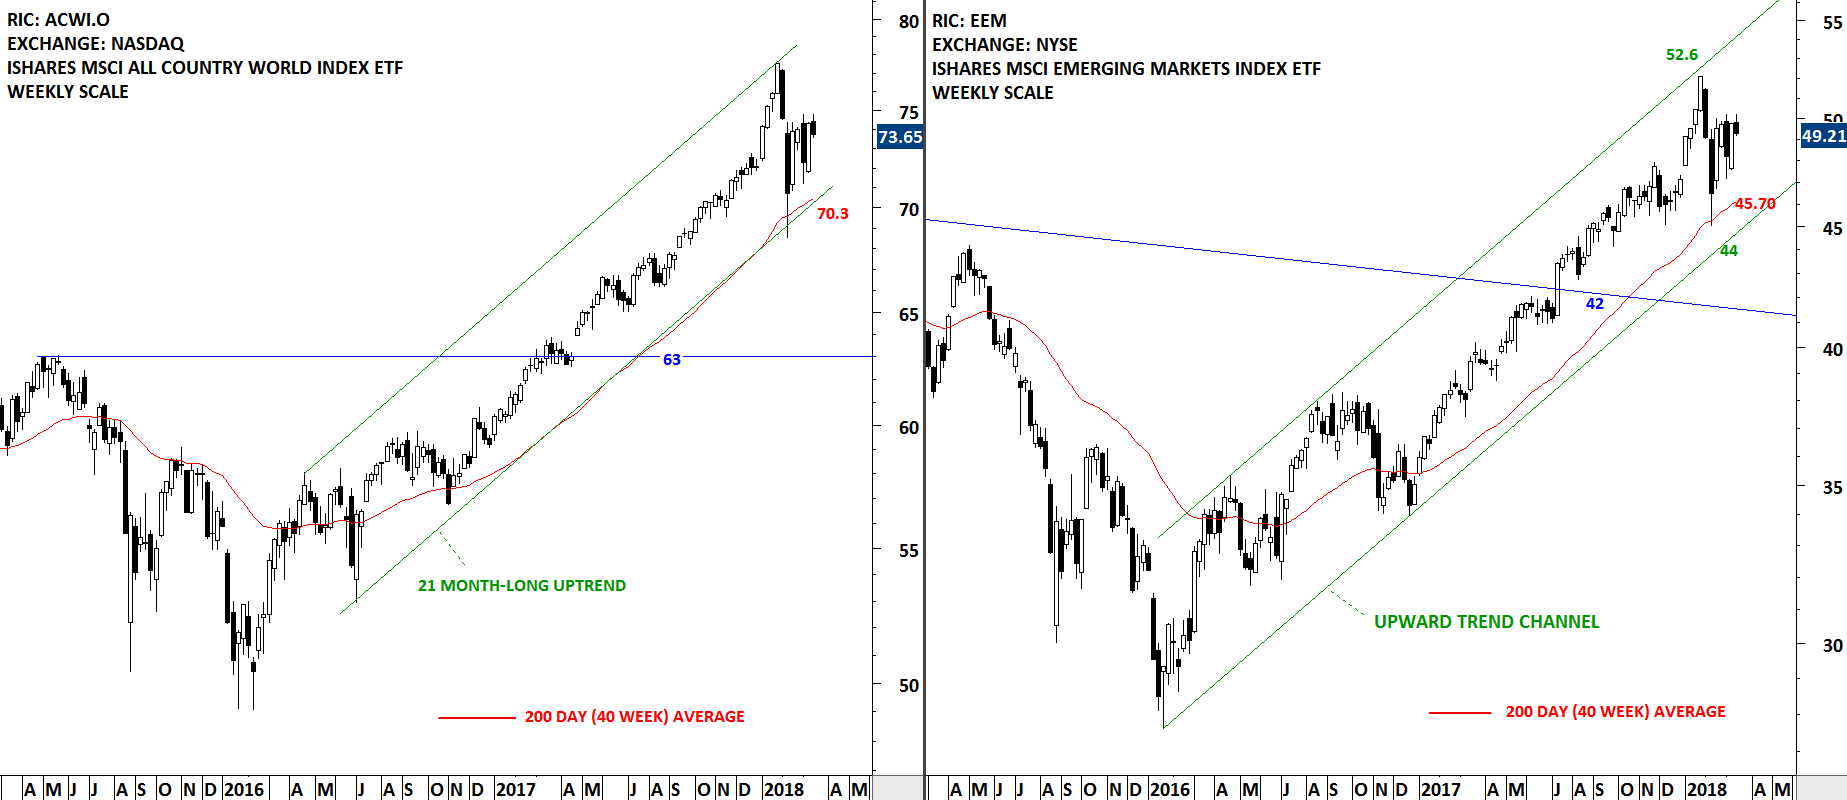
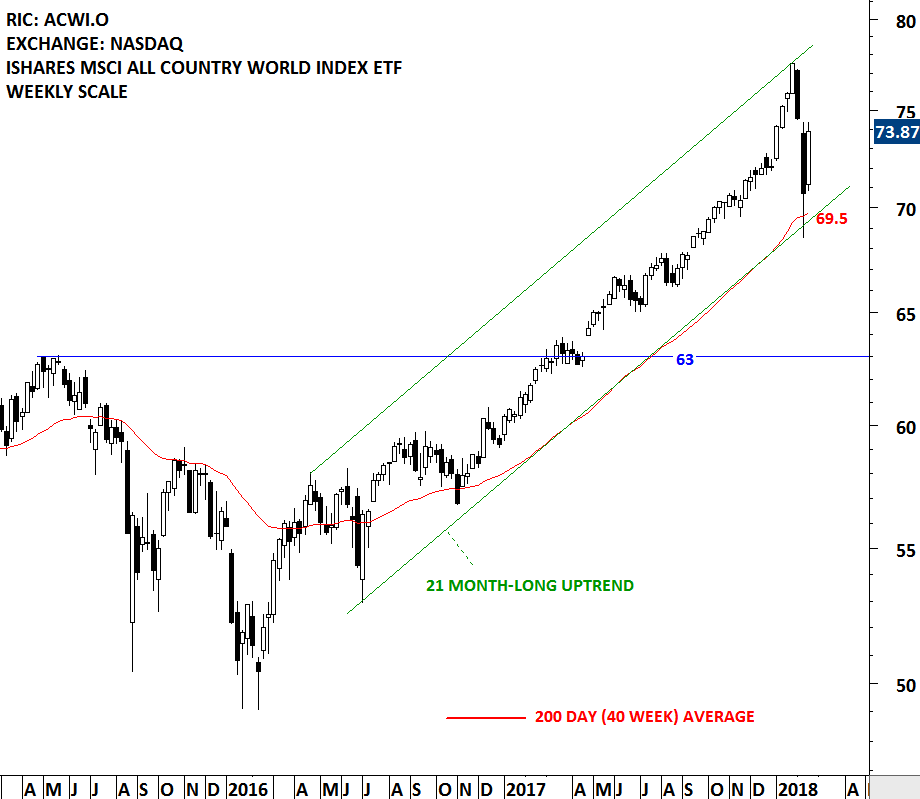
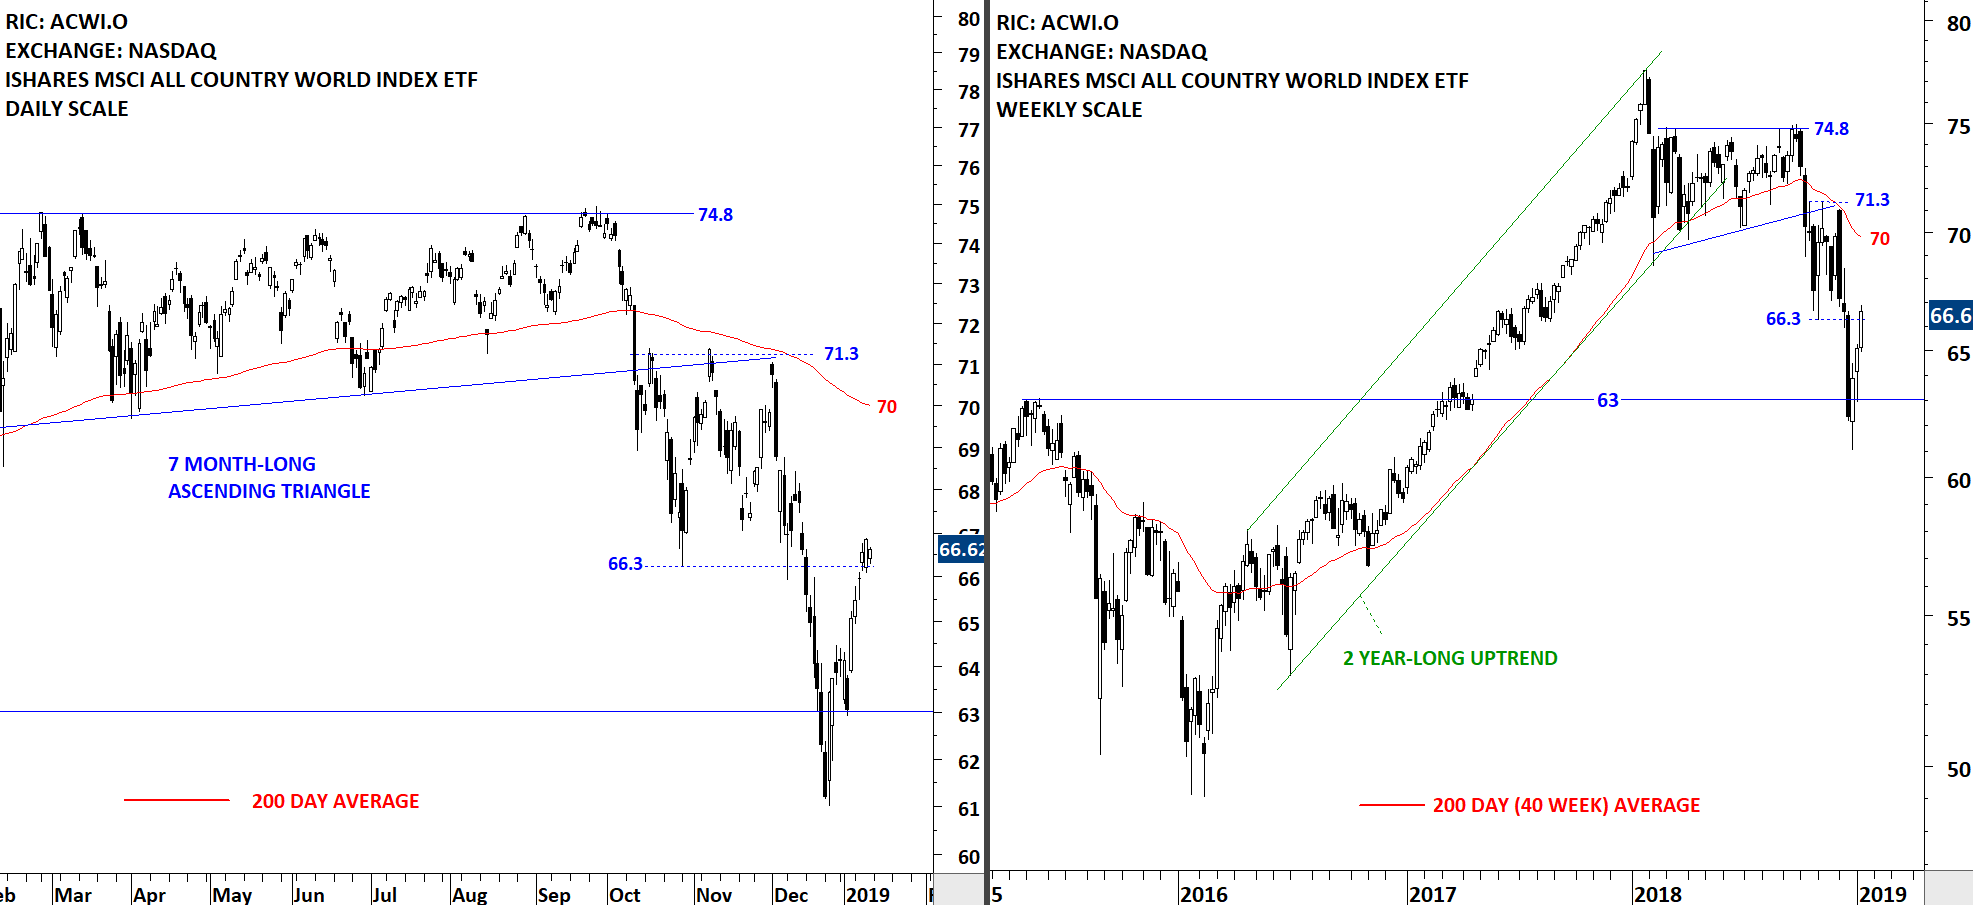
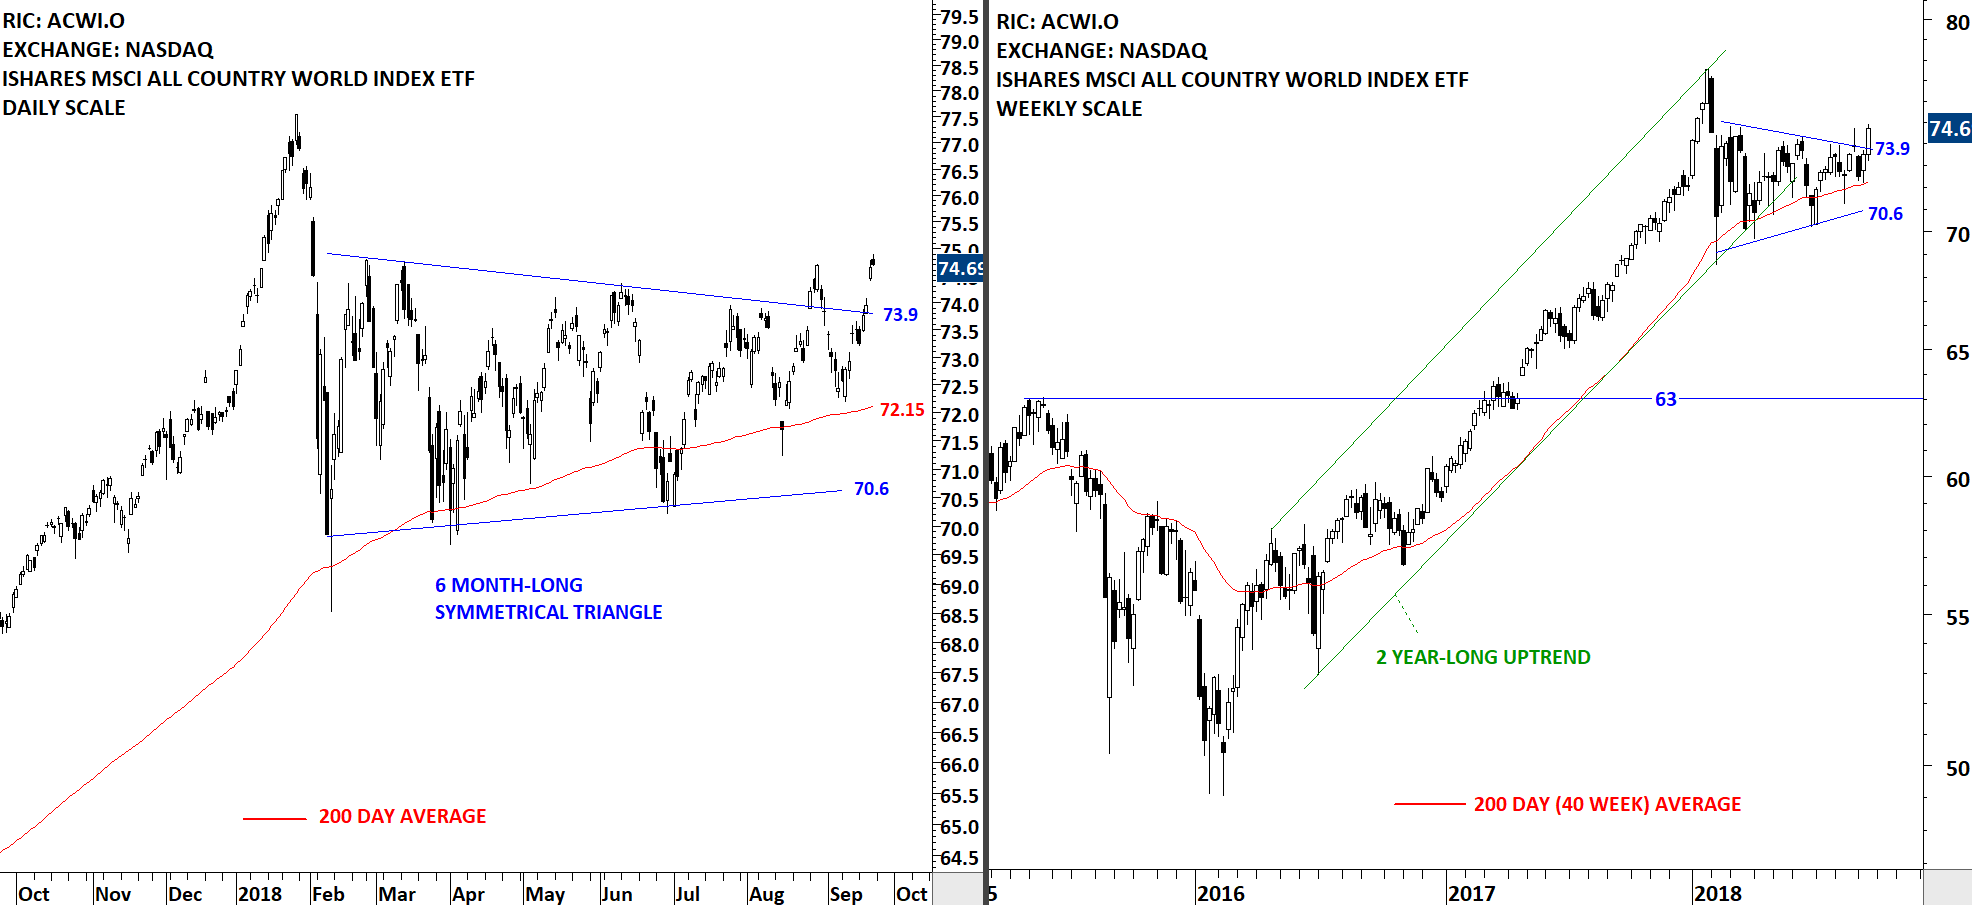
The iShares MSCI All Country World Index ETF, a measure of Global equity markets performance, had a sharp rebound from the support level at 63. Back to back weekly gains pushed the index towards the resistance area between 66.3 and 70. Is the recent rebound part of a bottoming process or a counter-trend rally in a downtrend? The answer lies in the following week's price action. V-bottom reversals are difficult to analyze and trade. If we have seen a V bottom and the ETF keeps climbing higher in the following weeks, I will wait for the price to stabilize above the long-term average. If there is a re-test of previous lows in an attempt to form a double bottom, then I will monitor the ETF for a long opportunity. The other possibility is that we see a short-term consolidation before moving higher. That again will alert me to look for bullish setups.
 Read More


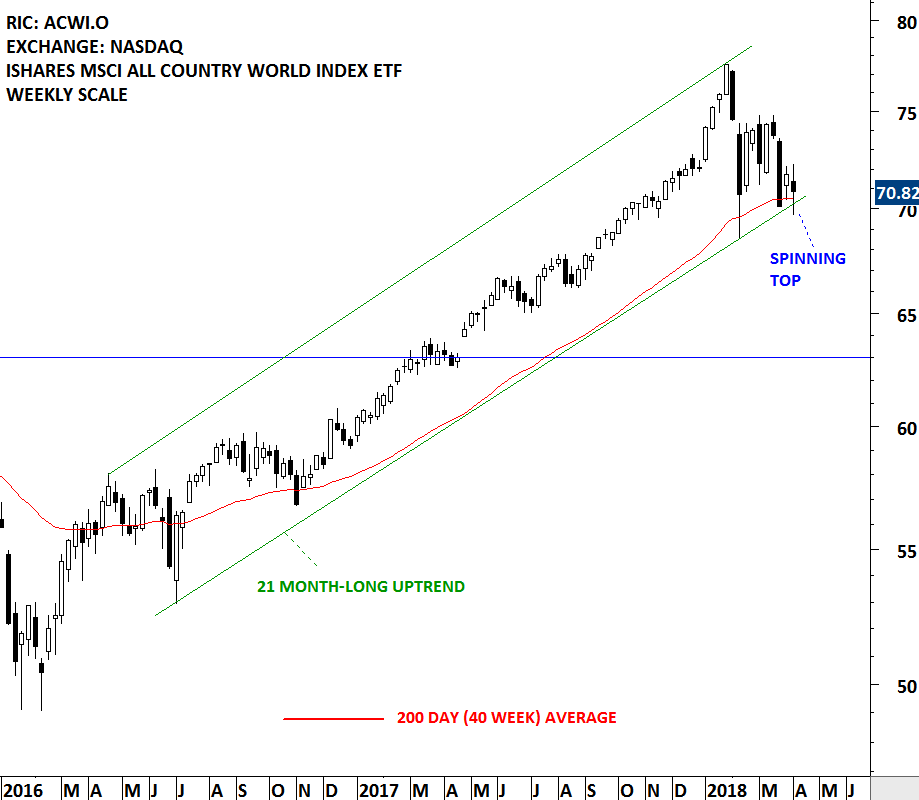
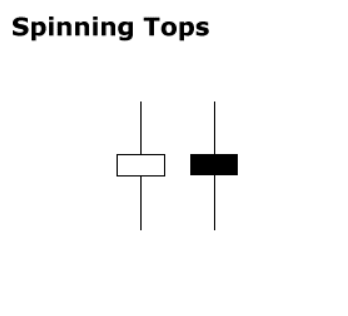 Indecision. Jury is still out. This week's price action is best explained with the help of candlestick patterns definitions. Spinning top is a candlestick with a long upper shadow, long lower shadow, and small real body. One long shadow represents a reversal of sorts; spinning tops represent indecision. The small real body (whether hollow or filled) shows little movement from open to close, and the shadows indicate that both bulls and bears were active during the session. Even though the week opened and closed with little change, prices moved significantly higher and lower in the meantime. Neither buyers nor sellers could gain the upper hand and the result was a standoff. After a long advance or long white candlestick, a spinning top indicates weakness among the bulls and a potential change or interruption in trend. After a long decline (I think this is what we experienced over the past 3 weeks) or long black candlestick, a spinning top indicates weakness among the bears and a potential change or interruption in trend.