GLOBAL EQUITY MARKETS – July 4, 2026
REVIEW
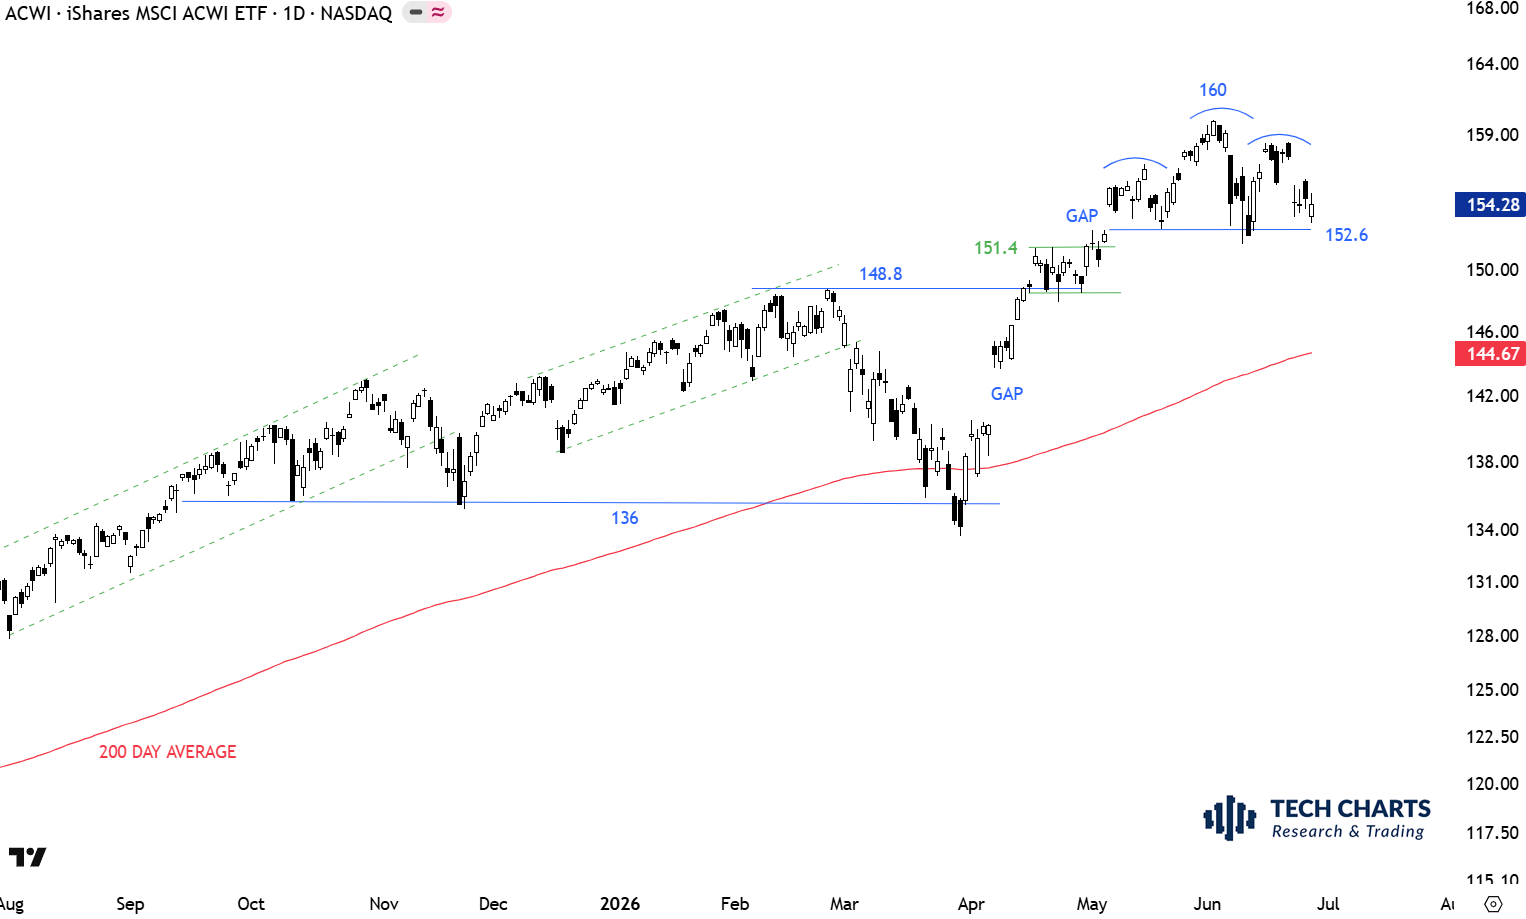
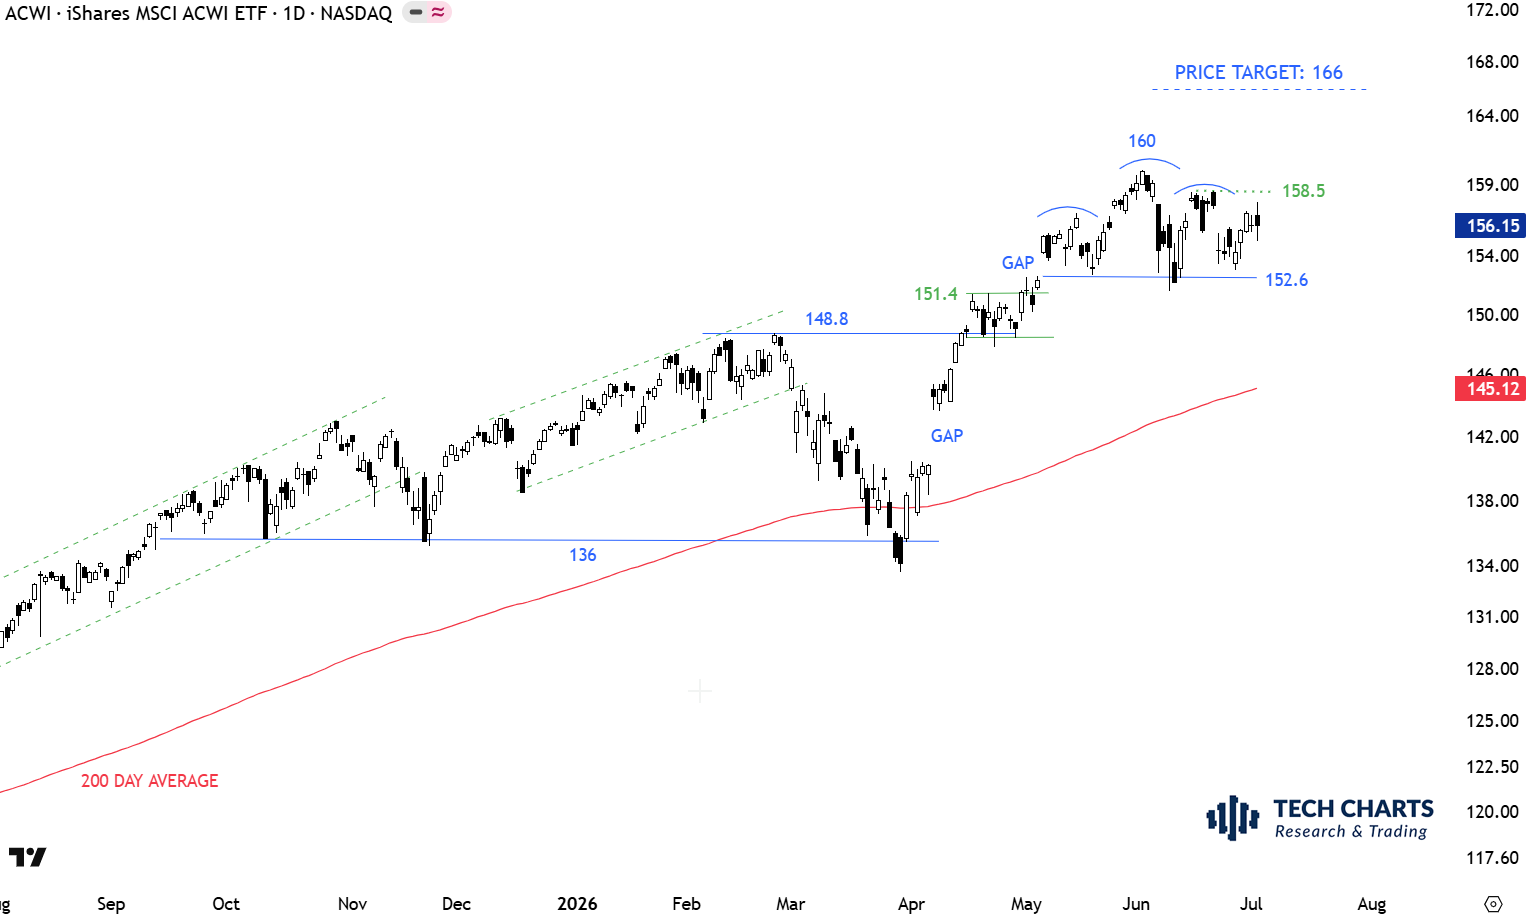
The benchmark for the Global equity markets performance, the iShares MSCI All Country World Index ETF (ACWI.O) is trading well above its 200-day average at 144.67. The gap above 151.4 was filled during short-term weakness. Breakdown below 152.6 levels can complete a short-term top and can become part of a reversion to the mean. Bearish chart pattern completions above the long-term averages are more prone to failure as they take place against the overall trend. Breach of the high of right shoulder at 158.5 can result in a H&S top failure and offer a long signal with the price target of 166 levels.
 Read More