BREAKOUT ROOM JUNE 18, 2026 – LIVE MEETING, CHARTS Q&A (Recording)
BREAKOUT ROOM JUNE 18, 2026 - LIVE MEETING, CHARTS Q&A (Recording)
Meeting Outline- Q&A on charts of your interest
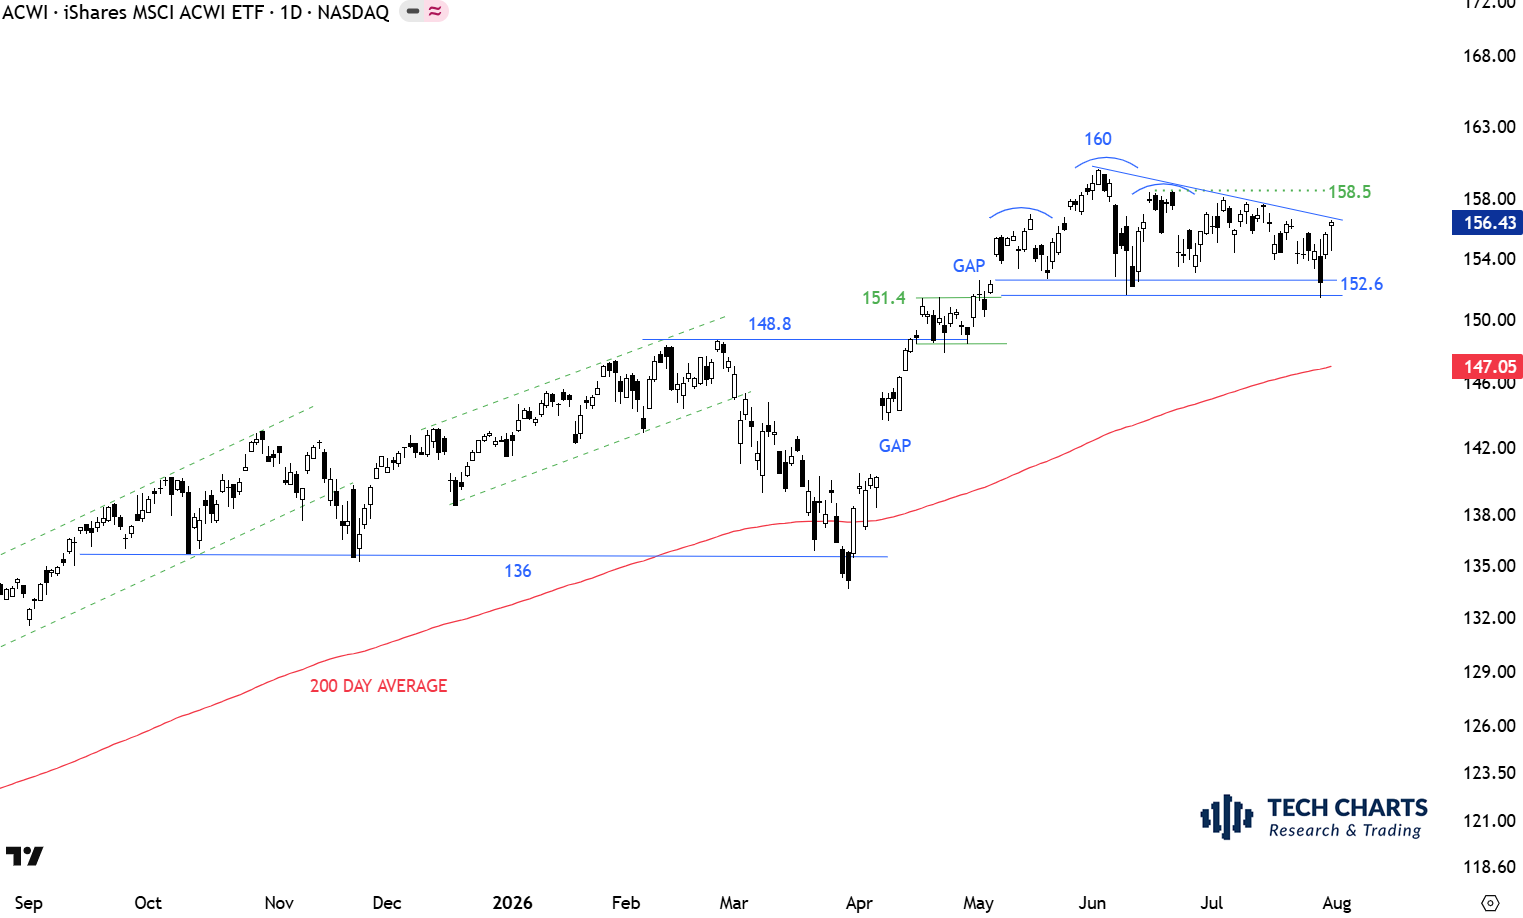
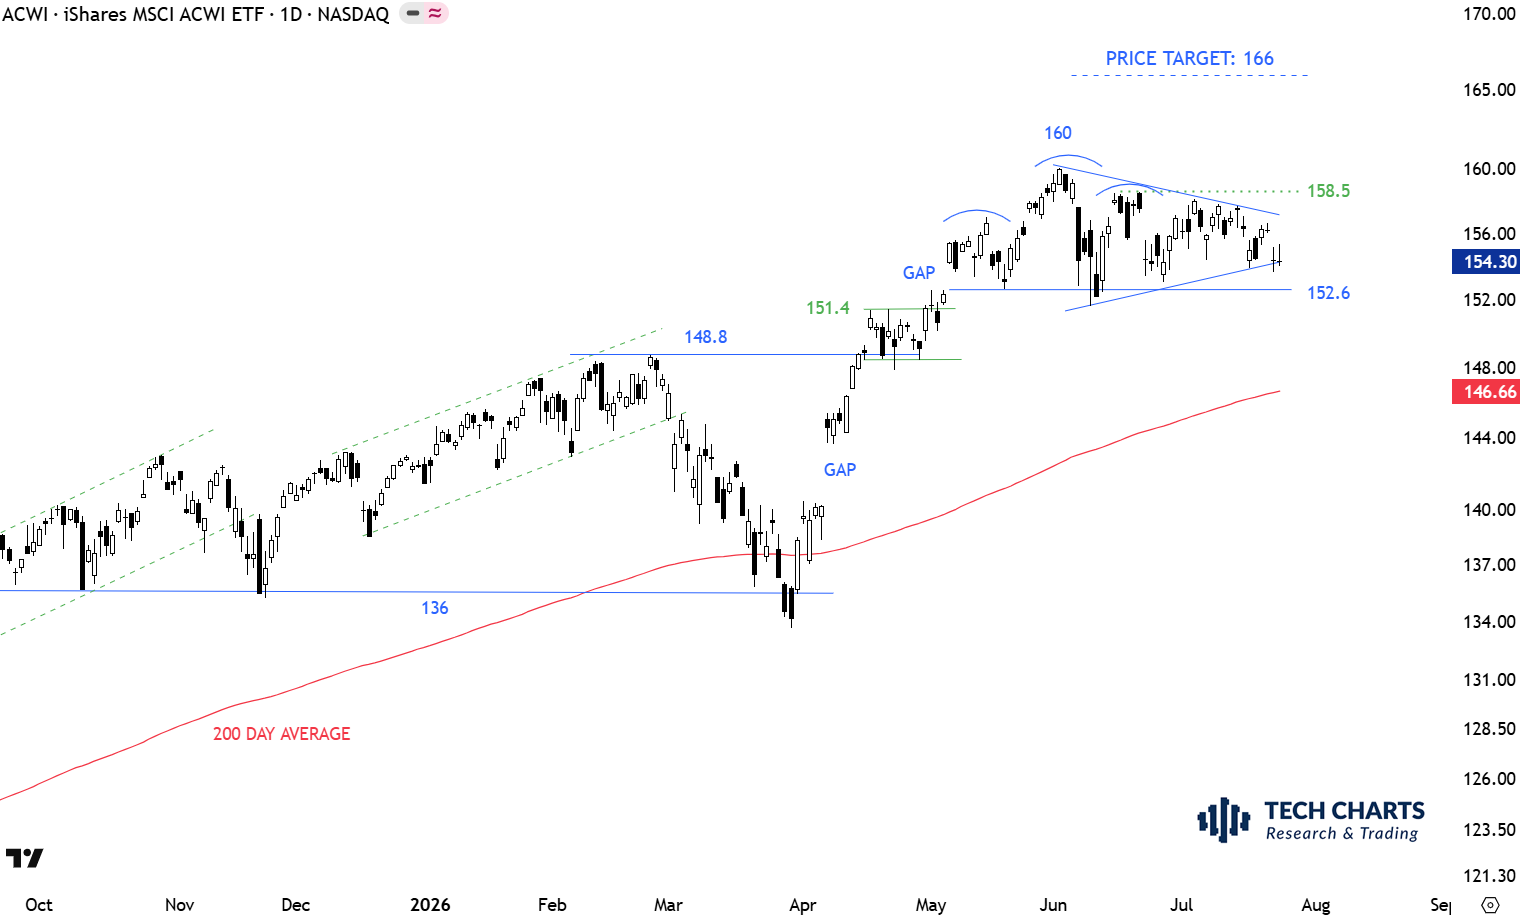
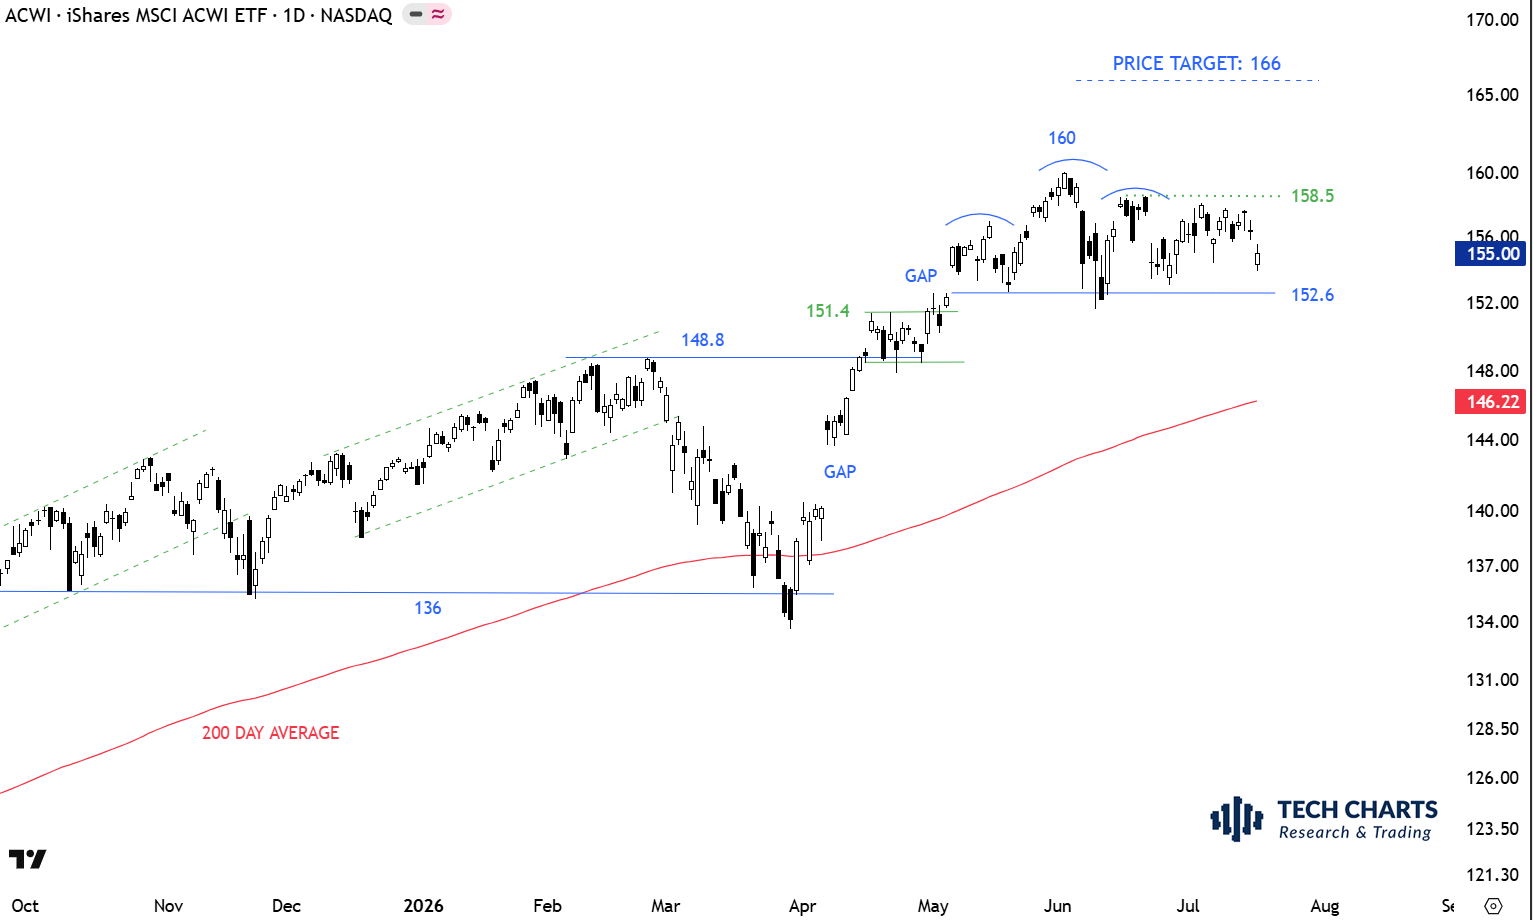
The benchmark for the Global equity markets performance, the iShares MSCI All Country World Index ETF (ACWI.O) is trading well above its 200-day average at 144.14. The gap above 151.4 was filled during short-term weakness. Last week's sell-off tested the short-term support at 152.6 levels which is the level the ETF rebounded after filling the gap. There is no top reversal chart pattern on daily scale price chart. A possible short-term H&S top can develop if the ETF stalls at current levels and rolls over towards the support at 152.6. Such price action can form the right shoulder of a short-term H&S top. For now we can conclude that the uptrend is intact. Next short-term resistance is at 160 levels.
Read MoreAfter reviewing several daily end of day charts and weekly charts from the weekend research, these opportunities from Global Equities are worth bringing to your attention as they get closer to breakout levels and can confirm chart pattern setups before the week finalizes. These charts will be discussed in the weekend report as well with additional setups from Americas.
Tech Charts Members,
We continue with our Breakout Room meetings to discuss charts of your interest. Due to our diverse geographical members base we will have 2 different breakout rooms in different time zones. Next week's meeting will target Americas & Europe members. This meeting is scheduled for Asia & MEA members. I will share my screen and will pull up chart of your request and review patterns and opportunities from the perspective of classical charting principles. We had several meetings that were a success and we got the chance to review so much in the allocated time. I hope this time as well we will cover as many charts and questions as possible.
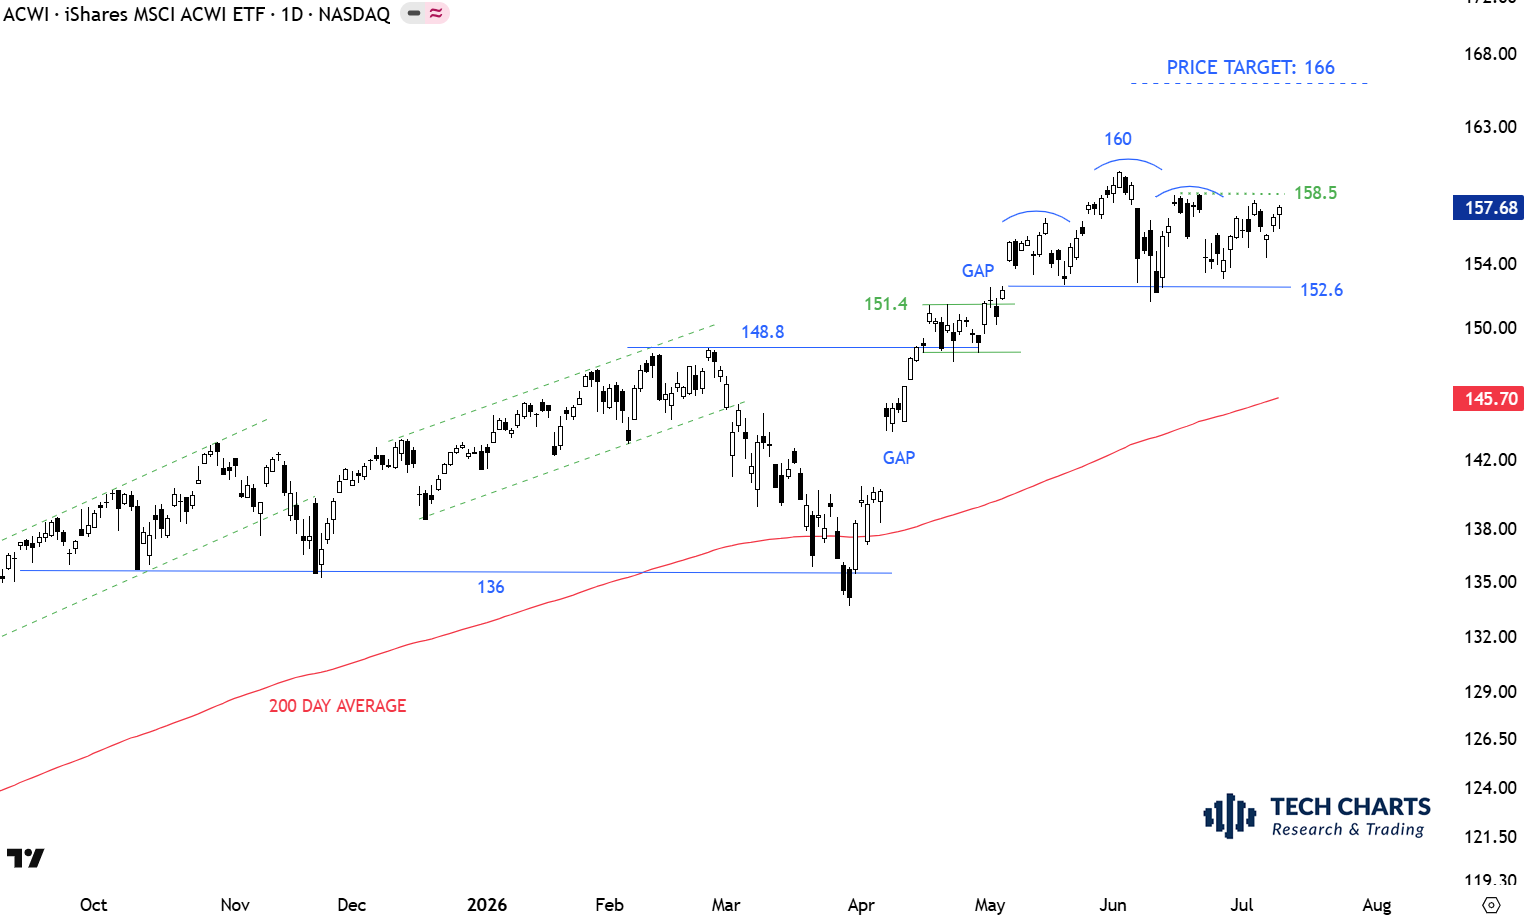
Read MoreThe benchmark for the Global equity markets performance, the iShares MSCI All Country World Index ETF (ACWI.O) is trading well above its 200-day average at 143.60. The gap above 151.4 was filled during short-term weakness. Last week's sell-off tested the short-term support at 152.6 levels which is the level the ETF rebounded after filling the gap. There is no top reversal chart pattern on daily scale price chart. A possible short-term H&S top can develop if the ETF stalls at current levels and rolls over towards the support at 152.6. Such price action can form the right shoulder of a short-term H&S top. For now we can conclude that the uptrend is intact.
Read MoreAfter reviewing several daily end of day charts and weekly charts from the weekend research, these opportunities from Global Equities are worth bringing to your attention as they get closer to breakout levels and can confirm chart pattern setups before the week finalizes. These charts will be discussed in the weekend report as well with additional setups from Asia, Europe and MEA.
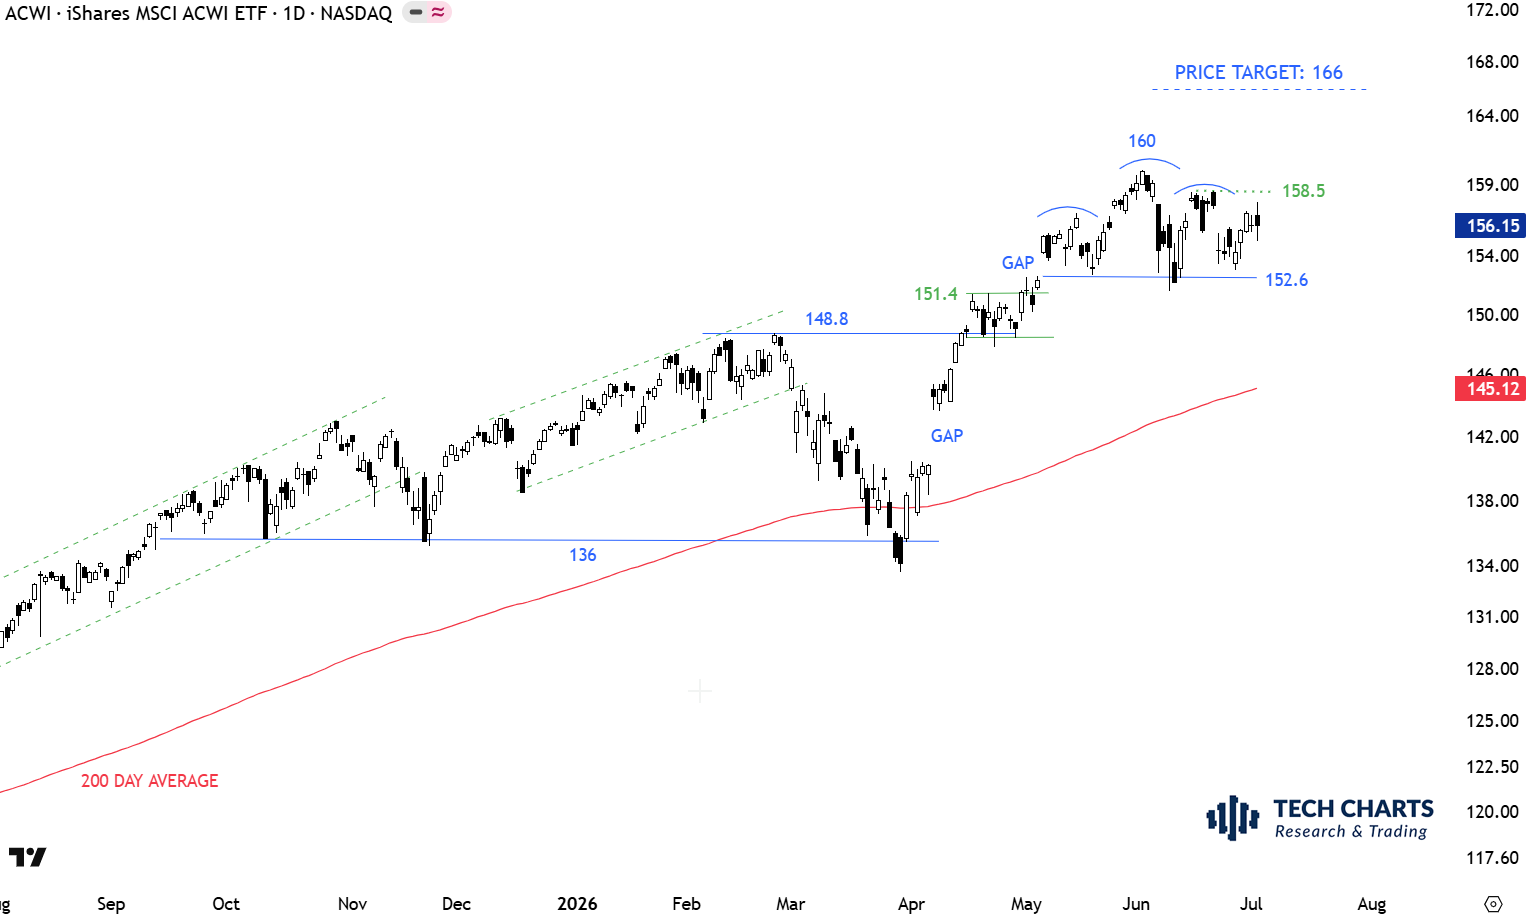
The benchmark for the Global equity markets performance, the iShares MSCI All Country World Index ETF (ACWI.O) is trading well above its 200-day average at 143.03. The gap above 151.4 was filled during short-term weakness. Friday's sell-off tested the short-term support at 152.6 levels which is the level the ETF rebounded after filling the gap. There is no top reversal chart pattern on daily scale price chart. Failure to hold above the short-term support can result in a test of 148.8 levels.
Read MoreBTCUSD forms a short-term rising channel with its support at 71.5K at risk with the recent correction. ETH/BTC in a downtrend channel. Trend is once again favoring BTC over ETH. Short-term consolidation on alt coins looking for directional move.
The benchmark for the Global equity markets performance, the iShares MSCI All Country World Index ETF (ACWI.O) is trading well above its 200-day average at 142.25. Price cleared the bullish flag with a gap opening. 148.8-151.4 area becomes the short-term support. Uptrend resumes as the short-term consolidation acts as bullish continuation. The gap above 151.4 was filled during short-term weakness. There is no top reversal chart pattern on daily scale price chart.
Read More